
The rise of LLMs has made summarising text faster than ever. As a result, researchers are increasingly handing large volumes of data over to AI to analyse. But this is likely to be introducing several errors and biases, which don’t always get the attention they deserve in research papers.
An important principle in data science is that any processing you do on a dataset can potentially introduce errors. Even something as simple as adding up numbers can have a whole bunch of hidden assumptions and failure modes. Are those negative numbers valid? What do you do with NA values? Are data points missing at random, or are certain groups under-represented? Each decision – or lack of decision – increases the risk that the final number won’t mean what we think it means.
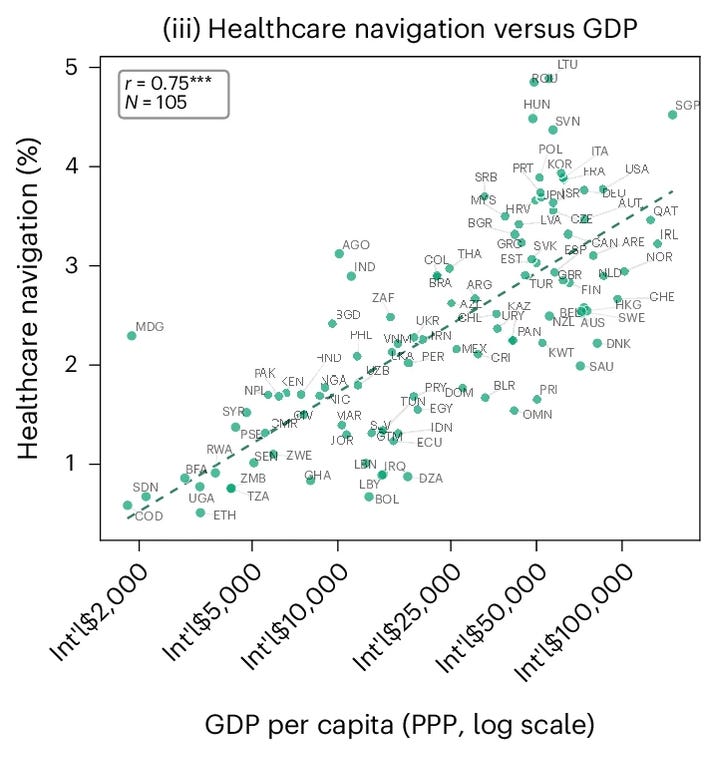
LLMs are basically a turbocharged version of these uncertainty-inducing processing steps. And often, studies include several such steps in sequence. For example, a new paper in Nature Health looked at half a million Copilot conversations across 109 countries and got AI to group them into 8 different categories of user intent. The paper then compared their findings to various national indicators, like GDP:
How did the study work out the user intents when it came to Copilot? It used an unspecified LLM to classify each data point, as described in a previous study:
an LLM-based classifier assigns each conversation to 1 of 12 health intent categories
A sample of 131 conversations were then labelled by a human specialist, with 110 exact matches across the 12-category taxonomy, i.e. 84% agreement between the LLM and human annotators.
With 109 countries and 8 types of intent (the 4 least common categories were dropped in the follow up analysis), there are 872 country-intent combinations in total. Yet, as we’ve just seen, the underlying LLM classifier was validated on only 131 English-language data points.
This means some categories may have appeared only a handful of times – if at all – in the sample seen by humans. Take “healthcare navigation” – in the original study, it was estimated to show up in around 3% of conversations. So in the validation sample of 131, only 4 data points would have been about this issue on average. How many of these 4 were correct? It’s not clear.
Understanding when and why the classifications failed is important, because the paper notes that some of the rarer categories were later removed because the results looked wrong:
‘Digital Tools and Fitness Apps’ was excluded from the platform and temporal analyses, as manual review revealed that many conversations in this category were misclassified as health-related when users were seeking technical support for wearable devices
(Note that my intention isn’t to single out this specific paper, as lots of studies do similar things, but it’s a useful recent example from a high-profile journal, which helps illustrate many of these issues.)
As well as LLM judgements, there’s also the question of what counts as data in the first place. The data points analysed in the paper weren’t the original human conversations; they were LLM-generated short English-language summaries. There’s a benefit here (privacy preservation before human analysts work with the data), but also a risk: each step introduces LLM-induced bias and error that is hidden in the final numbers.
If the LLM used to summarise text is the same as the one used to classify that summary, there is a particular risk the AI will ‘mark its own homework’. The summary might flatten into a simple intent statement, as LLMs often do. This is then easy and unambiguous for the LLM – and a human – to classify, but hides the ambiguity that may have been present in the original text.
As I understand it, there are (at least) 4 steps in the Copilot analysis:
Original conversation ➡️ summary ➡️ translation ➡️ classification ➡️ comparison
The final confidence intervals and p-values you see in the paper only capture uncertainty in that final step. The vast majority of the uncertainty is likely to be upstream, unmeasured.
Like the Anthropic survey of attitudes to AI I wrote about earlier this year, the new study is a remarkable dataset on human interaction with AI, with half a million conversations. But like the Anthropic survey, and many others like it, it includes several data processing steps that don’t have well-characterised uncertainty.
Because of the large sample sizes involved, many of the results in such studies will appear as ‘significant’. But this doesn’t mean we should take these results at face value.
As statistician Xiao-Li Meng once put it:
without taking data quality into account, population inferences with Big Data are subject to a Big Data Paradox: the more the data, the surer we fool ourselves
LLMs are a promising tool for scaling data interpretation, but like many measurement tools before them, they are often also noisy, biased, and non-reproducible on their own. This means it’s crucial to characterise when and why they fail.
Fortunately, there’s a wealth of methodology out there in fields like statistics, which has spent over a century thinking about how to quantify error and uncertainty from available observations. If AI research wants to catch up, more papers need to make sure they’re measuring what they think they’re measuring.
No posts
Comments
Nothing yet. Say the first thing.
Sign in to join the conversation.