
This is the first of a monthly series where I summarise interesting studies from the previous month and, sometimes, older studies from “the archive”.
I start with a detailed review of the artificial sweetener study that has been making headlines this month. Followed by two shorter summaries on how to use protein and carbohydrates to improve blood glucose control.
Artificial sweeteners help with weight loss maintenance and do not negatively affect cardiovascular disease or type 2 diabetes risk factors
Eating al dente and cooled carbohydrates improves blood glucose control in type-2 diabetes
A high protein breakfast improves blood sugar control in teenagers (from the archive)
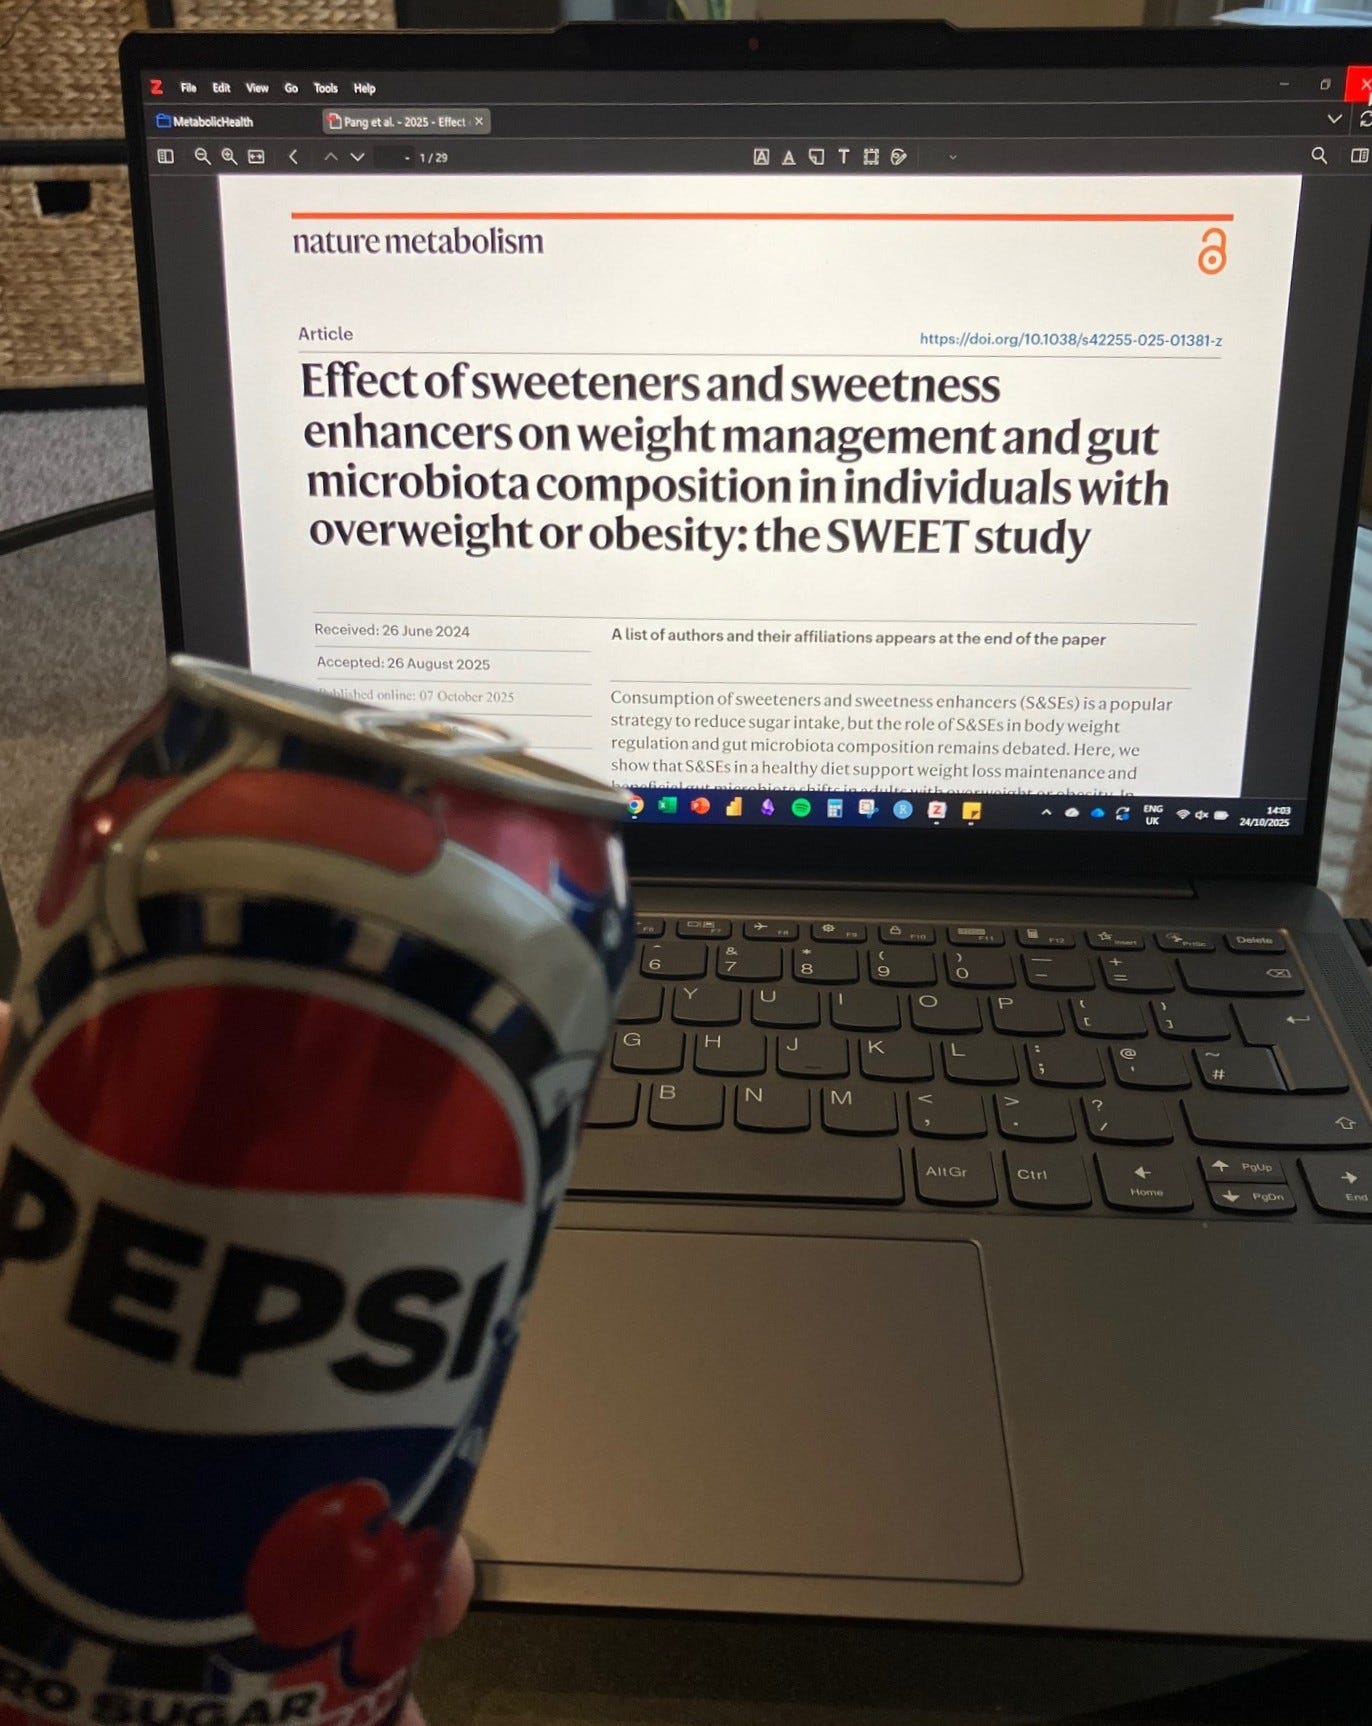
New study: Effect of sweeteners and sweetness enhancers on weight management and gut microbiota composition in individuals with overweight or obesity: the SWEET study.
This study gets at a question I am asked all the time, “Are sweeteners okay?”.
My answer is always the same, “it depends what you mean by ‘okay’?”
In this case, the researchers focused on the role of sweeteners in weight maintenance after a period of weight loss. As well as body composition, they measured a host of biomarkers related to cardiovascular disease (blood lipids, cholesterol, and blood pressure), type-2 diabetes (blood glucose, insulin, HbA1c), and gut microbiome composition.
Let’s unpack what they did…
Side note: The researchers used the term sweetener and sweetness enhancers (S&SEs), others use the terms artificial or non-nutritive sweeteners. For simplicity, I will just use the term “sweeteners”.
Researchers collaborated on a large, multinational study that spanned four European countries: Greece, Denmark, Spain, and the Netherlands. (Huge credit to the research team for coordinating this effort!). 341 adults and 38 children were initially enrolled, of which 225 adults and 22 children completed the full 12-month trial.
People taking part were overweight/obese with mildly elevated cholesterol levels, but otherwise normal blood pressure, HbA1c (~5.3%), and fasting glucose (~5.5 mmol/L). This makes them fairly representative of a normal population.
The study had two distinct phases: weight loss and weight maintenance.
Phase 1: Each person received a low-energy diet (the Cambridge Weight Plan) for 2-months, designed to induce substantial weight loss.
Phase 2: They followed a reduced sugar diet (less than 10% of total energy intake from sugar) for the next 10-months.
During this 10-month weight maintenance period, people were split into the two experimental groups. The sweetener group were instructed to replace as many sugar-containing products as possible with sweetener alternatives, like having diet soda instead of regular soda. In contrast, the sugar group were not allowed to consume any sweetener products.
The idea here is that including sweeteners in sugar-reduced diets might help sustain weight loss by making the diet easier to follow in the long-run. Imagine… You are craving something sweet, but perhaps a low-sugar sweetener product can satisfy that craving while being lower in calories. Did this theory translate to real world outcomes?
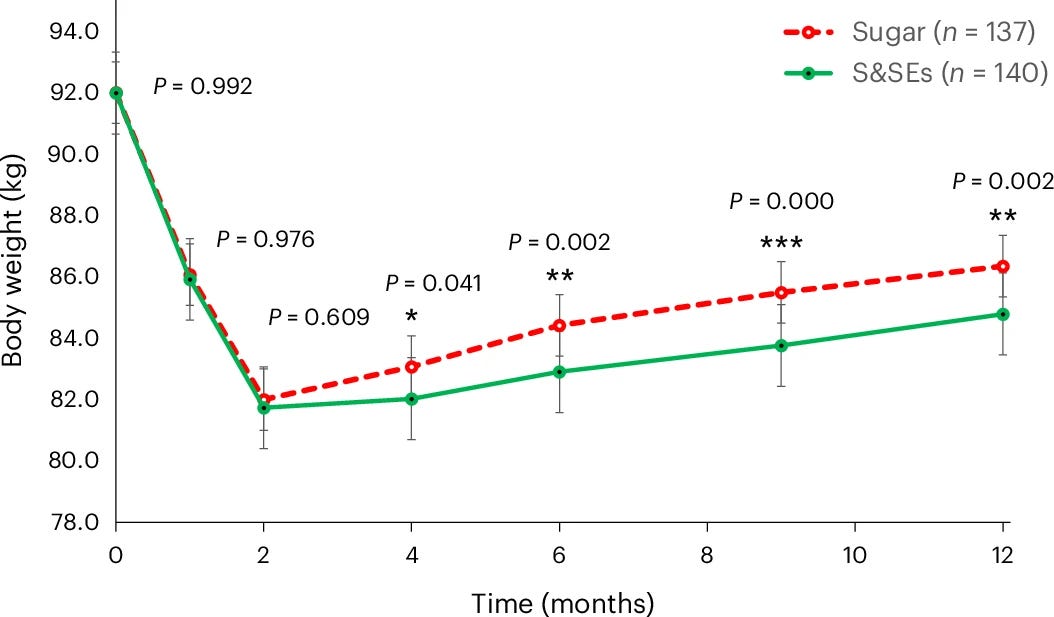
The initial low-energy diet phase led to an average of 10.1 kg weight loss across the entire study group. Over the next 10-months, the sugar group regained 44% of their bodyweight and the sweetener group regained just 29%.
This equated to ~1.6 kg more weight loss over 12-months in the sweetener group compared with the sugar group.
A closer look shows a subset of the most compliant dieters (measured by dietary records of sugar and sweetener intake, and urine levels of sweeteners at 6- and 12-months) had ~3.8 kg more weight loss compared with the sugar group. This means the better they adhered to the diet, the better their results.
This seems positive, but what if the beneficial calorie off-set comes with metabolic downsides? Here we can look at the cardiovascular disease and type-2 diabetes biomarker results.
Unsurprisingly, cholesterol, triglycerides, glucose, and insulin all improved in both groups following the large initial weight loss in the first 2-months.
After 6-months, the sweetener group had significantly lower total, LDL, and HDL cholesterol compared with the sugar group. But after 12-months, there were no statistically significant changes between the sweetener and sugar groups.
Some might say (a nod to all Oasis fans reading this) that the sweetener group had lower total cholesterol (-0.05 vs -0.21 mmol/L), but this change was close to the threshold for statistical significance. Opinions among scientists differ on how to interpret marginal effects like this.
These results challenge the common claim that sweeteners harm glucose control and increase cravings, leading to overeating.
Another concern with sweeteners is potential negative effects on the gut microbiome—the nebulous cause of everything good or bad in human health over the last few years.
The sweetener group had distinct shifts in gut microbiota composition towards bacteria associated with short-chain fatty acid (SCFA) and CH4 (methane) production. These changes are generally positive, though methane-producing species can slow gut transit speeds and increase gas retention in some people.
Self-reported side effects followed this pattern. Our sweetener group reported more “possibly related” gastrointestinal issues including abdominal pain or cramps (6.1 vs 2.3%; sweetener group vs sugar group), loose stools (5.7 vs 2.3%), and excess gas (12.5 vs 6.5%). Some caution warranted if you are susceptible to GI issues, although consider trialling different sweeteners and monitoring the dose to find your tolerance level.
In free-living nutrition studies, one of the biggest challenges is knowing whether people followed the prescribed diet correctly. We rely on self-report food logs, which are riddled with inaccuracies. A nice touch in this study was the measurement of sweeteners and sucrose in the urine to confirm diet adherence.
Urine levels of acesulfame-K, saccharin, sucralose, and cyclamate increased in the sweetener group and decreased in the sugar group (no change in steviol acyl glucuronide; aka stevia). In contrast, urine levels of sucrose (the chemical equivalent of table sugar) were 2 to 3 times higher in the sugar group—great success.
Next, what other foods were people eating? The diet as a whole, not just sugar and sweeteners, affects body weight, biomarkers, and the gut microbiome. Compared with their baseline diets, both groups had higher daily protein and fiber intakes, and lower total energy, fat, and added sugar intakes. These are positive diet changes regardless of which group they were in.
A side note for regular readers, ghrelin (an appetite-signalling hormone) increased substantially after the weight loss phase and remained well above baseline even after partial weight regain. You might remember this pattern from the last Metabolic Insight article on how the body fights back after large weight loss – link here.
So, are sweeteners “okay”?
*Taps mic, clears throat*…These results do not support the idea of undesirable health effects with long-term use of sweeteners compared with sugary foods and drinks.
Sweeteners may not be completely benign relative to low-sugar unsweetened alternatives, like water instead of diet soda. But I take a pragmatic view that most sweeteners are safe and better alternatives to sugar. Go for diet soda over regular soda!
Do not forget the bigger picture… Most people should be trying to reduce total sugar intake regardless of their sweetener intake.
Full study available here.
Send this to a friend who loves diet soda
New study: Optimizing glycemic variability in type 2 diabetes using simple dietary and culinary recommendations to modulate starch digestibility: a randomized controlled trial.
Slowly digesting starches, or SDS, are one of three fractions of starches found in the carbohydrates we eat. The other two are rapidly digesting starch and resistant starch. As their name suggests, SDS release glucose more gradually and lead to lower post-meal blood glucose fluctuations.
Here’s the thing. The make-up of these starches in each food is not fixed, they can be increased or decreased with certain cooking, cooling, and storage methods.
To test whether dietary SDS can benefit people with type-2 diabetes, researchers randomized 51 people to eat a high-SDS or low-SDS diet for 12-weeks.
They were provided carbohydrate foods like pasta, rice, bread, and potatoes to each group, but with different preparation and cooking instructions. For example, the high-SDS group had easy cook long-grain white rice, and the low-SDS group had basmati rice in microwavable pouches.
To maximize SDS, the high-SDS group cooked rice and pasta to a firm texture, al dente, and stored it overnight in the fridge before eating it cold or rewarmed in the microwave the next day. Although this might sound odd, it created a several-fold difference in the SDS content between foods in each diet.
Amounts per 100g of food:
Low-SDS group
Basmati rice microwavable pouch – 4g SDS
Spaghetti pasta – 7g SDS
High-SDS group
Easy cook long grain white rice – 27g SDS
Fusilli De Cecco pasta – 19g SDS
Did this translate to a practical benefit?
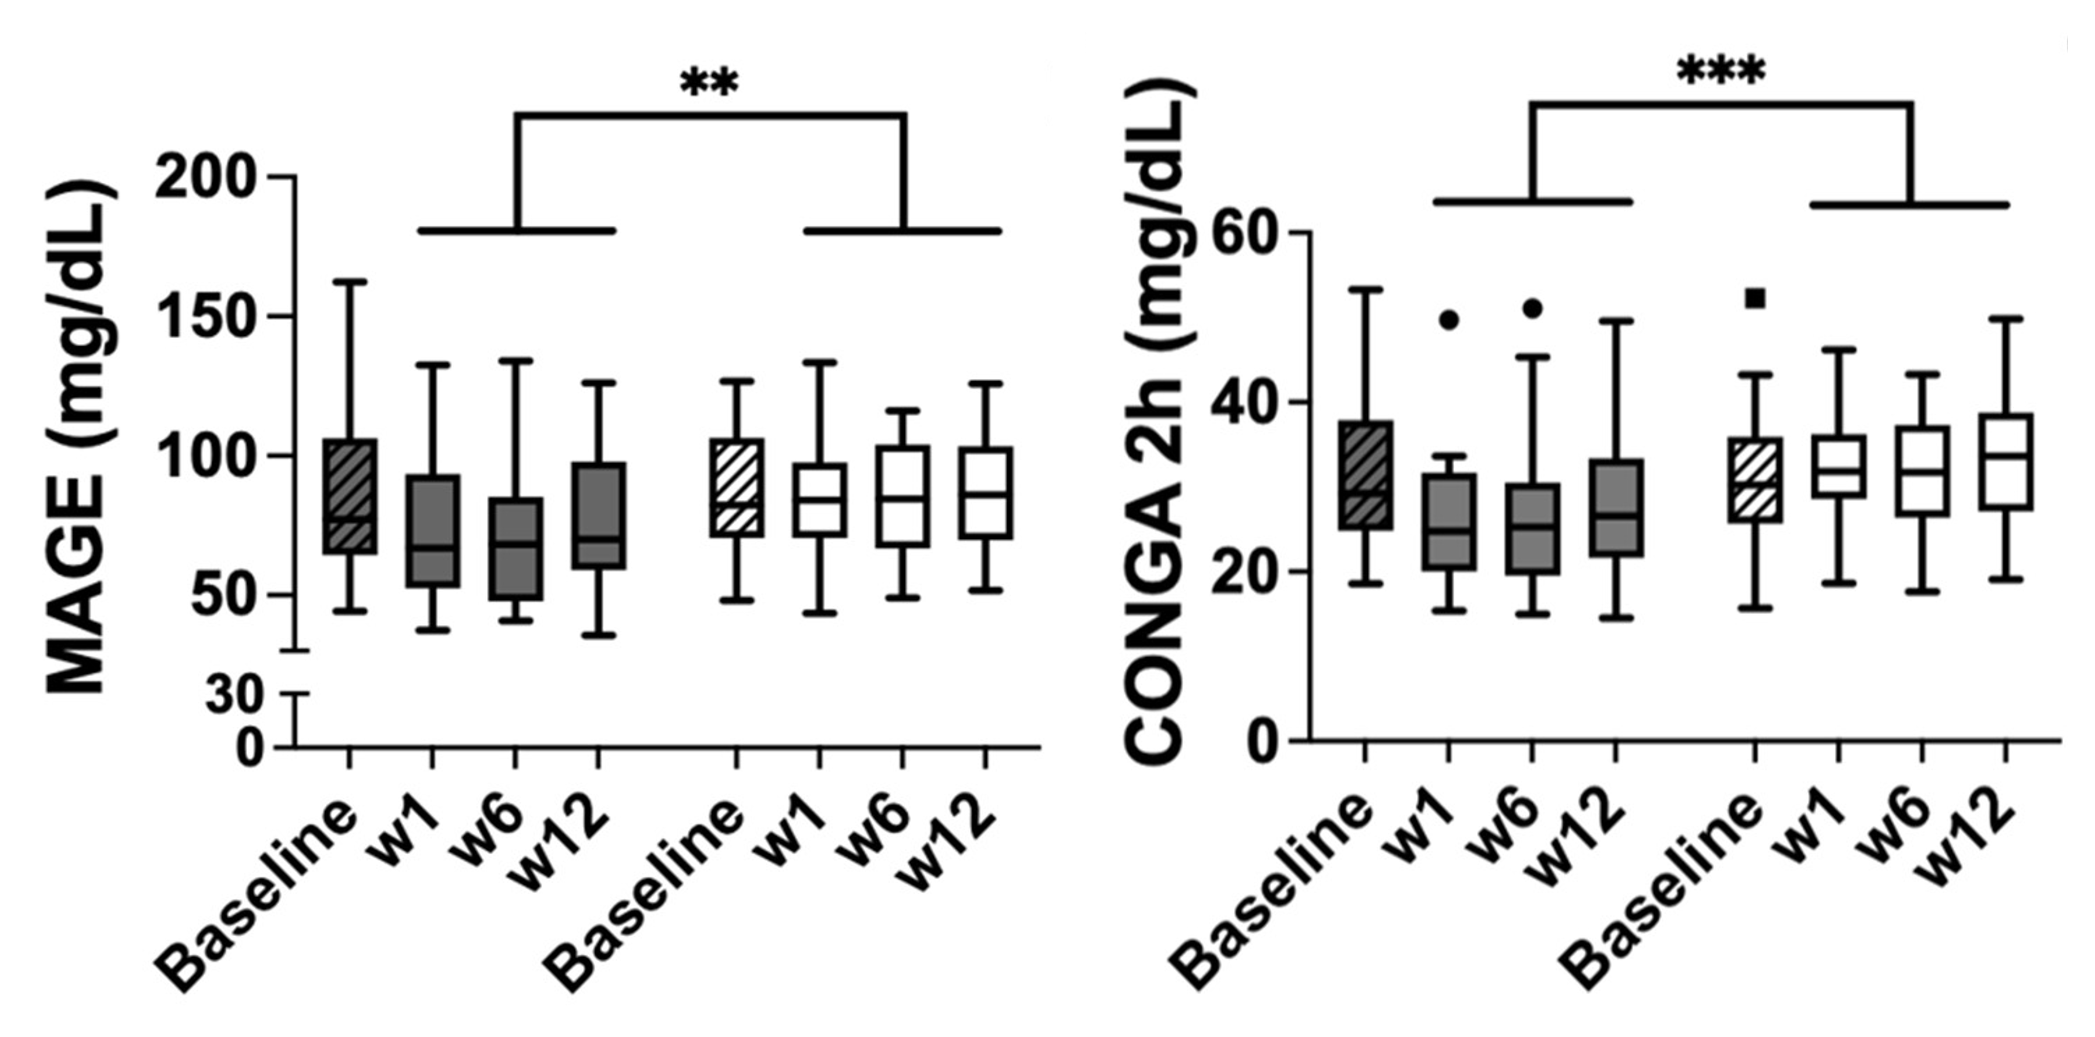
Yes! The high-SDS group had 17% lower MAGE and significantly improved CONGA compared with the low-SDS group.
Before you start thinking about drums or Gloria Estefan, CONGA and MAGE refer to continuous overall net glycemic action and mean amplitude of glycemic excursions.
This is the smoothness of your blood glucose from one measurement to the next, usually a period of 5 to 15 minutes, and the average size of large blood glucose swings throughout the day. Lower CONGA and MAGE mean that blood glucose is steadier (or less variable), which is a good thing.
I am not suggesting you change your whole diet to cooled and rewarmed carbohydrates. But what I do like about this study is that it shows the relationship between how we prepare and eat minimally processed whole foods and their effects on our metabolism.
If you are working hard to improve your metabolic health and still like to eat carbohydrates, then I recommend swapping some low SDS foods for high SDS foods and cooking them 2-3 minutes less. For little effort, it helps slow digestion and may become an easy habit to stick to.
Over time, small consistent diet tweaks compound into big health dividends.
Full study available here.
From the archives: A high protein breakfast improves glucose control in overweight/obese “breakfast skipping” adolescents (published in 2015).
I attended a conference earlier this month and was reminded of this insightful study from a decade ago. It tests whether a simple “real world” meal change at breakfast influences eating habits and blood glucose control throughout the day.
28 overweight/obese teenagers received either a normal or high-protein breakfast (13g vs 35g protein) for 12 weeks. They were habitual “breakfast skippers” so this represented a change in their eating patterns. The normal protein breakfast contained cereals and milk, and the high-protein breakfast contained egg, pork, and wheat tortillas; both providing 350 kcals.
After 12 weeks, the high-protein breakfast group had *lower* 24-hour glucose variability, *lower* maximal glucose responses, and *lower* post-meal glucose fluctuations—all positive changes that indicate better blood glucose control. The figure below shows the average daily blood glucose values for both breakfast groups.
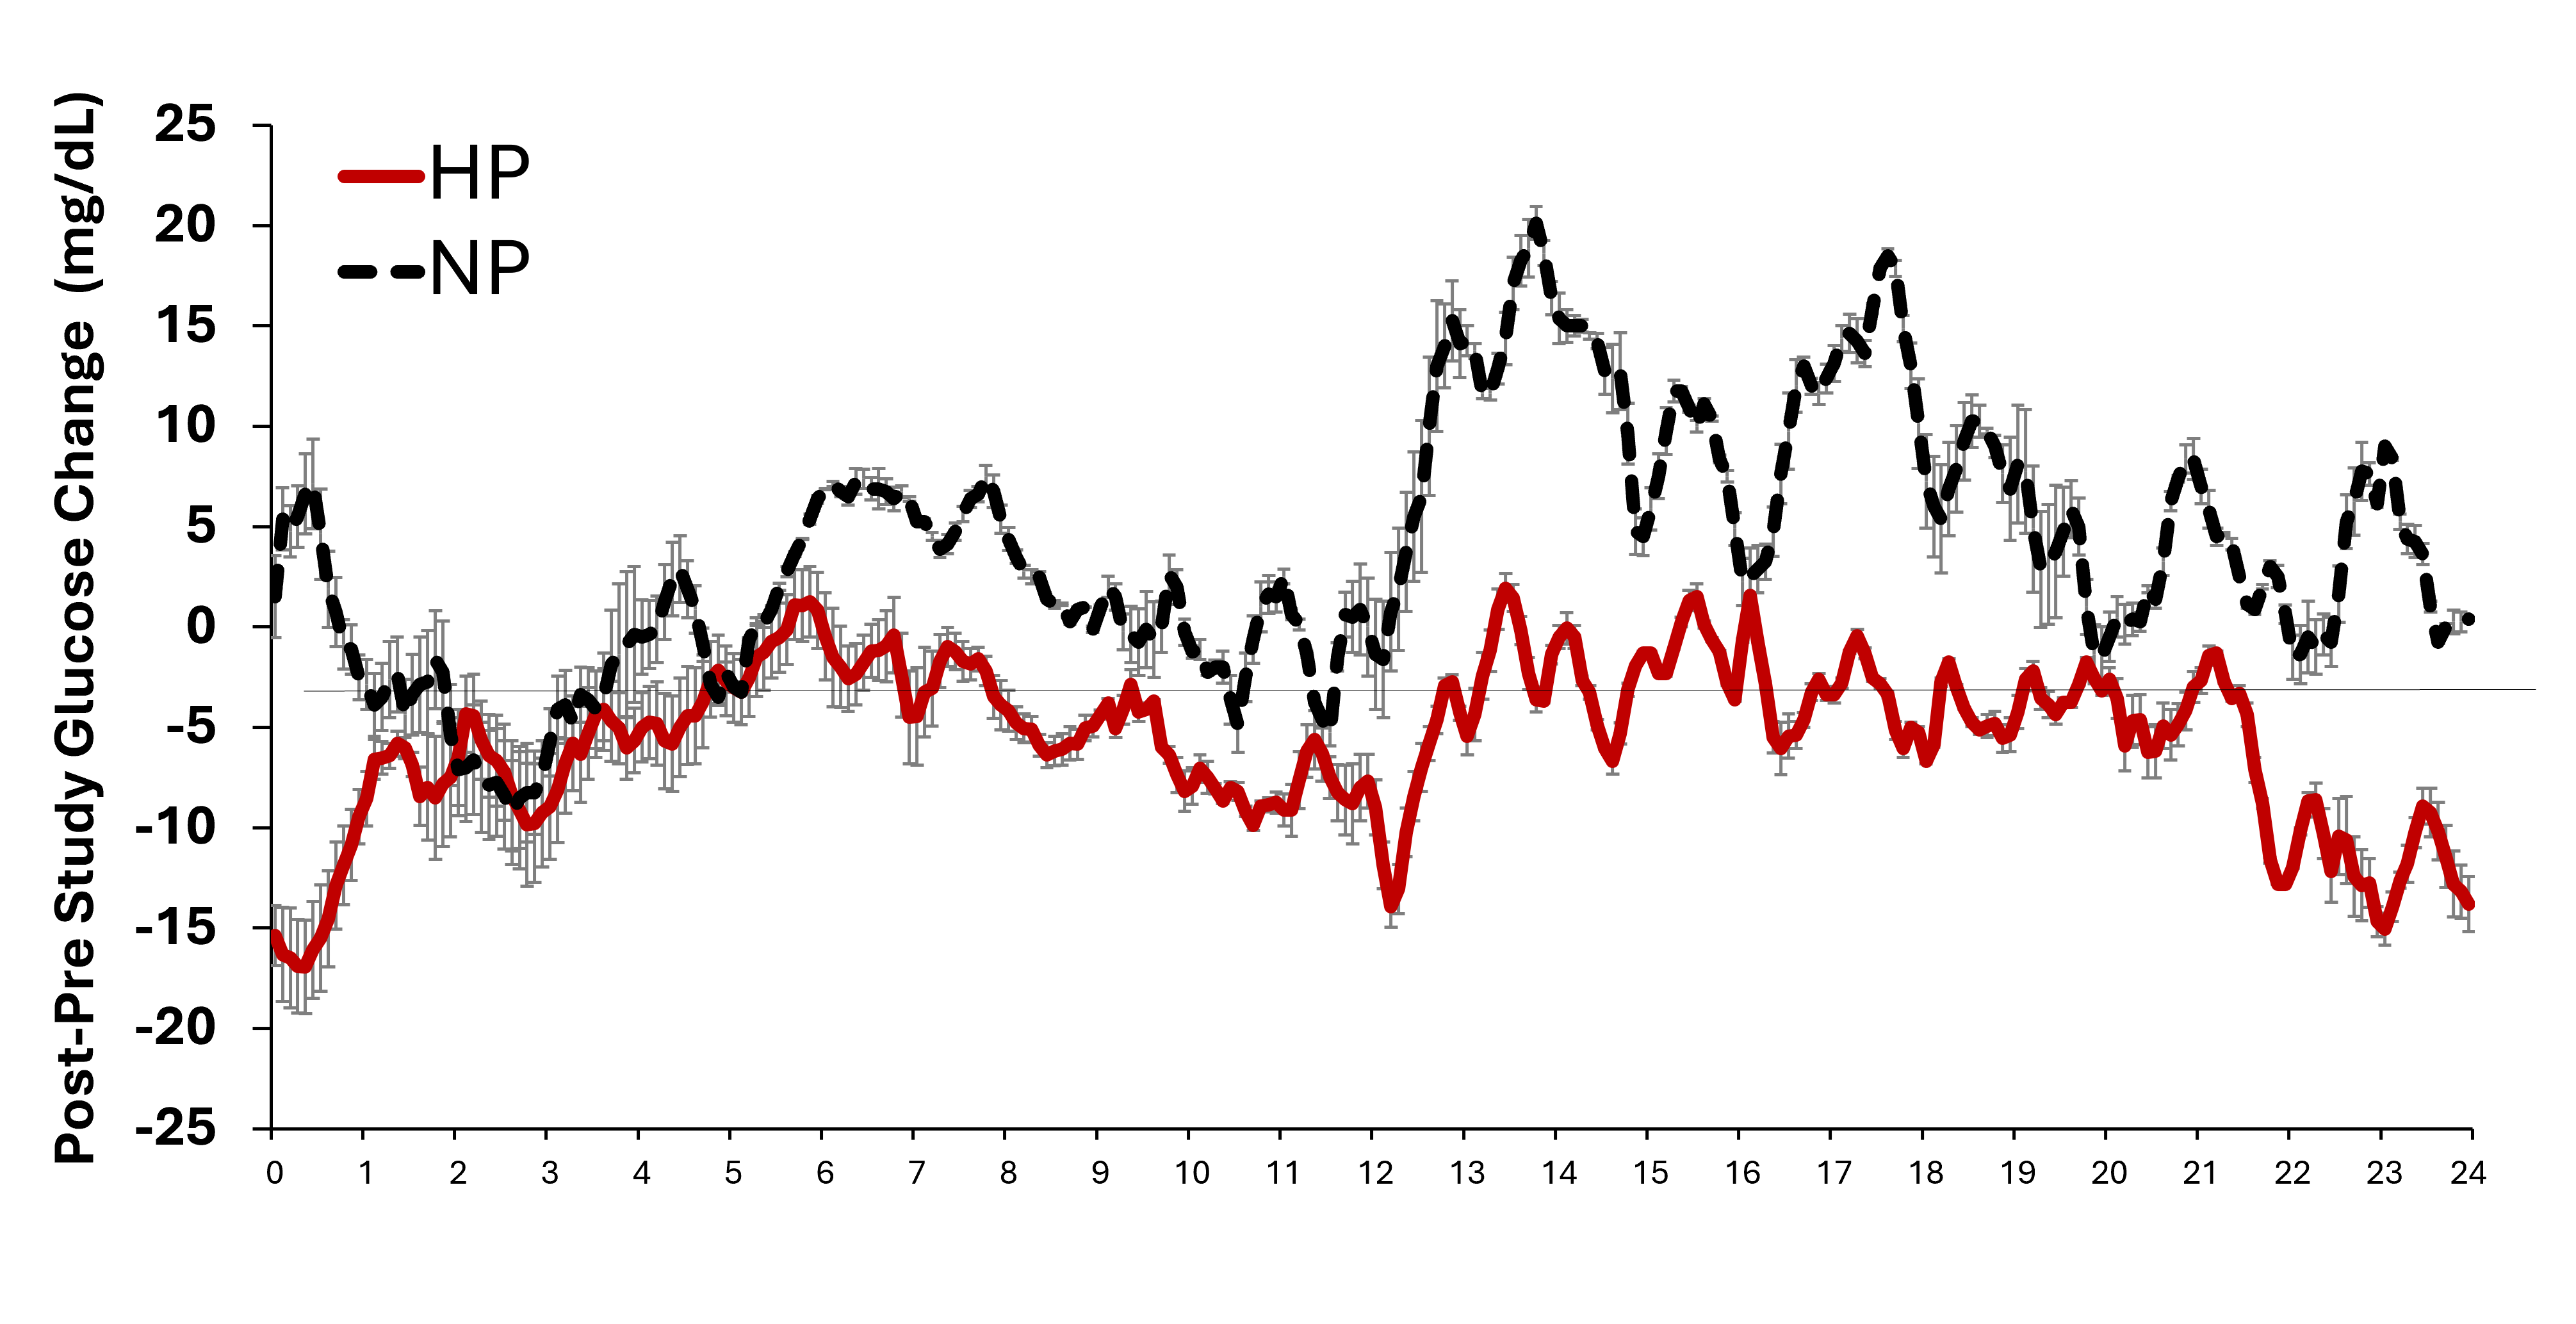
This analysis was part of a larger study that tracked energy intake and body composition changes. These showed that the high-protein breakfast led to voluntary reductions in daily energy intake of -412 kcals per day on average (measured across 2 x 3-day periods), mainly from fewer high-calorie foods in the evening.
Total bodyweight was similar between both breakfast groups. However, a breakdown of the body composition changes shows that the high protein group lost body fat (-0.5%), the normal protein group was more or less the same, and the control group who continued “breakfast skipping” gained body fat (+1.6%). This points to better change in body composition for the high protein breakfast group.
We should bear in mind that (1) this was a small pilot study, (2) there was a large difference in protein quantity and quality between the two meals, and (3) since there were no substantial changes in body weight, the energy intake results may not reflect actual eating habits over the 12-week study period.
For many people, particularly adolescents, 35g of protein at breakfast can be challenging to adhere to long-term. It would be interesting to know whether the same benefits occur with a lesser amount of high-quality protein, say 20-25 grams.
But this is a practical strategy for improving blood glucose control throughout the day in overweight/obese adolescents—other data show this applies to adults too!
Full study available here.
No posts
Comments
Nothing yet. Say the first thing.
Sign in to join the conversation.