
At this point, it may seem like I’m getting secretly paid by Anthropic, but the product is just that great. I spend ¼ of my day inside of Claude in some way or another.
The latest time sink?
And.. I say that in a good way..
Is Claude’s “Live artifacts” which allow you to create dashboards for your startup.
In this short essay, I’m going to showcase how easy it is to create bespoke marketing dashboards, what I’ve built so far, and how to use tools like Windsor.ai to hook up ad account data.
How to create marketing dashboards on Claude
This will be short and sweet: just go to “Live artifacts” within Claude Cowork and then click “New artifact.” From there, Claude will guide you through some questions that’ll ask the type of dashboard, data and style you’d like. That’s all.

You can also prompt Claude Cowork to build a dashboard for you and ask if you’d like to build a Live artifact.
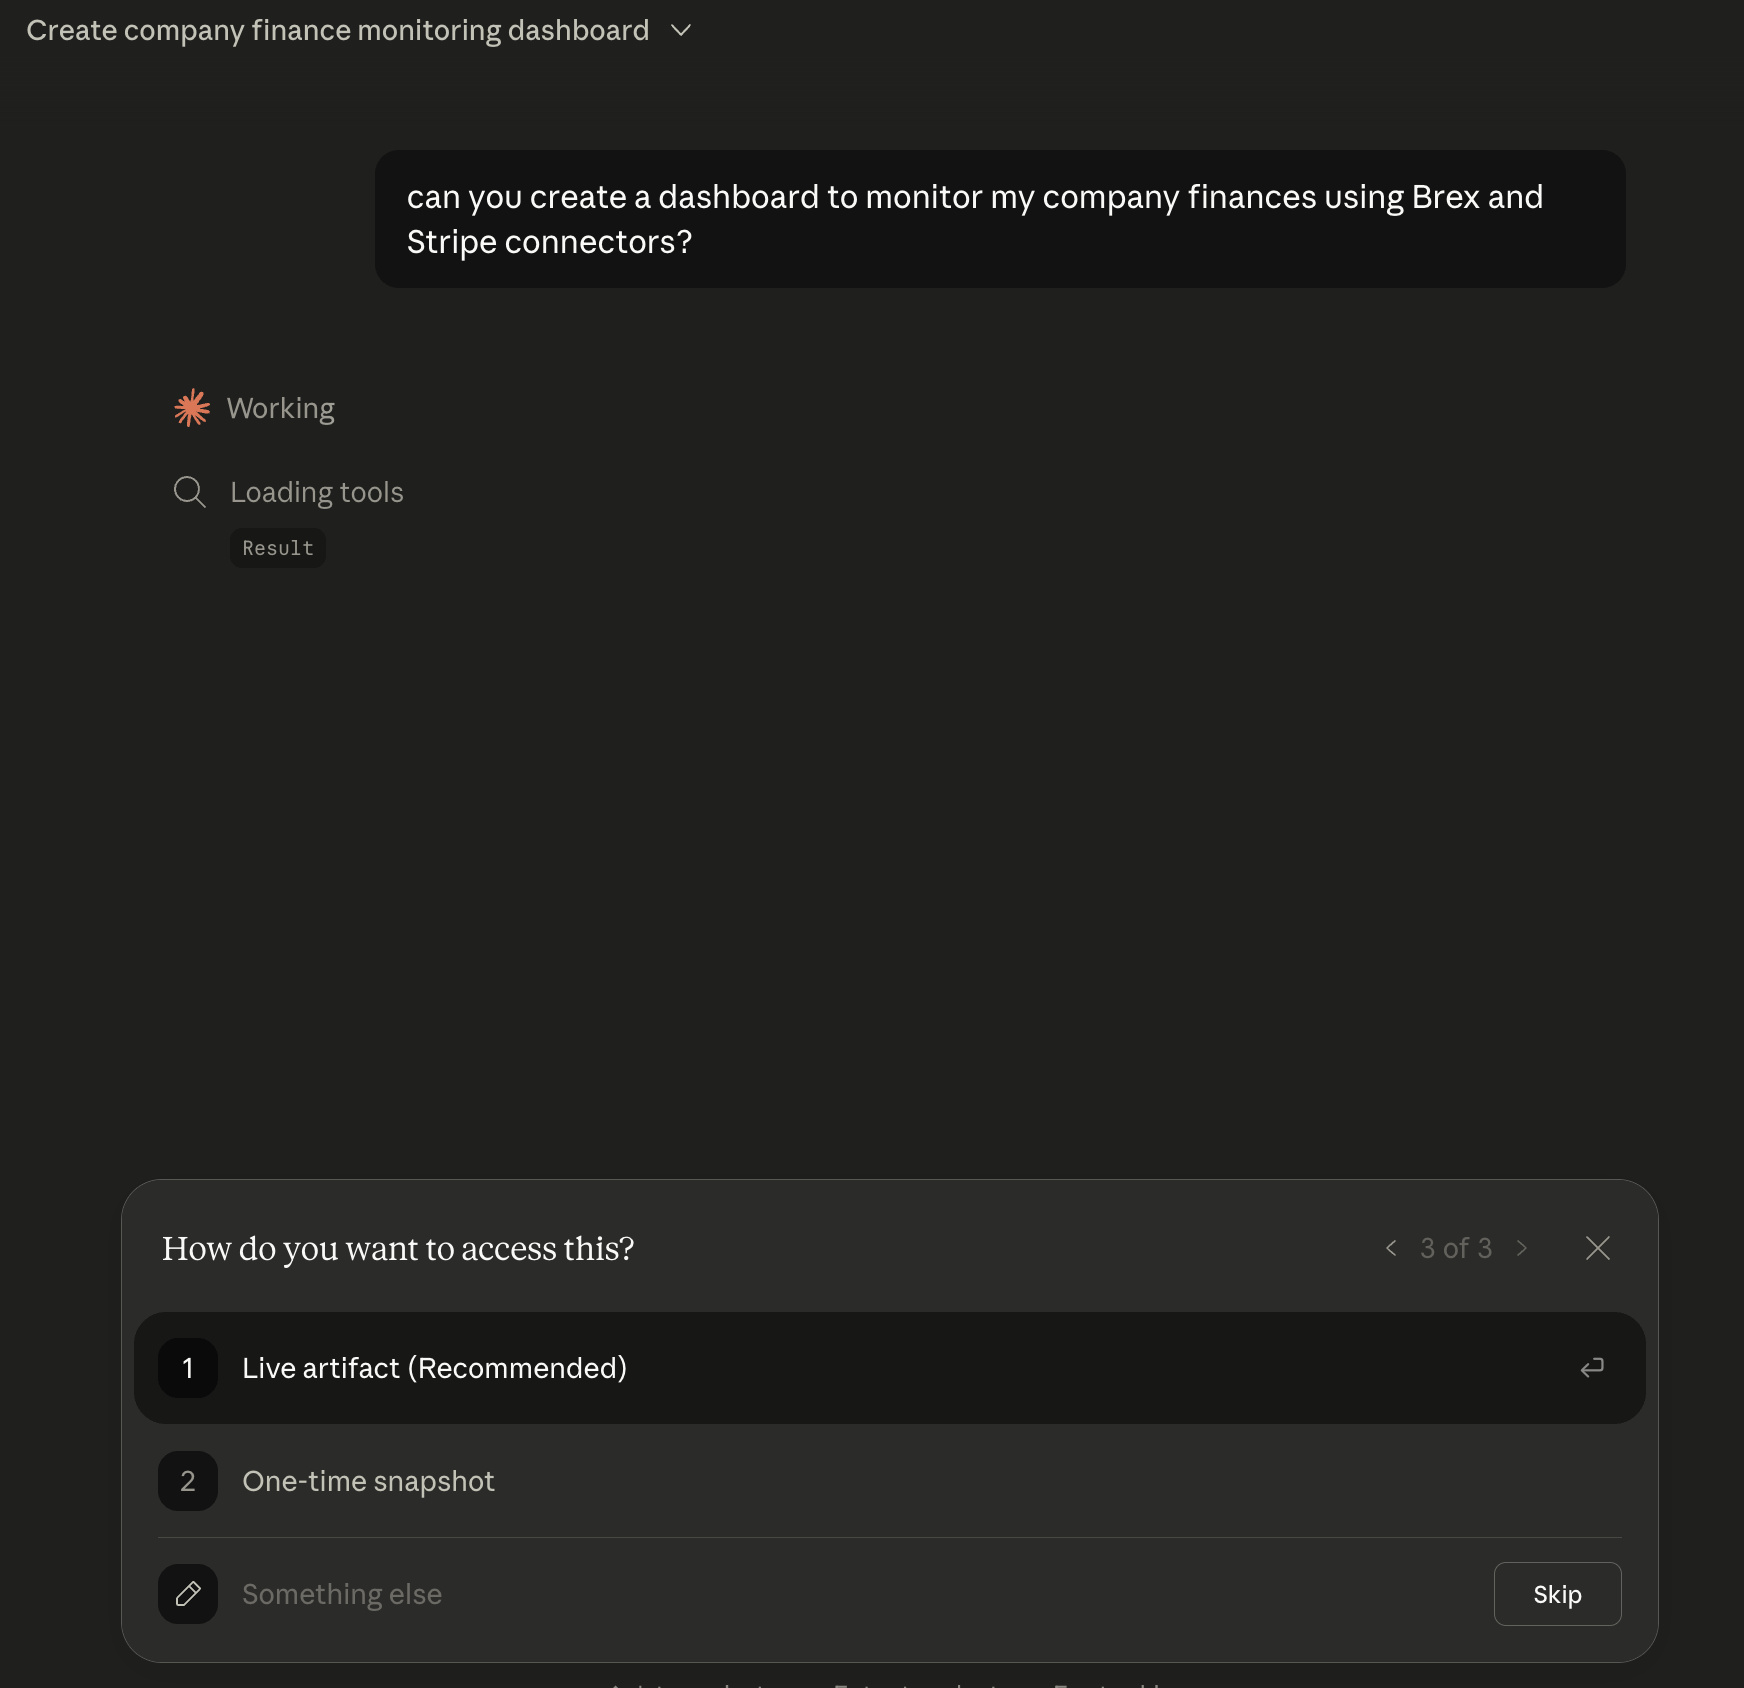
What I’ve created so far
I’ve built a dashboard to help me visualize creative performance on LinkedIn thought leader ads I’m running for GrowthPair. Since this type of ad format doesn’t really lend itself well to tracking/ attribution, I typically default to measuring CTR on the ads. As a marketer, this sort of pains me, but this ad format does so well since it looks organic. I’ve written about those ads here.
This is what Claude came up with:
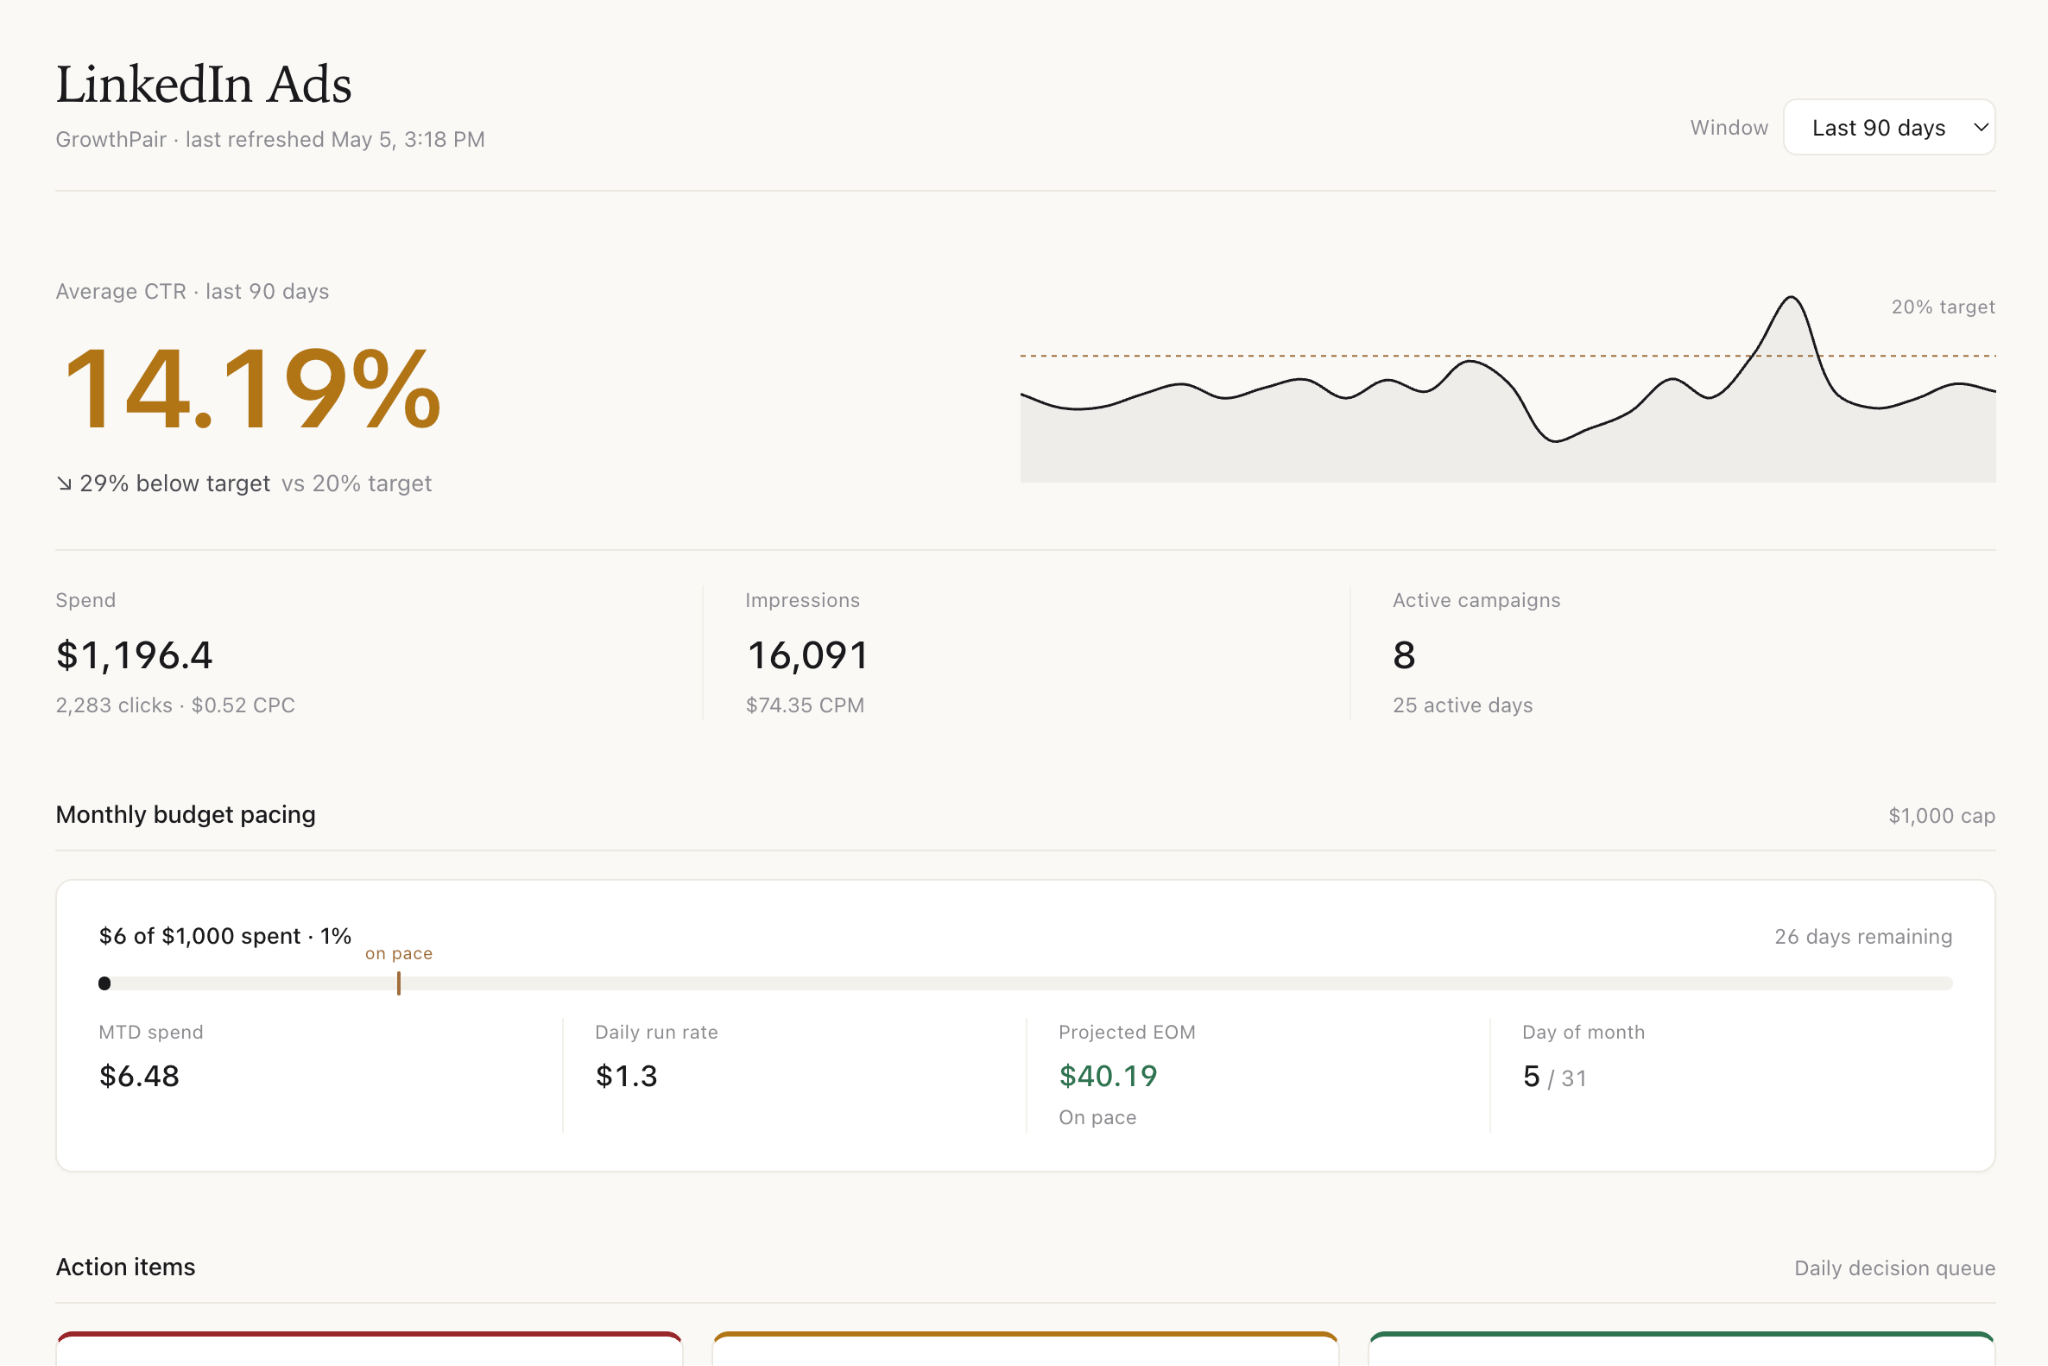
It has charts and visualization for metrics like:
CTR over the last 90 days vs my target of 20%
Budget pacing for the month
Action items to pause/ ramp up creative based on performance
CTR across all creative in campaigns
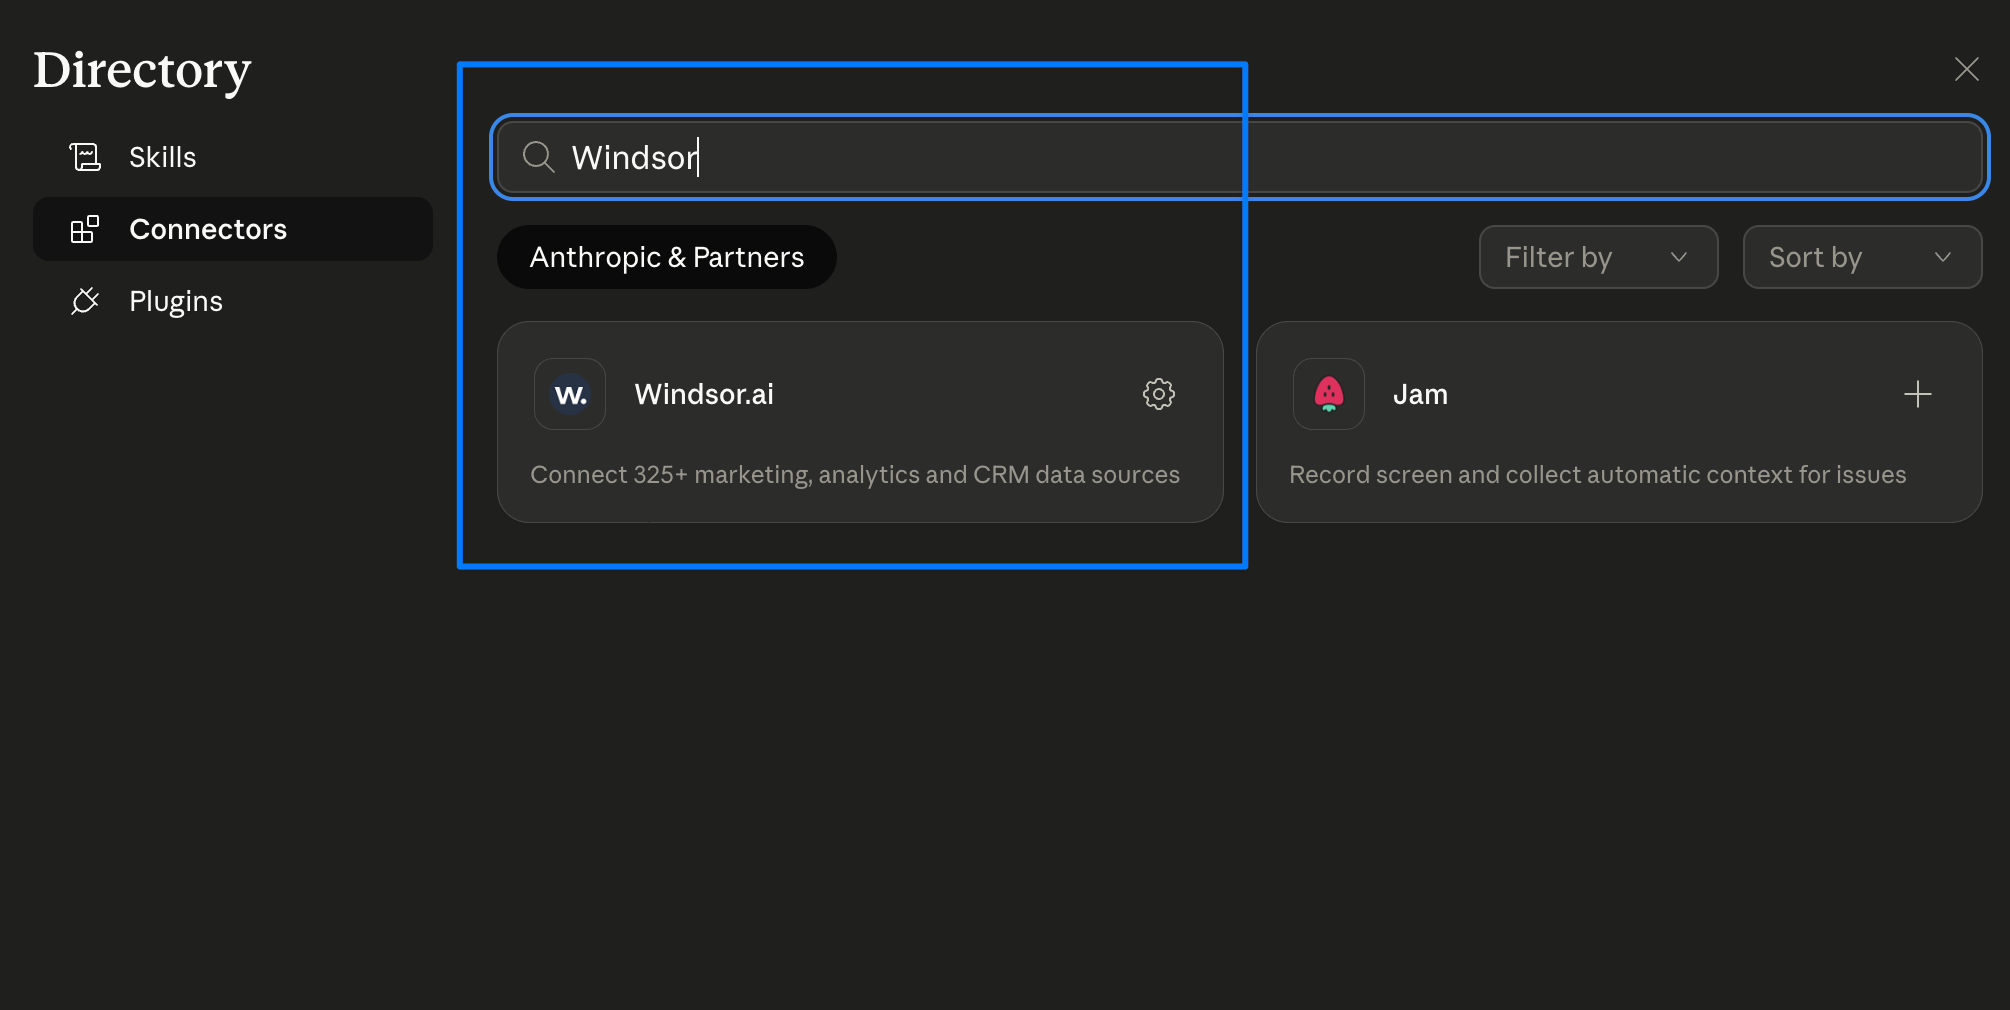
Since LinkedIn doesn’t have an official Connector on Claude, I had to use Windsor.ai to connect my ad data into Claude. You can search connectors like “Windsor” or “Supermetrics” on Claude and add those to ingest metrics from channels that don’t have official Connectors.
Then I built a dashboard that married all of my Brex (bank account) and Stripe data in one easy view. Here’s what Claude came up with:
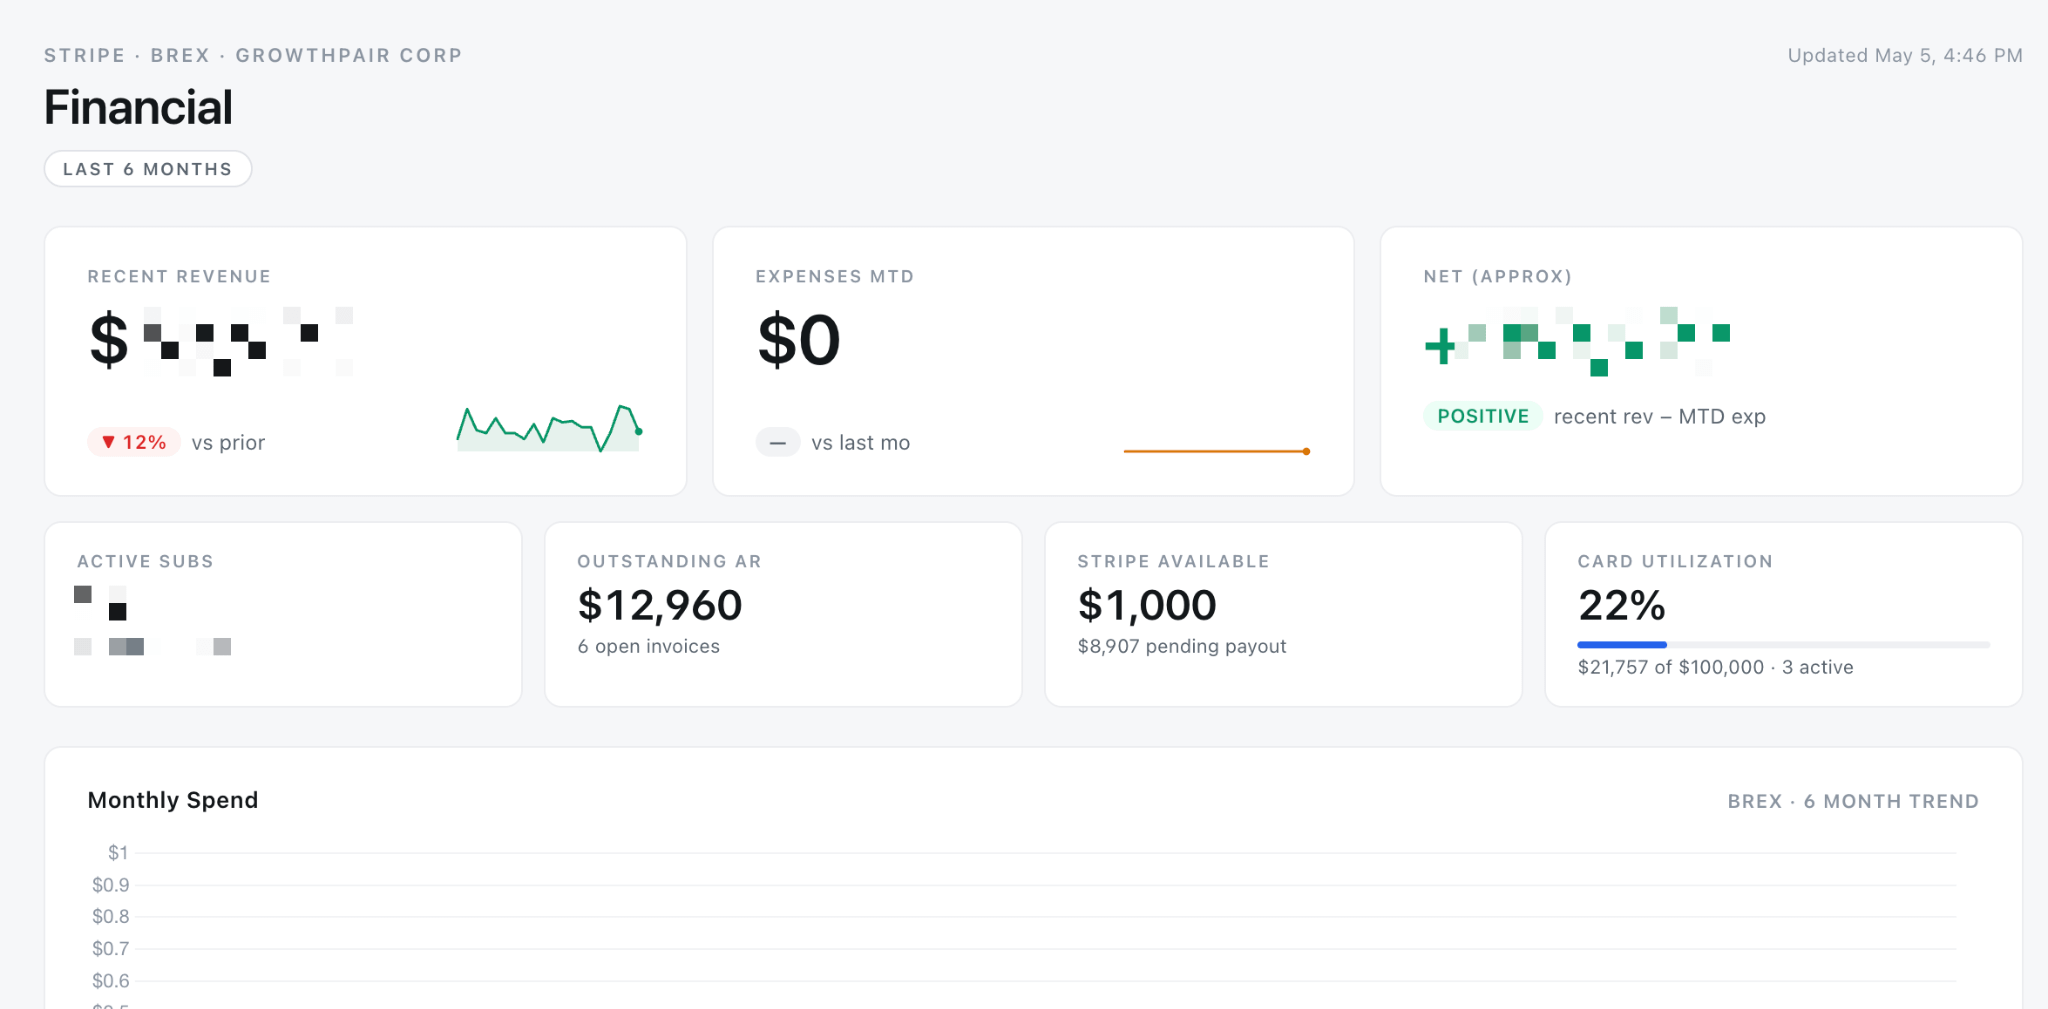
In this dashboard (note: numbers blurred), I’ve got the ability to view:
Expenses by category
Monthly spend trend lines
Expenses vs revenue trend lines
Outstanding AR
Revenue trends
Instead of viewing two websites, I’ve got it pulling all of the data into one. I think this gets real interesting for marketing teams looking to consolidate all of their ad spend data or trends into one unified dashboard.
Some other random ideas
If I was a marketing consultant today, I’d be eating this up and creating live dashboards for every single client that I managed. It would make management much easier and wow my clients all at the same time. Claude also gives you the ability to download the dash as a snapshot PDF so that you can share it with others.
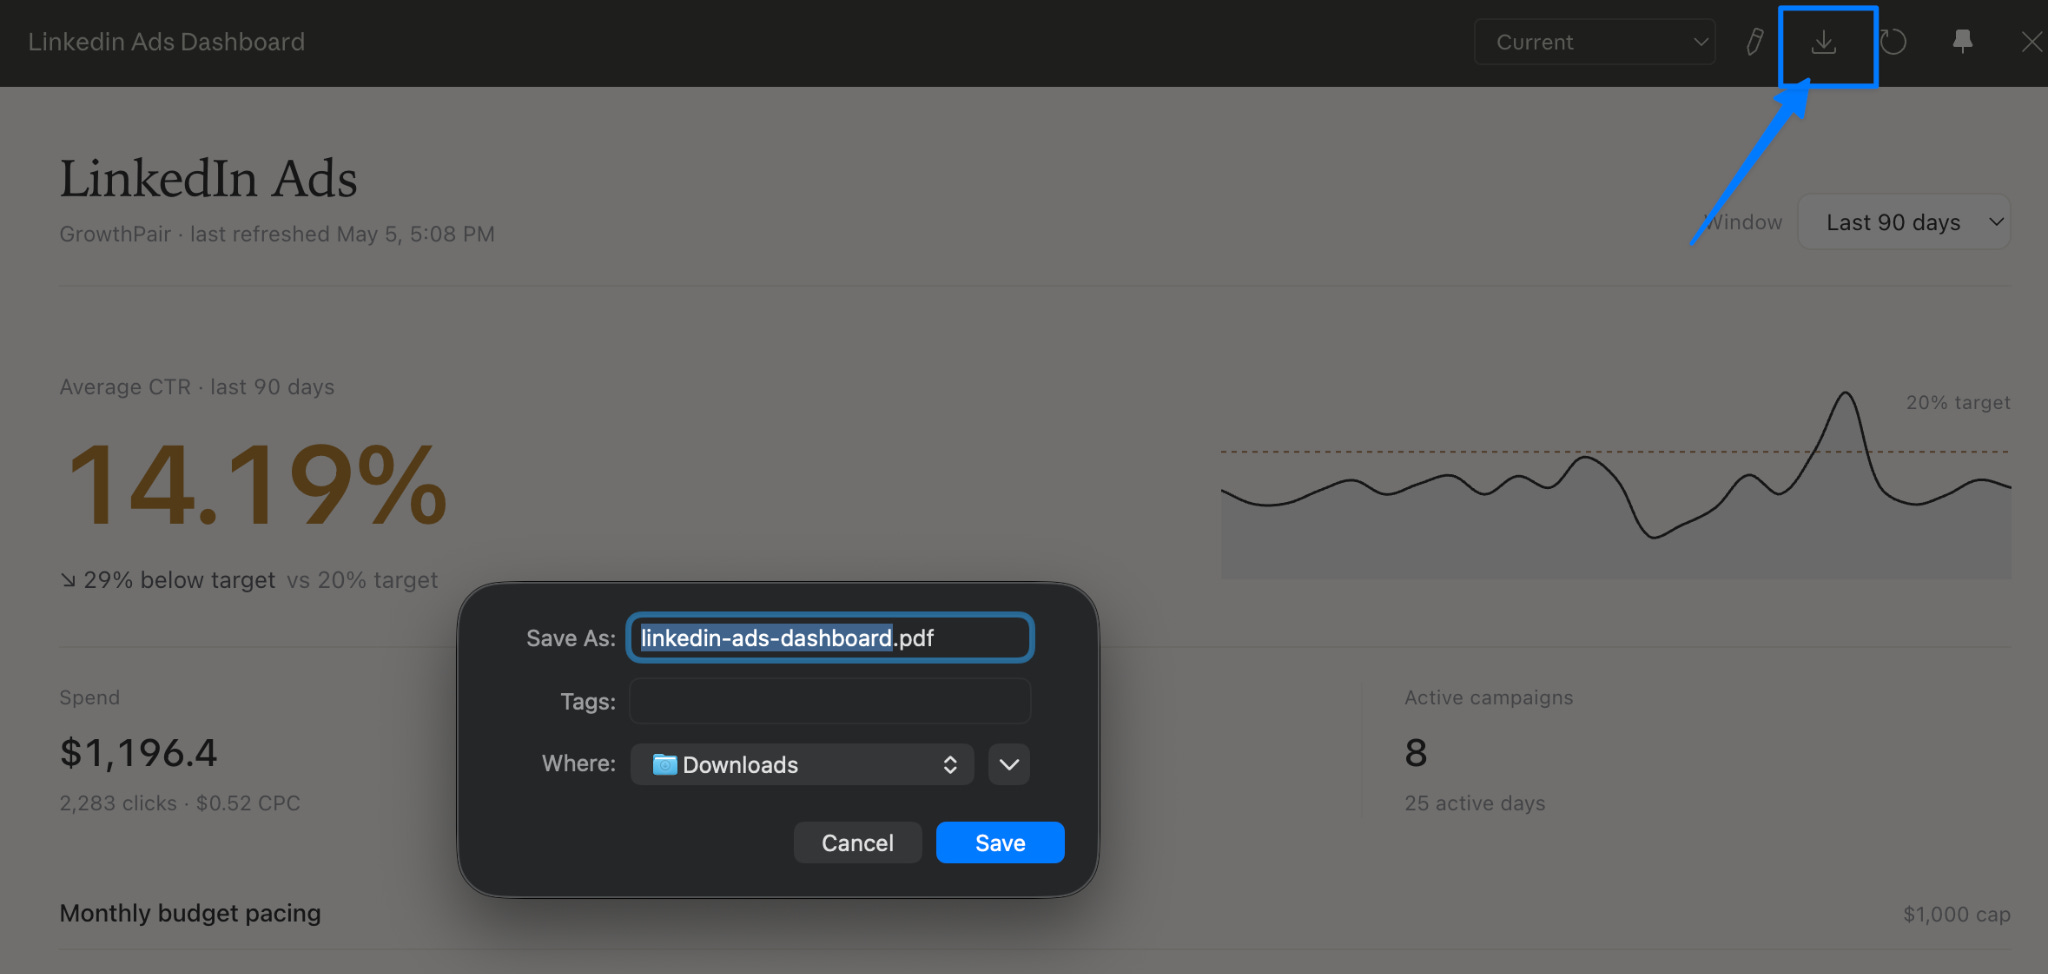
If I was on a marketing team, I’d be building these dashboards out to make my life easier with management of campaigns and KPIs. I’d create competitor tracking dashboards that monitored new ad creative or website changes in an easy-to-digest UI. Etc etc.
It used to take weeks to build these dashboards on tools like Looker or Tableau, often required knowing some level of SQL and required maintenance. That’s not to say that these Live artifacts won’t require maintenance, but it’s as easy as prompting Claude for edits and improvements.
Happy dashboarding!
P.S. If you’d like a video lesson on this, please reply letting me know. If I get enough folks interested, I’ll film this for the Claude Marketers video academy.
No posts
Comments
Nothing yet. Say the first thing.
Sign in to join the conversation.