Hamilton Public Transport city ranking 2001-2023
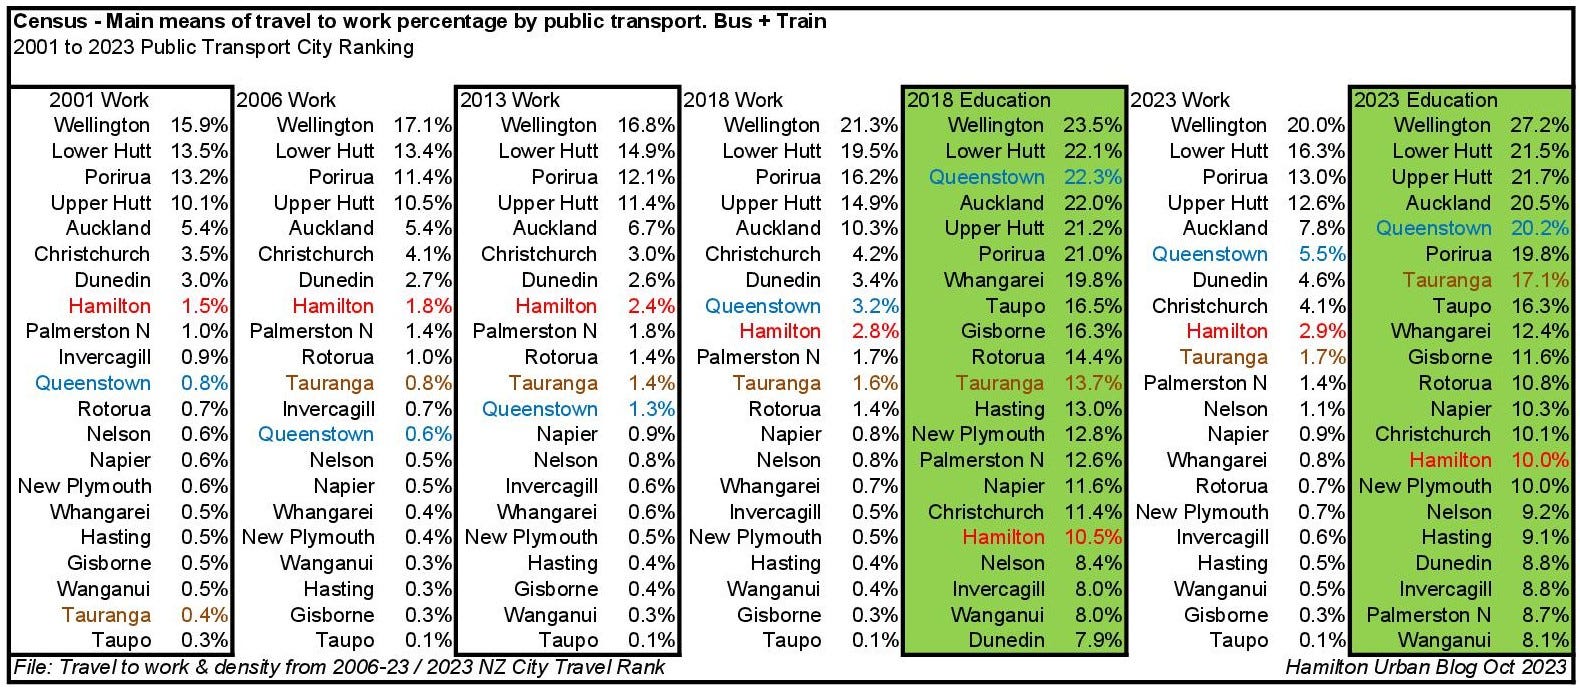
The percentage of workers choosing to travel to work by bus in Hamilton increased by nearly 100% from 1.5% to nearly 3% over the past 25 years.

Thoughts on Hamilton's urban environment and future direction
Live Last read · last published · next check
The percentage of workers choosing to travel to work by bus in Hamilton increased by nearly 100% from 1.5% to nearly 3% over the past 25 years.
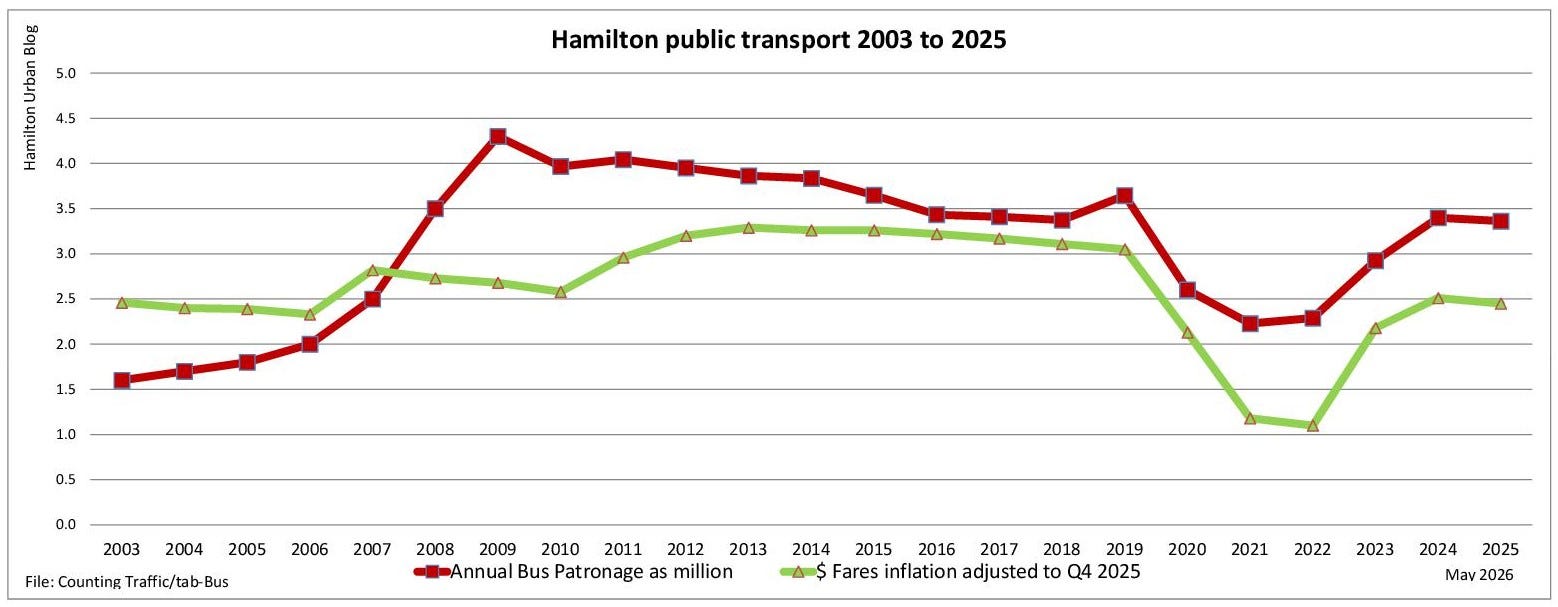
A fair bus fare is at about $2.50: when it increases to near or above $3, patronage begins to fall, putting fare revenue at risk, and no one benefits.
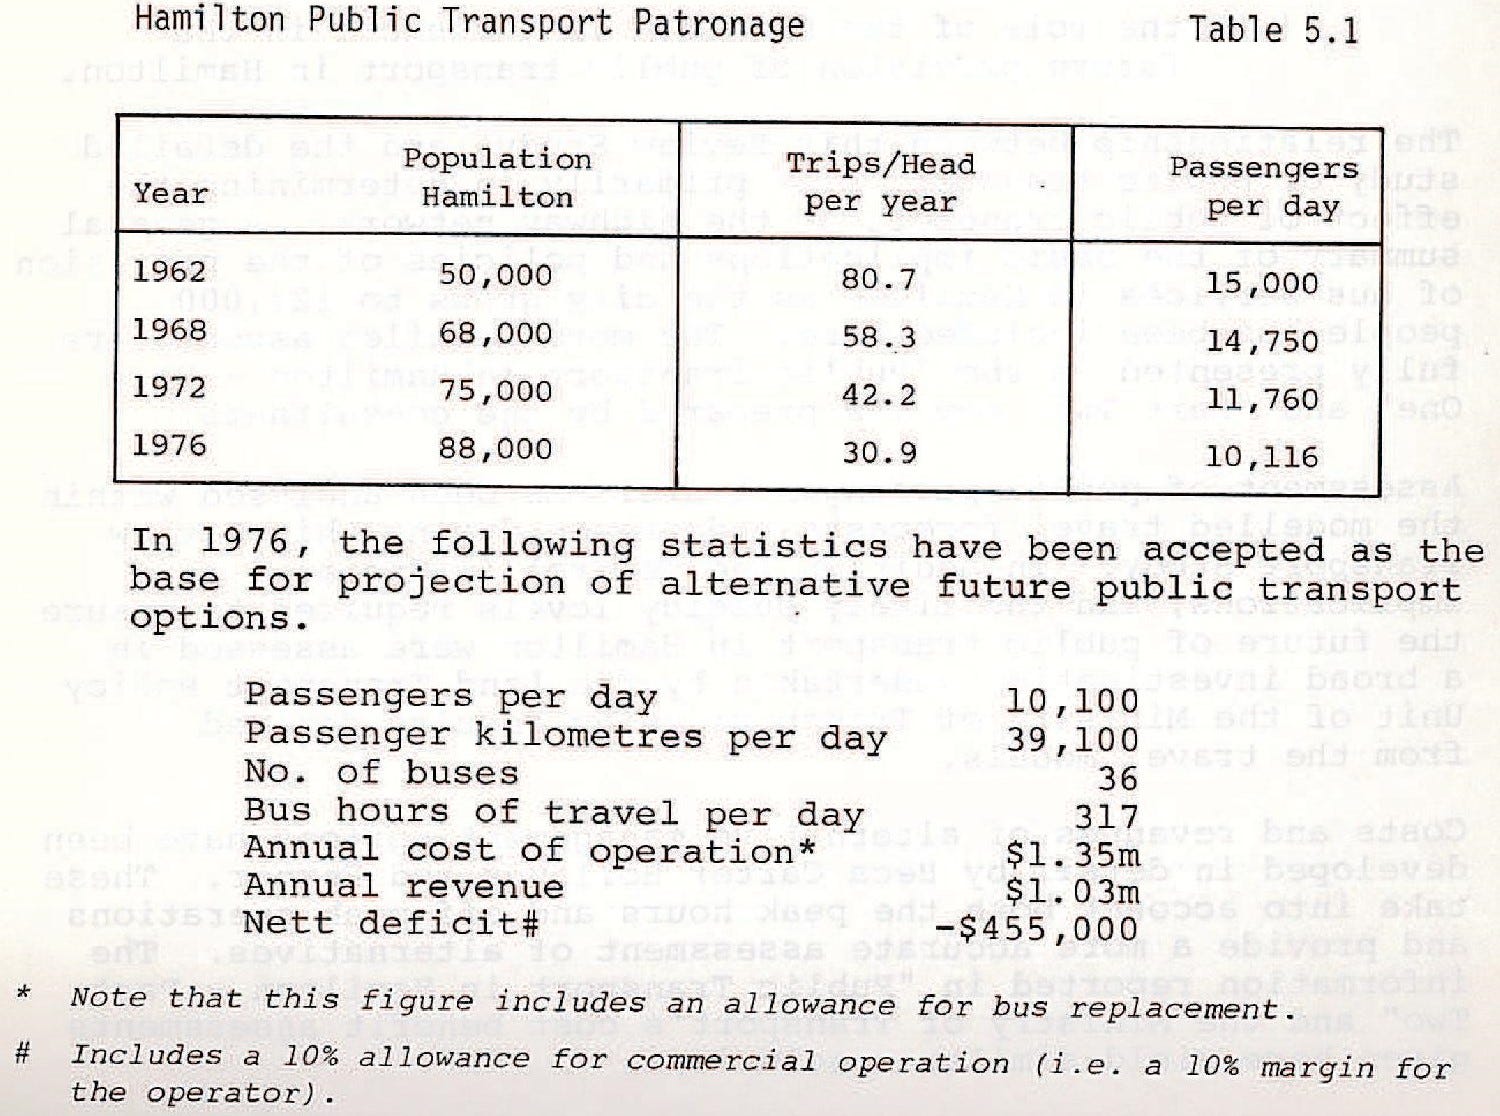
This post is a scrapbook of snippets from reports and articles.
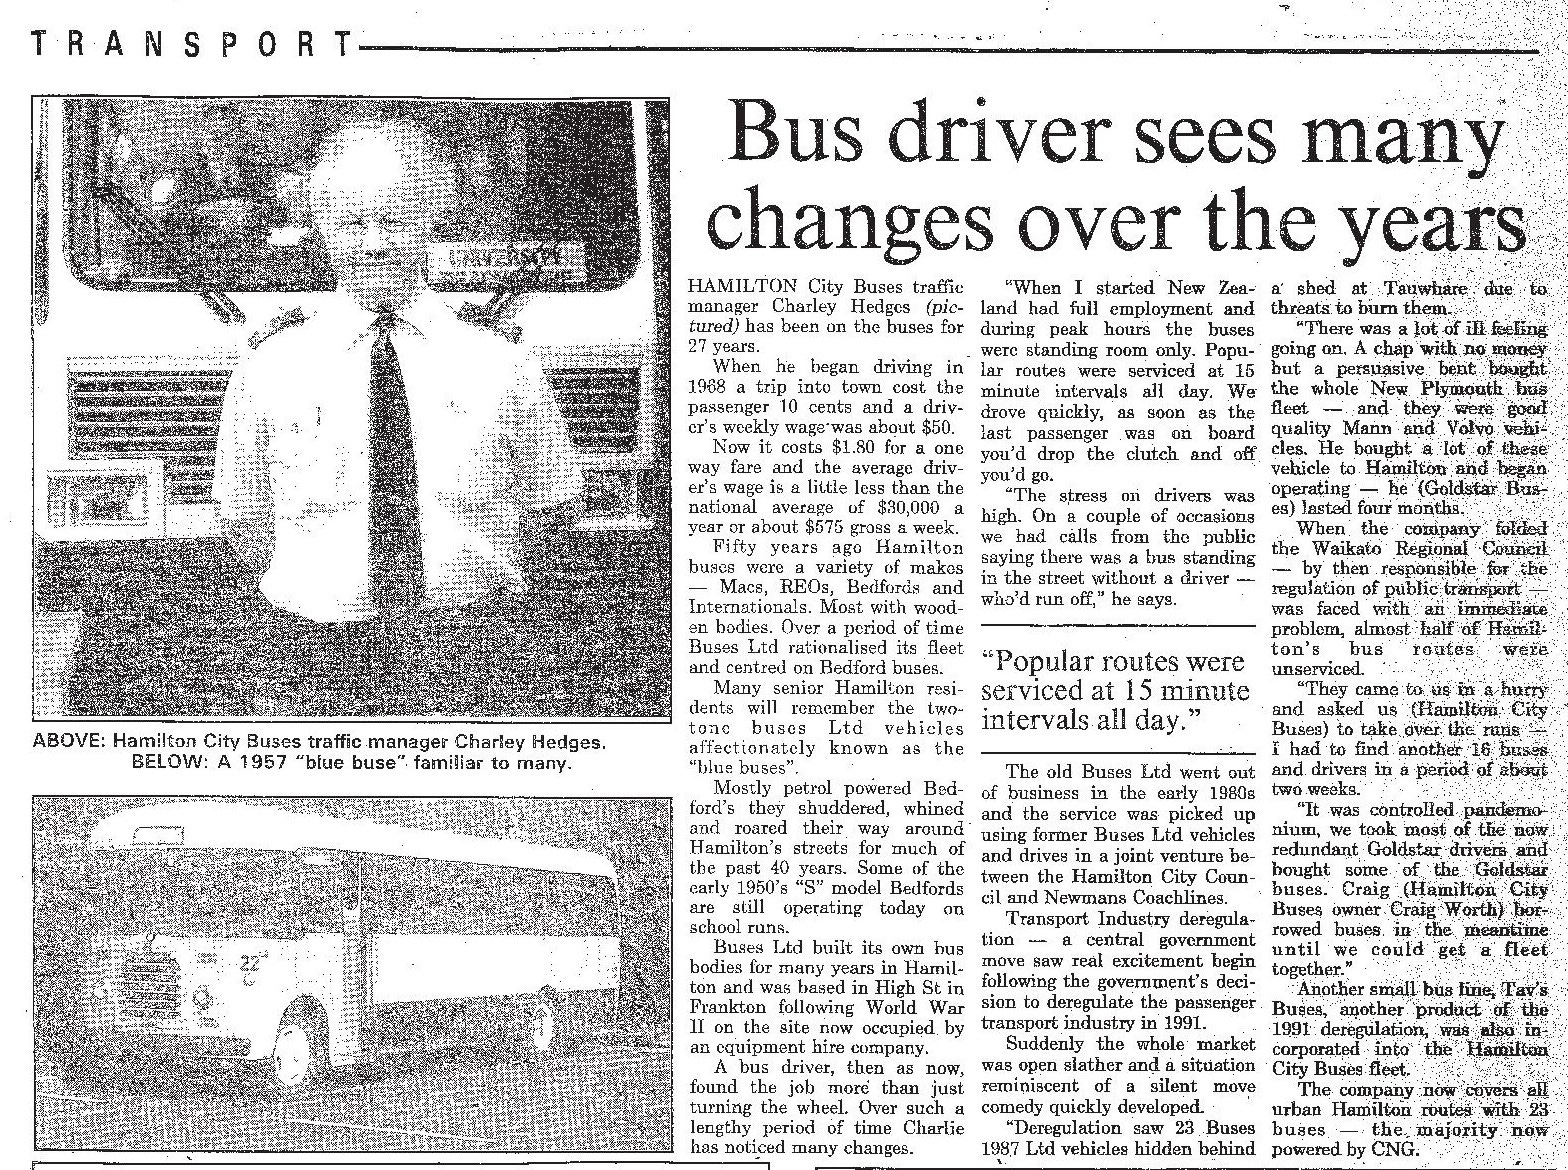
‘Deregulation in 1991 ...
The benefits of transferring Central Business Area (CBA) commuters from car to bus has been assessed at about $200,000 [$3,294,193 adjusted] a year for the next 20 years [from 1973] (p.239) ...
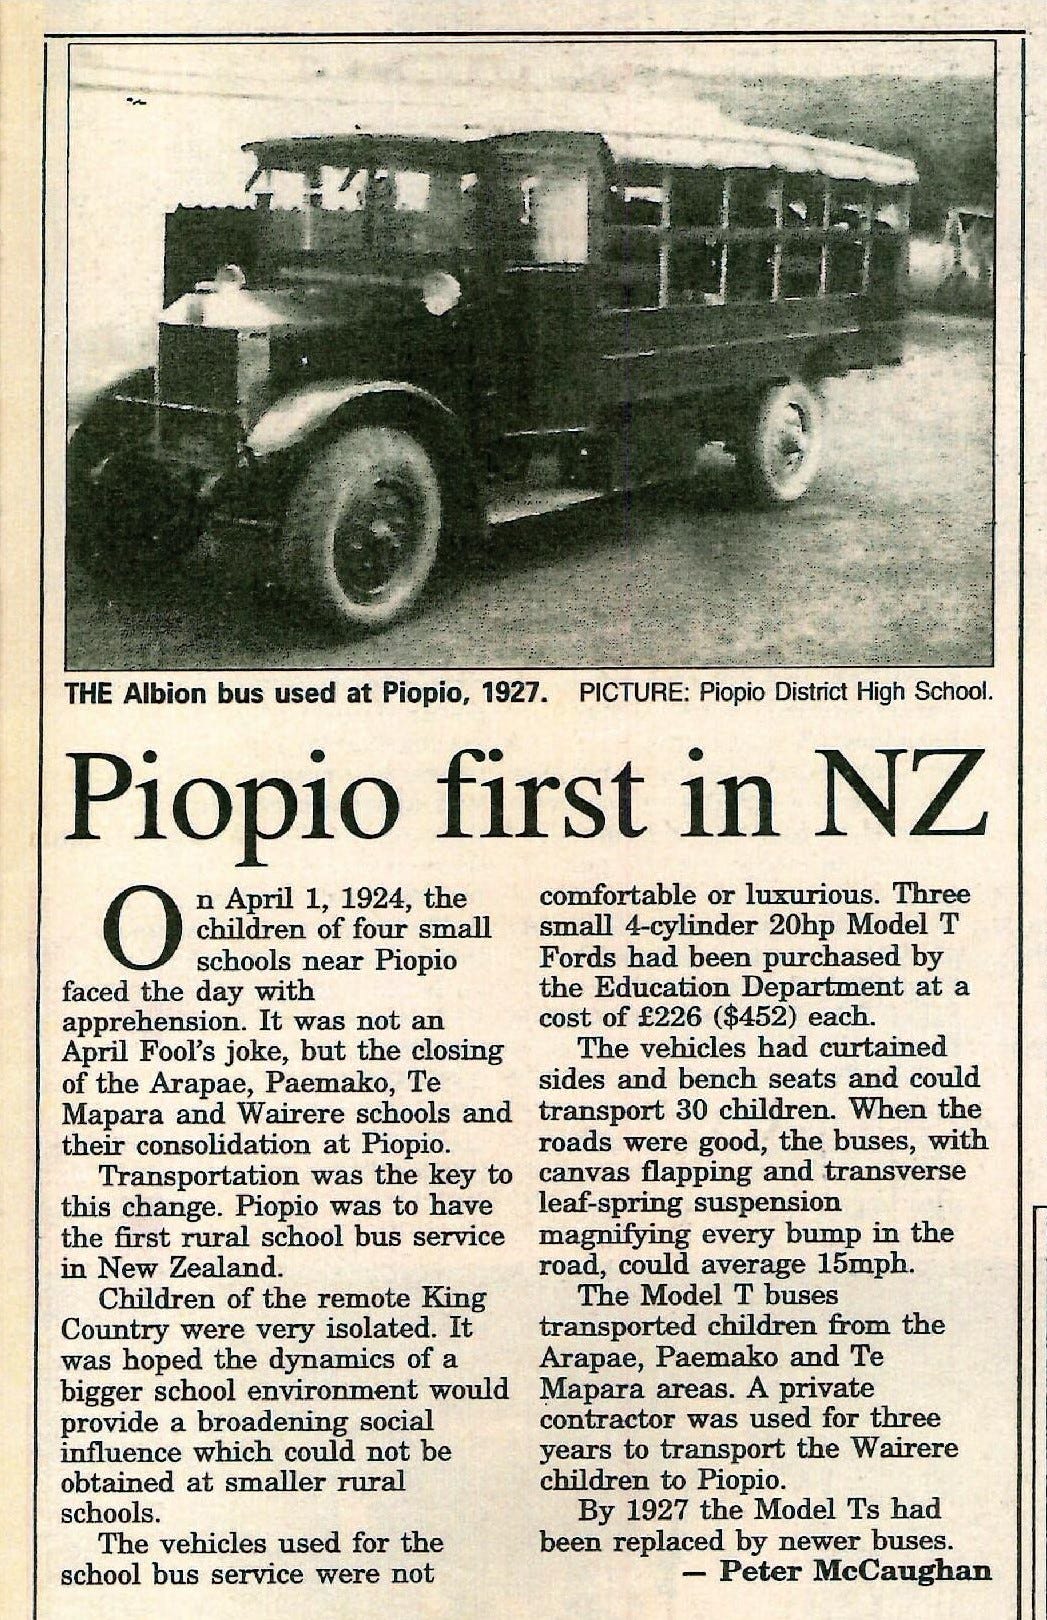
Our Story - A history of the Waikato - by Waikato Times 1999, page 33
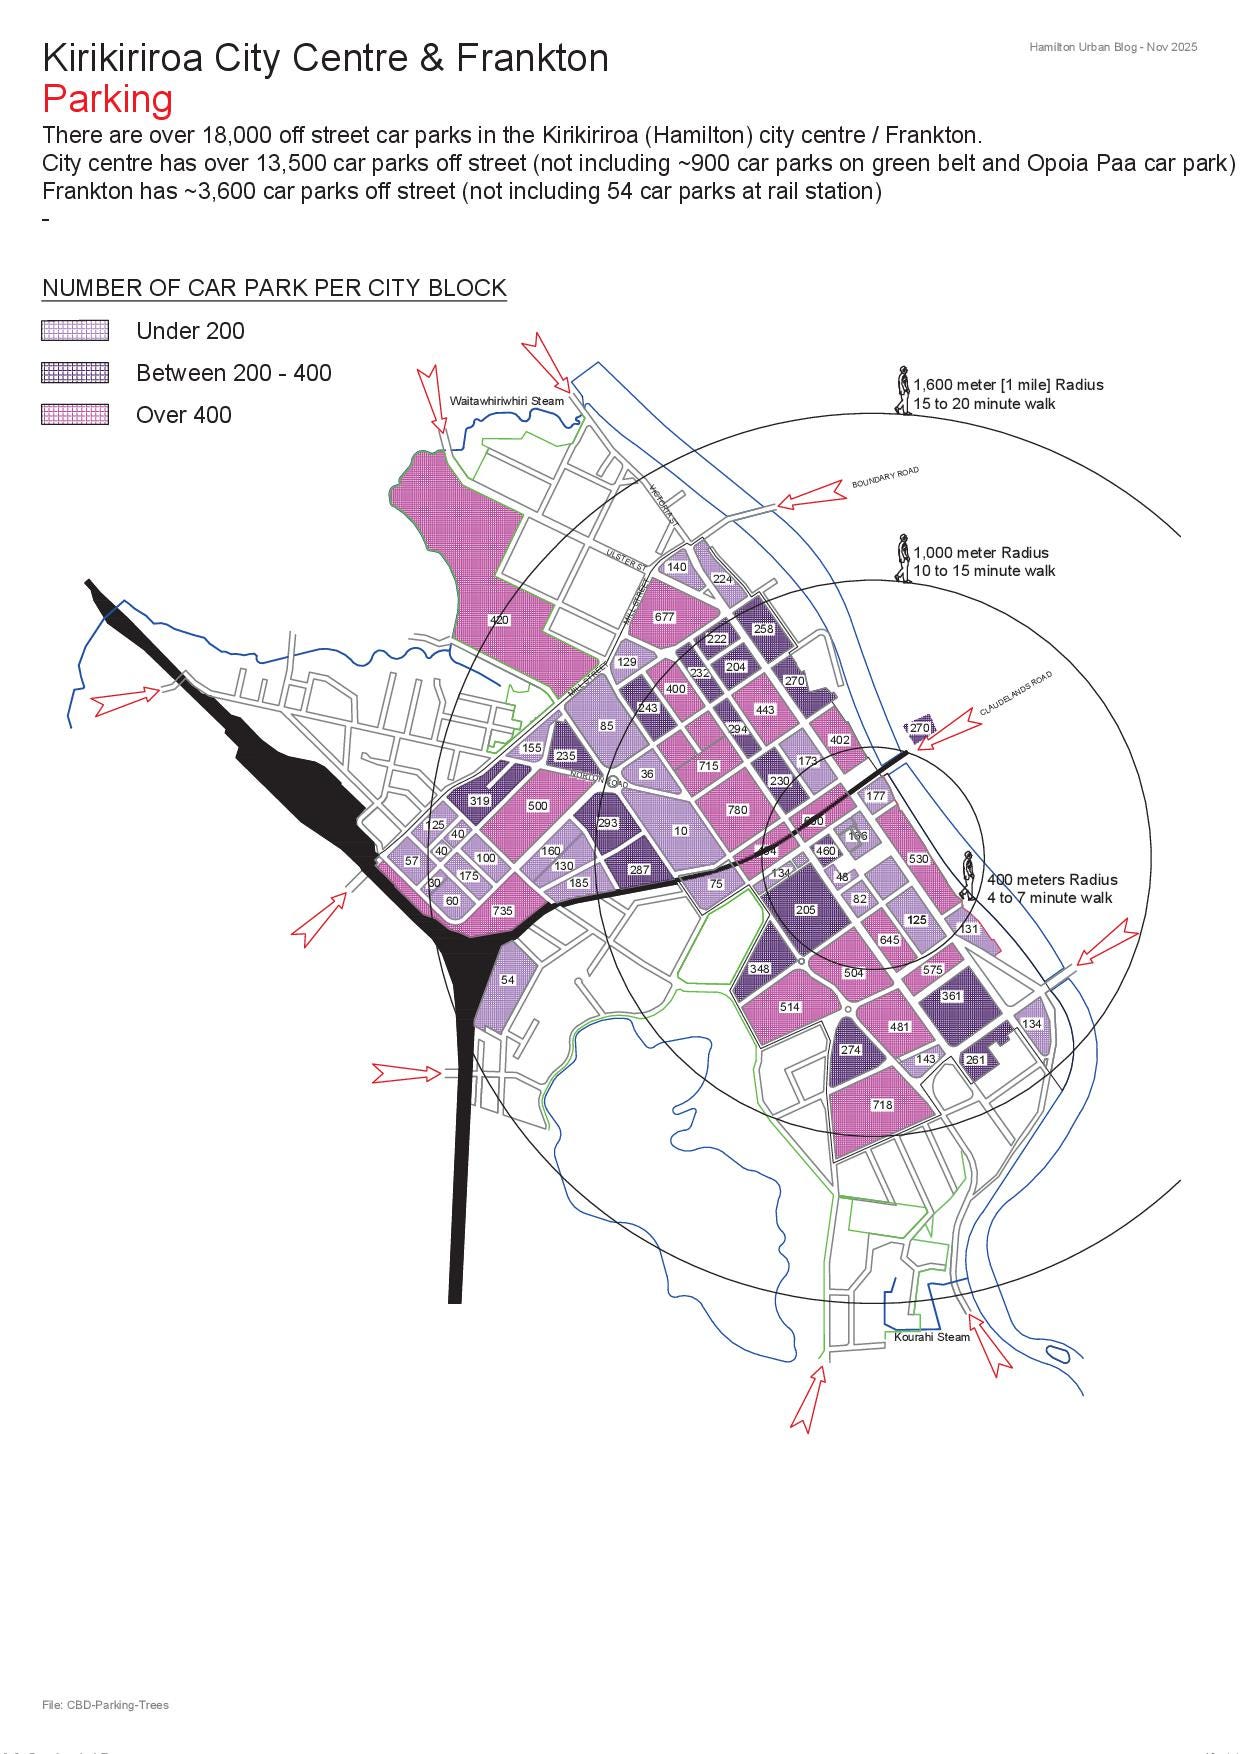
Is 30% of traffic congestion caused by cars searching for car parking?
Once about 85 percent of car parking is occupied, cars begin cruising or queuing looking for vacant parking, making travel times predictably unreliable.
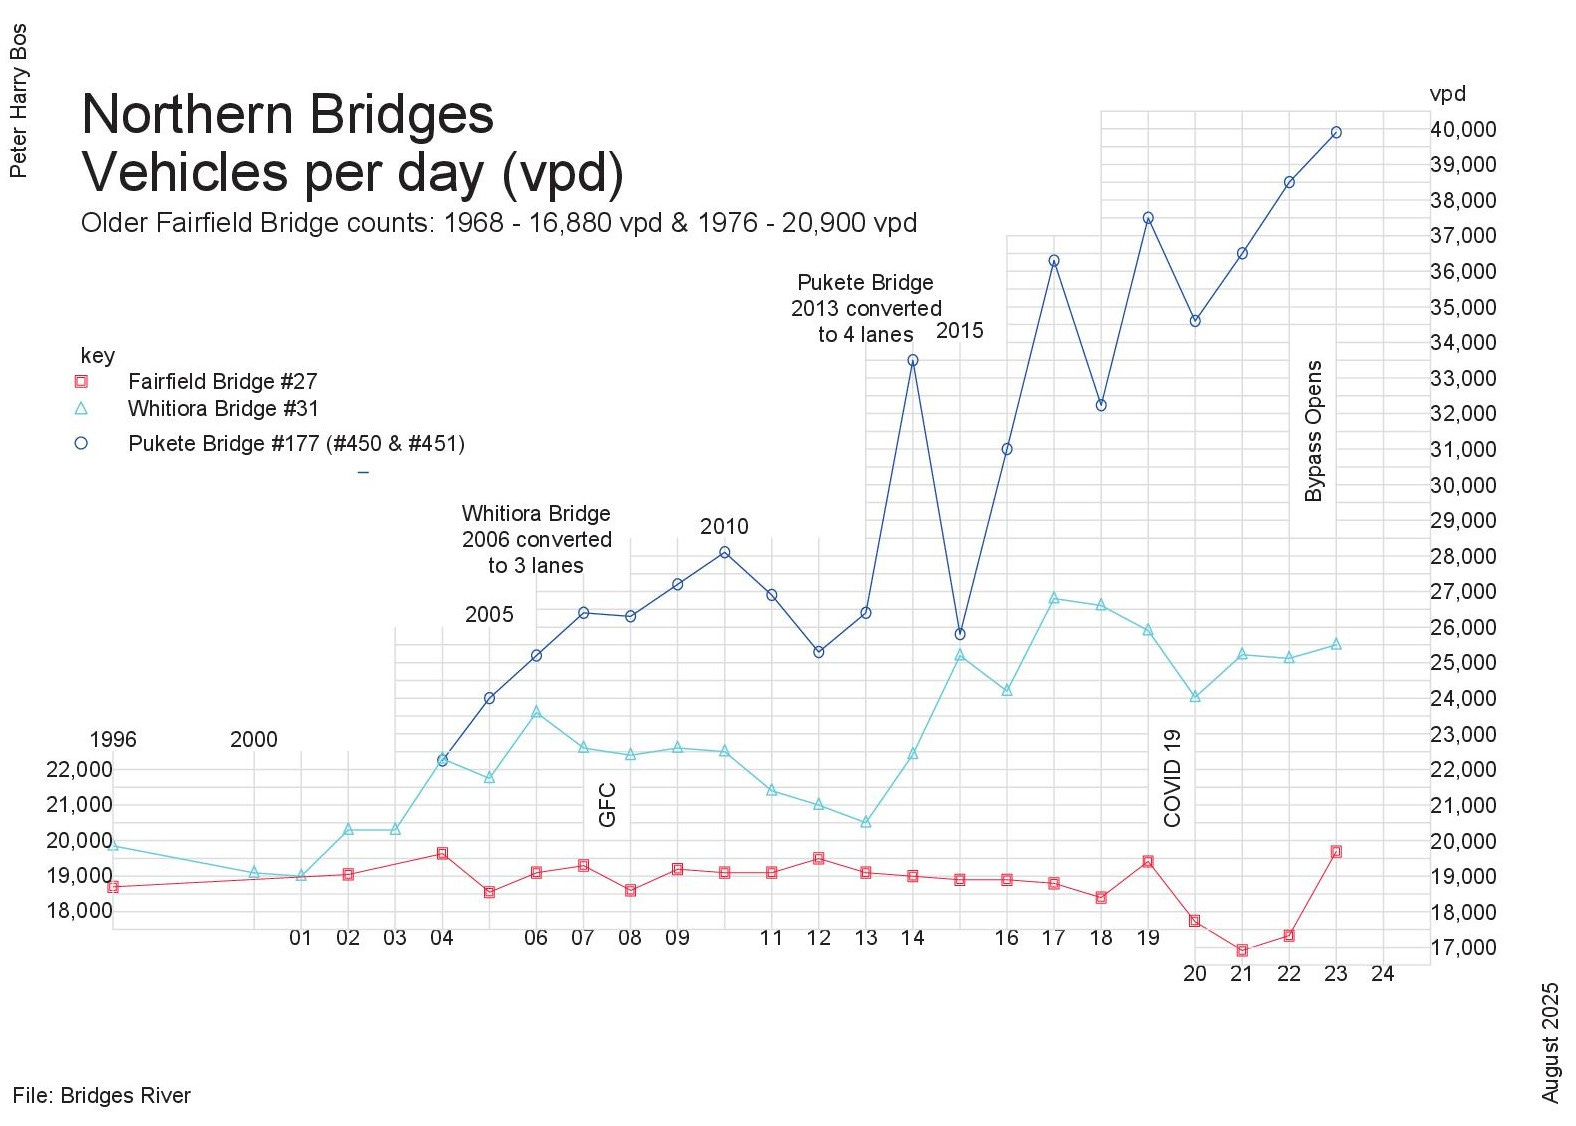
After the opening of the Hamilton bypass in 2022 traffic congestion increased by over 5 percent on Hamilton’s three northern bridges, with 4,200 vehicles per day added to bridge traffic in 2023 and GDP has stayed the same.
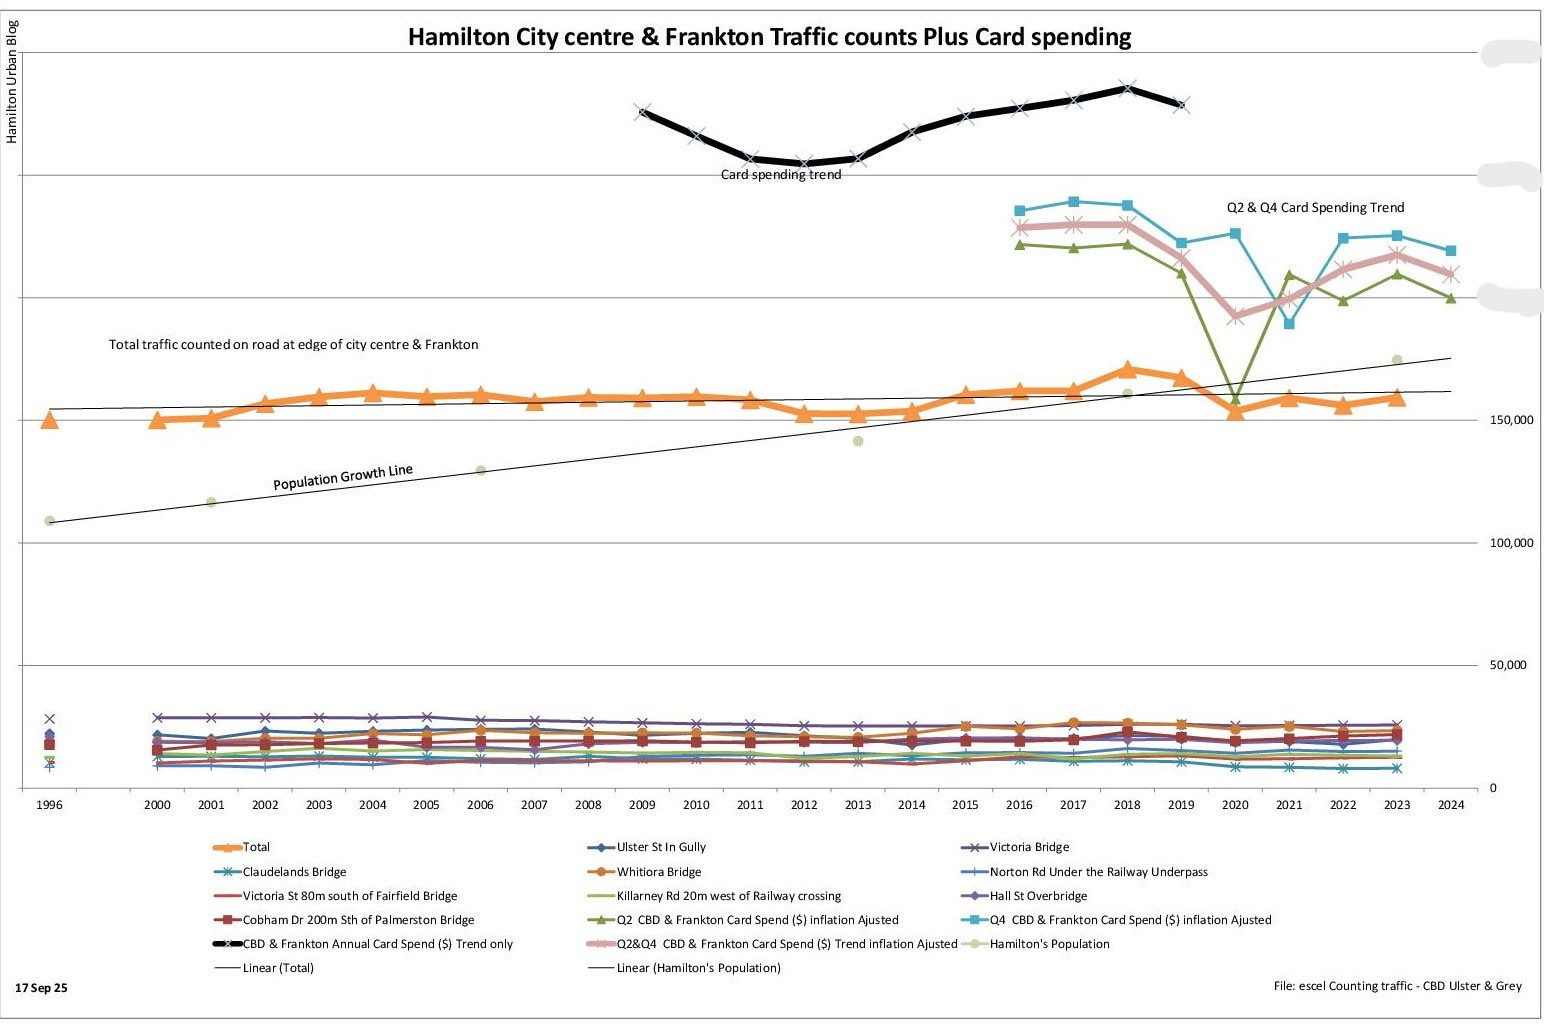
Card spending trends in the Hamilton central and Frankton (CBD&F) areas follow traffic volume trends and the traffic volume trend line is not increasing at the same speed as Hamilton’s population growth.