
The benefits of transferring Central Business Area (CBA) commuters from car to bus has been assessed at about $200,000 [$3,294,193 adjusted] a year for the next 20 years [from 1973] (p.239) ... a target 30 percent of CBA commuting by public transport is not excessive in relation to other cities in New Zealand and elsewhere in the world ... U.K. cities show bus proportions rising with population from 20 percent for an urban population of 200,000 (p.219) ... [for Hamilton] a reasonable target is that the proportion of CBA commuters using public transport should be doubled from 10 to 20 percent (p.218). This information comes from the 1973 Hamilton Transport Study (April 1973) by BECA Carter Hollings & Ferner, and Wilbur Smith & Associates, Consulting Engineers – ‘the following principles and concepts are suggested as a basis for arterial road network design (1) The Freeway in the City, Department of Transportation, U.S. Govt. Printer, 1968. (2) Traffic in Towns (Buchanan Report), Prepared for the Minister of Transport (U.K.), 1963.’
Adjusted 1973 Q1 to 2025 Q4 – Reserve Bank of New Zealand, inflation calculator
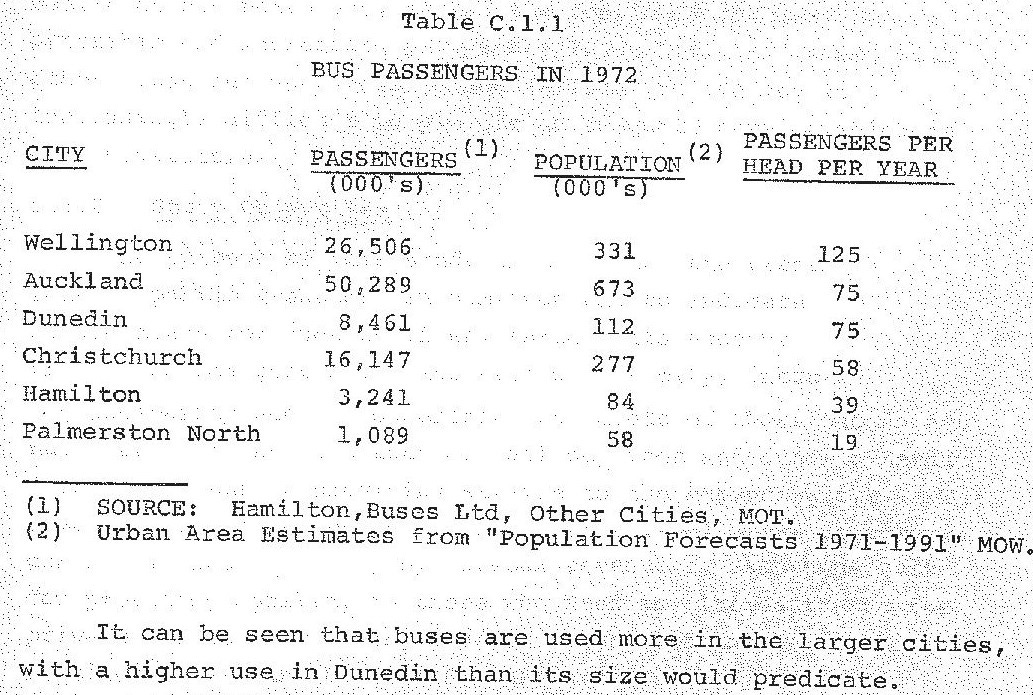
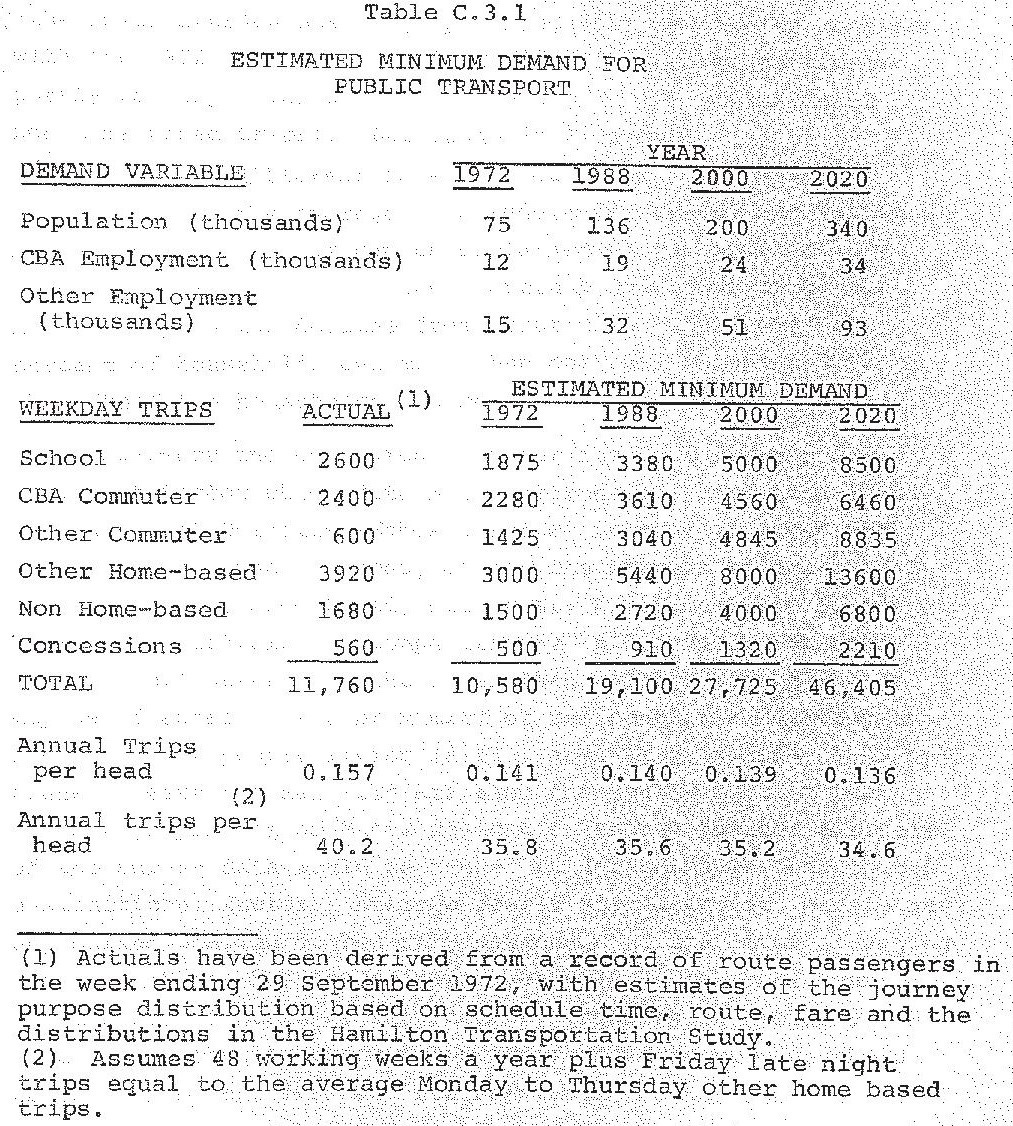
From page 174 - ‘Prior to the mid-1920s, most of Hamilton’s 15,000 or so residents lived within a mile [1.6 km] of the city centre and walked. Within the last 50 years [before 1973] the city’s population has increased fivefold, the radius within which most residents live has increased to two and a half miles [4 km] and motorised transport has been used to an increasing extent. The city now anticipates a further five times growth in population within the next half century in an area 12 miles [19 km] long by 6 miles [9.6 km] across ... Buses Ltd. Has operated the urban bus service in Hamilton since 1927 ... Annual bus patronage increased rapidly between 1927 when about half a million passengers were carried and 1948 when the total reached seven million, of whom about five and half million were passengers on urban services. This corresponded to an average of about 180 trips per resident a year (p.174) ... In 1950 the level was 150, in 1960 it was 60 and by 1972 it had fallen to approximately 40 trips per resident a year. During this period the average number of persons per car in New Zealand fell from 8.2 in 1948 to 3.0 in 1972 (p.174) ... in 1968, Hamilton’s residents made 3.3 vehicular trips a day of which 66 percent were by car, 13 percent by cycle or motorcycle, 13 percent by truck, 6 percent by bus and 3 percent by taxi (only one-third of whom were taxi passengers) (p.176) ... Ridership patterns – school children represent 23 percent, commuters (to and from their place of employment) 27 percent, other home-based including shopping 35 percent, and non-home based represent 15 percent of public transport users’ (p.190).
‘In 1962 the average fare per urban passenger was 5.6 cents [$1 adjusted] compared with 12.2 cents [$1.98 adjusted] in 1972 [2026 $2.67 Bee Card fare] ... Since 1960 fares have increased by approximately 10 percent per annum (p.189) ... a ten percent fare reduction leads to only a three percent increase in patronage whereas a ten percent increase in bus miles leads to a seven percent increase in passenger miles ... in the mid sixties, when fares were stable, bus patronage per head of population declined by about 1.8 percent a year as a result of increasing car ownership. This rate of decrease in bus patronage averaged 3.2 percent a year in the six years to 1972 when bus [fare] revenue per passenger increased at an average 4.5 percent per annum at constant prices ... a 17 percent increase in [fare] revenue rate resulted in a 9 percent decline in bus passengers and about 12 percent [decline] in bus trip per head of population ... Cheap fares are also listed as a primary means of improving the bus service but less important than providing more service ... It is concluded that up to double the minimum level of bus patronage may be achieved if an attractive public transport service is provided (p.215).
4.3 Public Transport Goals and Objectives
* bus stops within a quarter mile [400m] walking distance of all residential areas with a density of more than four dwellings to acre [988 per km/sq or ~10 per Hectare],
* Bus stops within 600 [180m] to 800 [242m] feet of major shopping and employment concentrations,
* minimum service frequency during the normal working day at quarter hour intervals in the peak and half hour intervals off peak,
* safe reliable service within plus or minus three minutes of scheduled times,
* early service to new residential areas, even before there is sufficient demand to make it pay,
* traffic priorities for buses where this increases the number of people who can be moved or reduces average travel times’ (p.53).
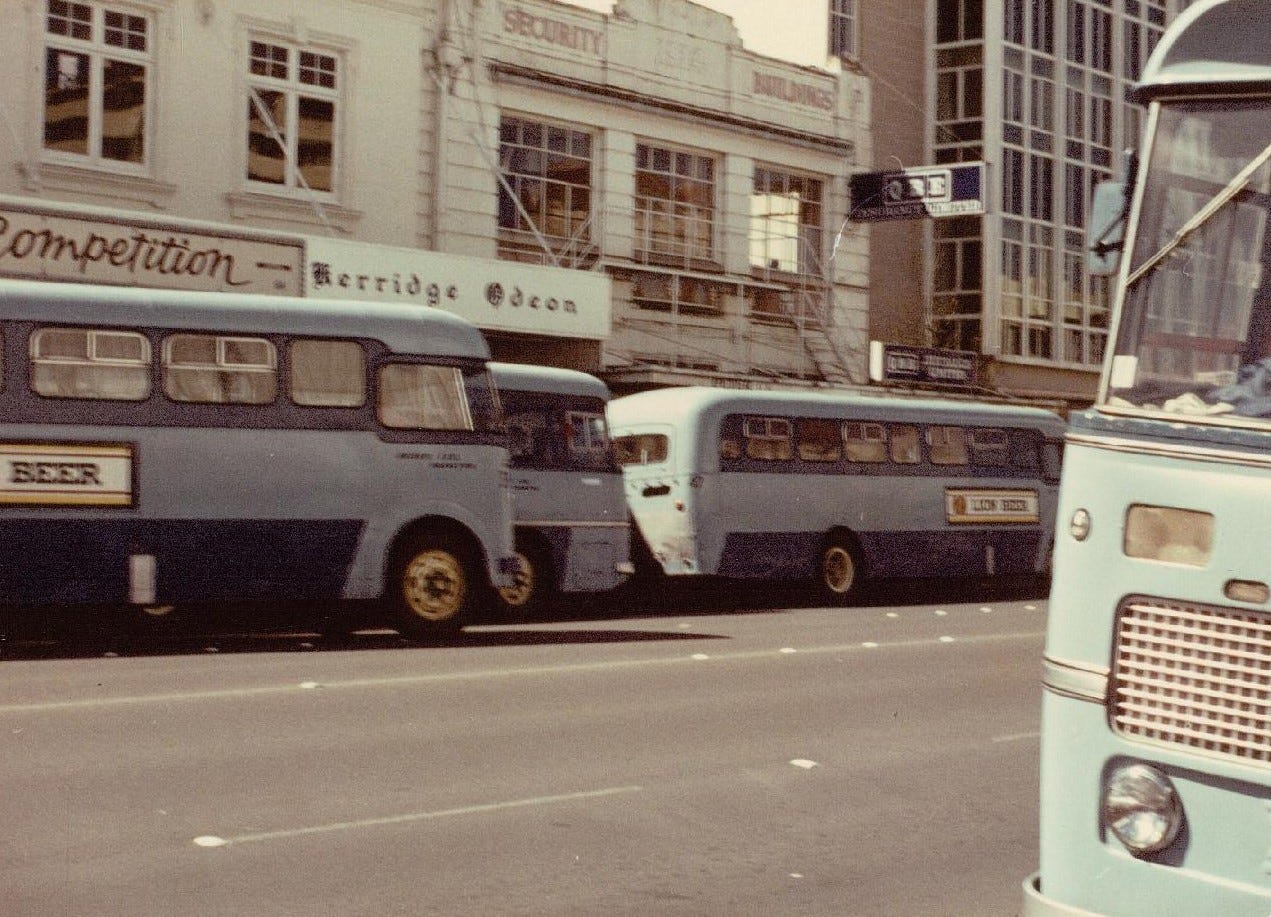
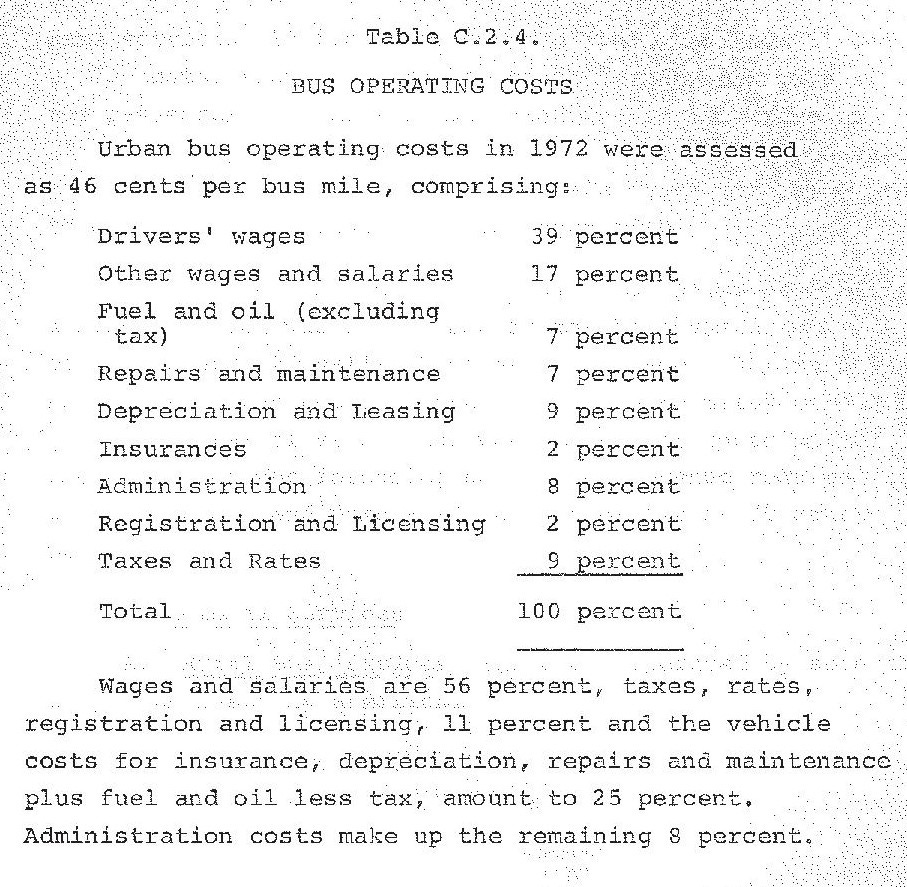
‘Buses Ltd use 50 buses with a total seating capacity of 1,887 and, of these, 13 are allocated to rural services (p.185) ... The majority of the buses are on Bedford chassis with the number of seats in each bus varying between 36 and 44 and with standing room for between 12 and 21 persons ... The average age of the entire fleet is nine years (p.187) ... the number of passengers per service, from 16.0 in 1968 to 12.5 passengers per service in 1972 (p.190 & 231) ... Buses Ltd – Staff employed total 69, comprising a Traffic Manager, Garage Foreman, Coach shop Foreman, 45 drivers, 5 mechanics, 7 garage assistants, 8 office staff and a Ticket Inspector ... Costs exceeded revenues by nearly three cents per mile, indicating a loss of about $25,000 [$411,774 adjusted] on urban services in 1972 ... Studies in N.Z. and overseas indicate that these figures are reasonable. In 1972 the loss incurred by public transport in Palmerston North was $88,708 [$1,461,106 adjusted] and in Wellington $1,930,250’ [$31,793,085 adjusted] (p.193).
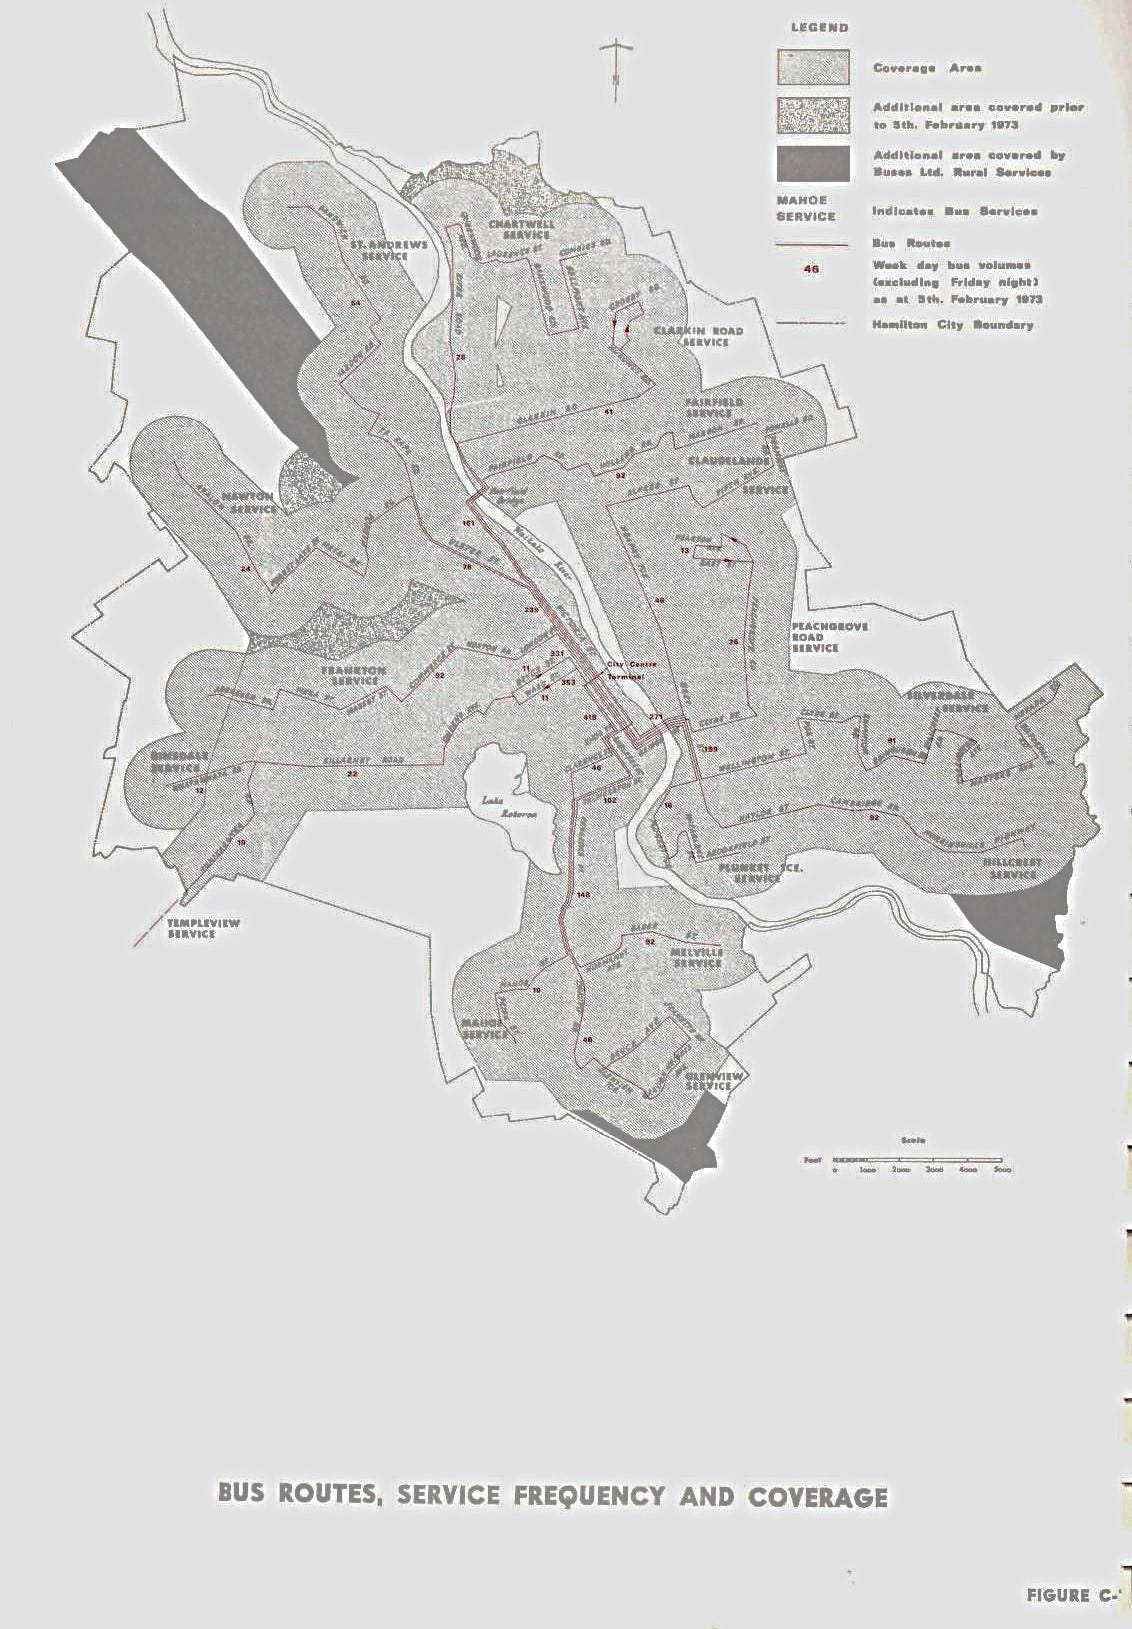
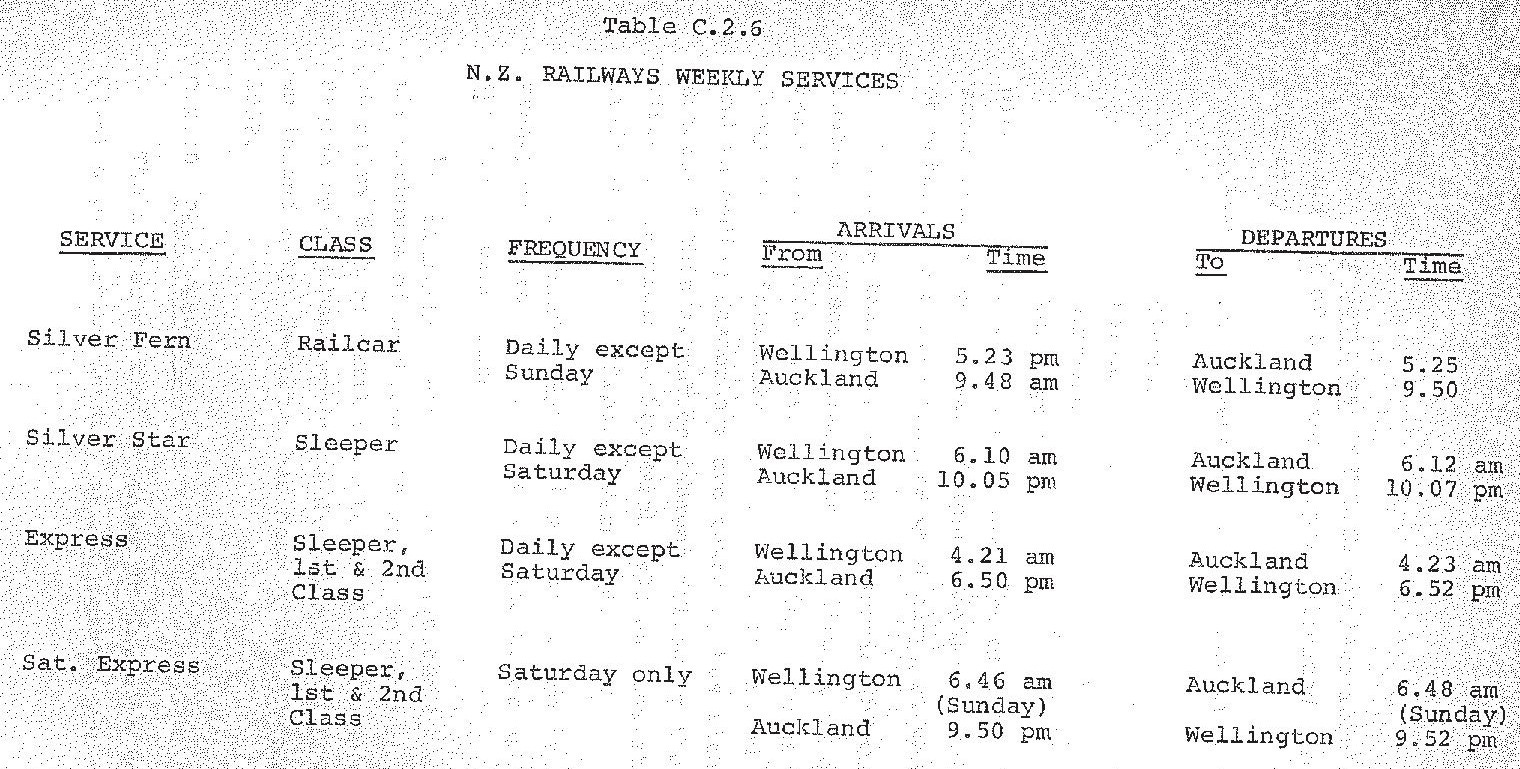
‘There are three daily express passenger trains each way between Auckland and Wellington (p.197) ... New Zealand Railways buses, which operate 48 intercity services to most parts of the North Island ... Mt. Cook Land-liners from Auckland to Wellington (p.141) ... Buses Ltd ... operates rural services between Hamilton and the surrounding towns of Ngaruawahia and Huntly to the north; Morrinsville, Te Aroha and Paeroa to the north-east; and Cambridge to the south-east. Hodgson Motor Services between the city and Te Awamutu to the south and by Pavlovich and Sons Ltd. Between the city and Raglan to the west. Waikato Coach Lines operate a daily bus into Hamilton in the morning and back to Gordonton in the evening’ (p.177).
Need for Public Transport ... ‘only half of the population hold a driver’s licence and there will always be people who can’t drive or don’t have access to a car because of age, disability, financial hardship or preference (p.49) ... [2018 approximately 106,587 people in Hamilton City held a driver’s license (learner, restricted, or full) out of a population of 160,911 equals two thirds hold a driver’s licence https://figure.nz/chart/JQHrKBxF0nt9jCIY ] ... Discounts are available to old age pensioners ... These reductions are normally 33-50 percent of the normal fare. Buses Ltd. also issue about 300 free passes for company employees and their marital partners, Plunket and community nurses, and blind people’ (p.188).
‘The net saving on roads and parking is 83 cents [$13.67 adjusted] a day for each CBA peak hour commuter transferring from car to bus’ (p.217).
end
No posts
Comments
Nothing yet. Say the first thing.
Sign in to join the conversation.