
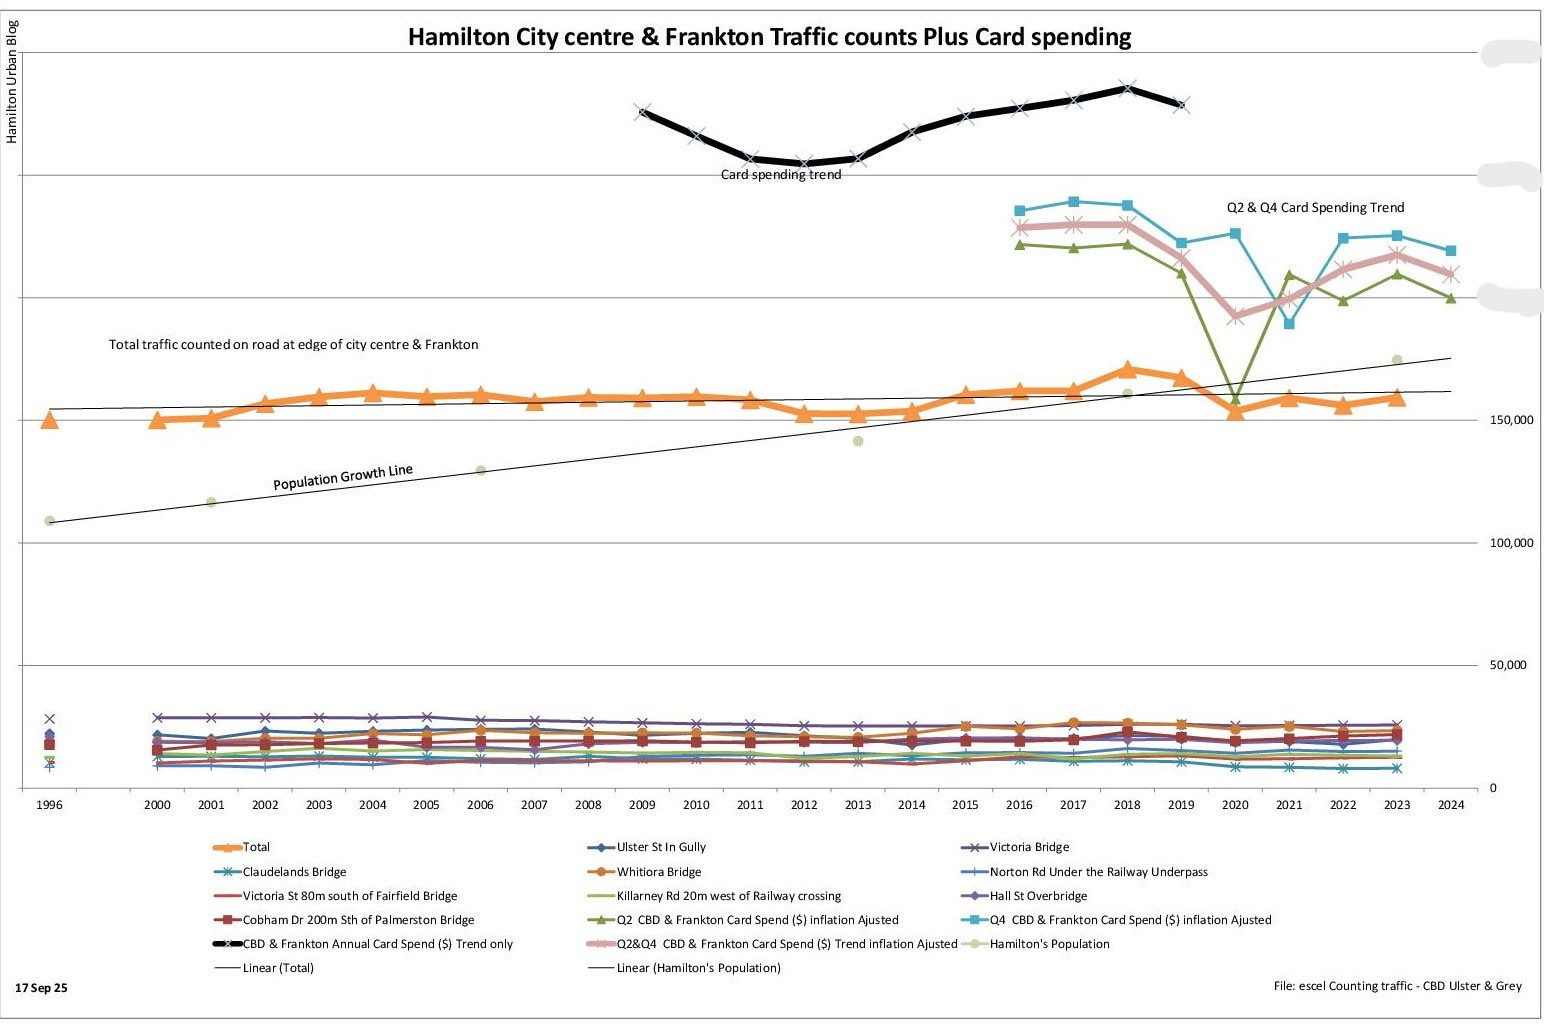
Card spending trends in the Hamilton central and Frankton (CBD&F) areas follow traffic volume trends and the traffic volume trend line is not increasing at the same speed as Hamilton’s population growth. Even though traffic volumes look to be stable, a June 4 council briefing stated “Central city pedestrian counts dropped 11.7% in between October 2023 and October 2024” (Link 1). This is after the Union Square parking building on Alexandra street was opened, with a capacity of 350 vehicles. If increased parking supply really did attract more pedestrians, one would expect to find some evidence, but there is none (link 2).
Link 1 - Elected Members Briefing - Wednesday 4 June 2025, 11:15am page27
Link 2 – Parking evidence Feb2018, Parking evidence – retail spending 2018, Parking evidence – retail spending 2019, Hamilton Central 1968 - Parking, Traffic, Pedestrians Jun 2019
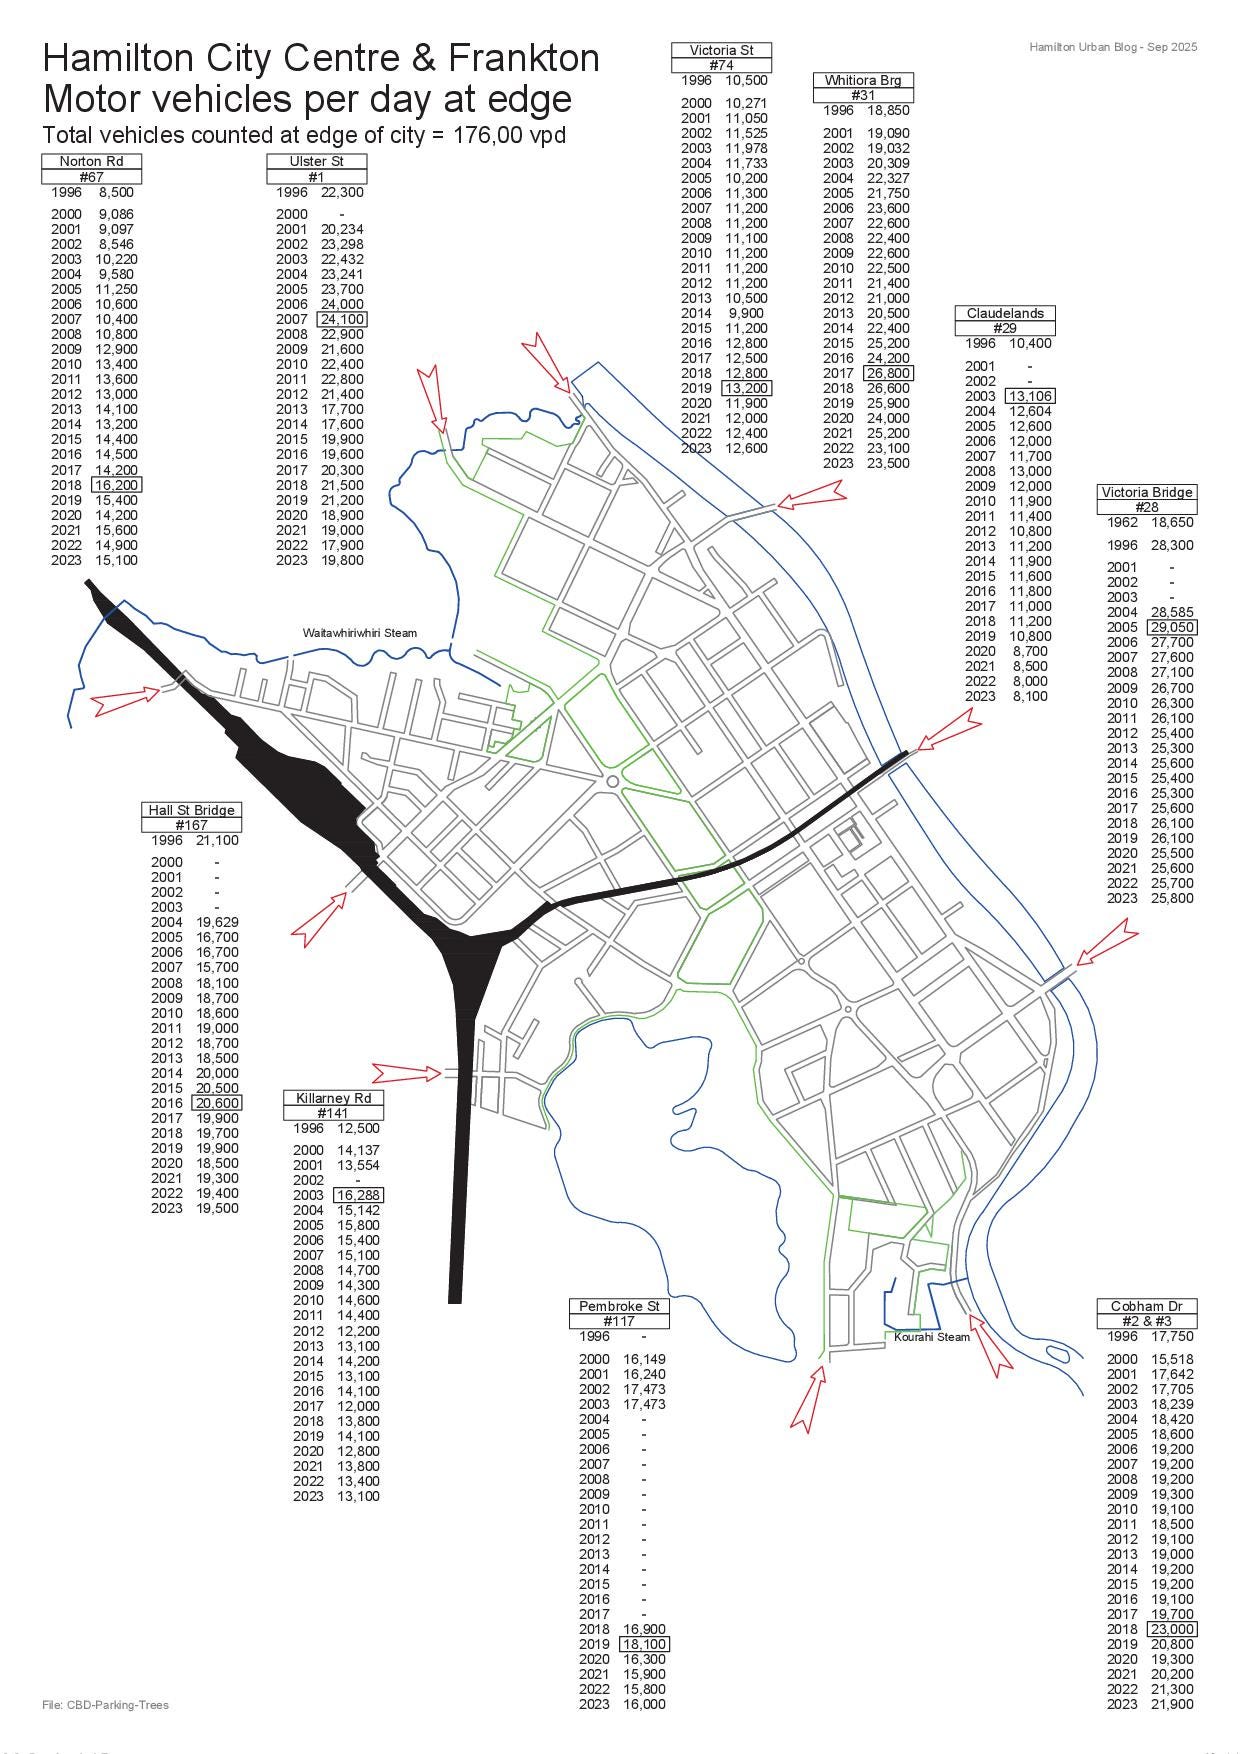
There are 12 car lanes entering the city centre and Frankton areas (CBD&F). The average number of vehicles per lane at present is about 6,670 motor vehicles per lane per day (vpd) or about ~667 motor vehicles per peak hour (vph) (see footnote 1)*. The Ireland Transport Authority (see end of post) says a traffic lane carries between 650-850 cars per hour*, so let’s say all traffic lanes carried the maximum of 850 vph. This is a 27% increase, and maybe a 27% increase in card spending. This would equal 850x12= 10,200 vph (102,000 vpd) entering the CBD&F. If there are 1.3 people per car there would be a maximum of 13,260 people in peak hours (see foot note2).
*Peak hour traffic volumes = approximately 10% of 24-hour vpd of Annual Average Daily Traffic - Number of cars per lane
Is it possible? ‘In the central city there are more than 12,700 parking spaces, of which only 22% (2,849 car-parks) are managed by Council’**. Just one peak hour of traffic would fill 87 percent of the available car parking, leaving most cars entering the city after this peak hour cruising, looking for parking, or at a standstill waiting at the edge of CBD&F for a car to leave. In addition, a car lane being used by 850 vph creates an extremely unstable / unpredictable traffic flow. Below is what different levels of traffic look like.
**Infrastructure and Transport Committee Tuesday 11 March 2025 – Item 11 page 84
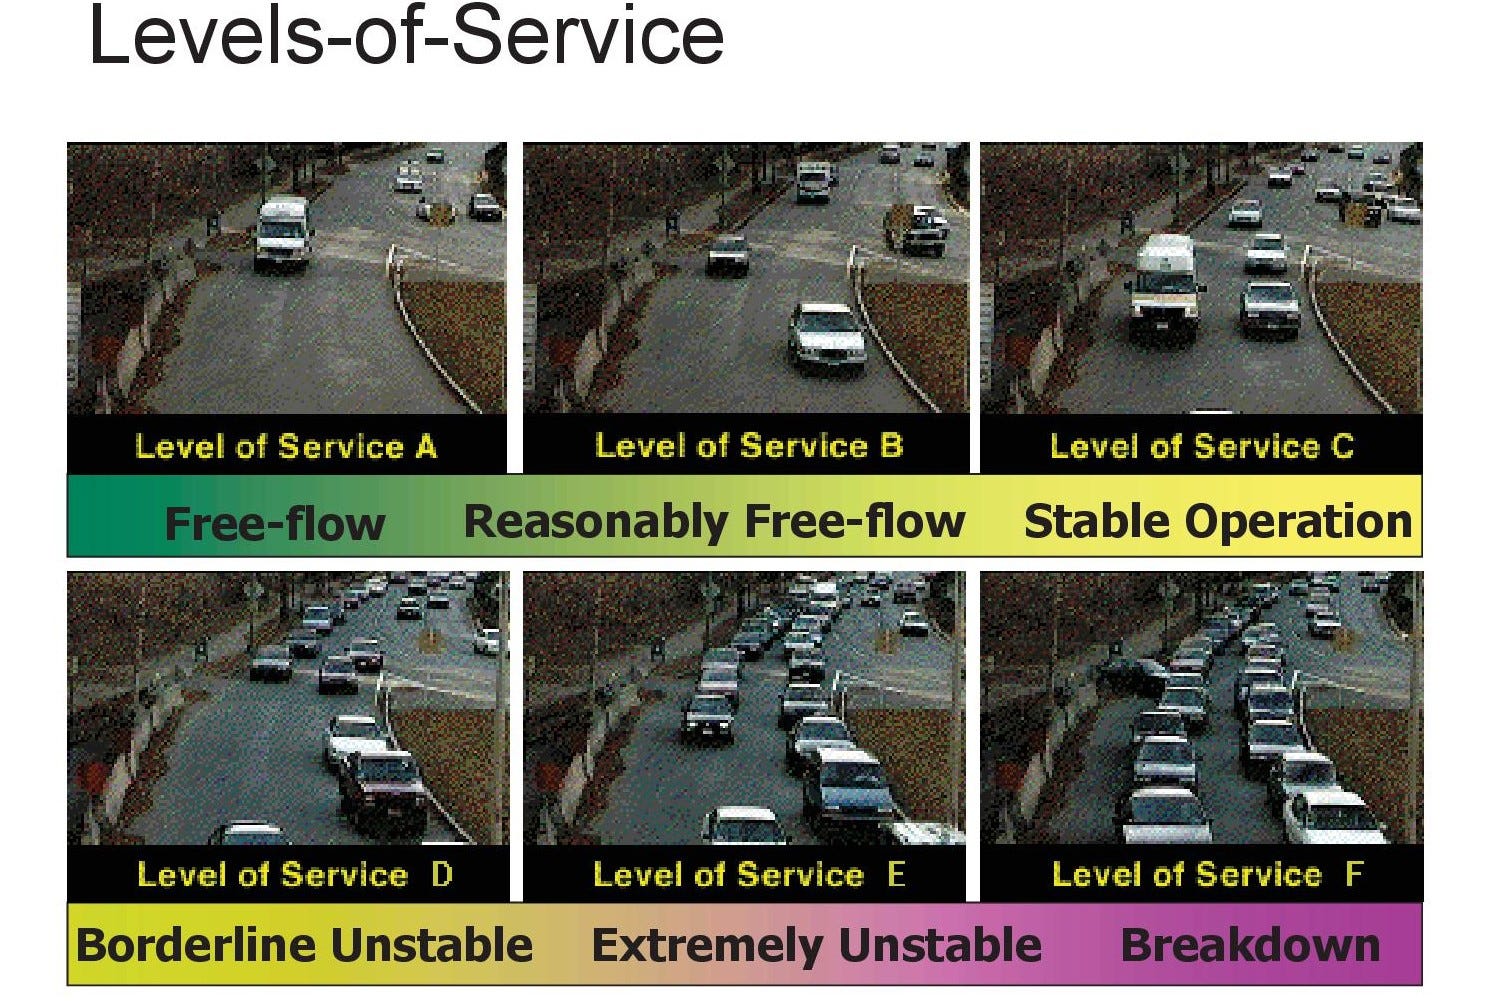
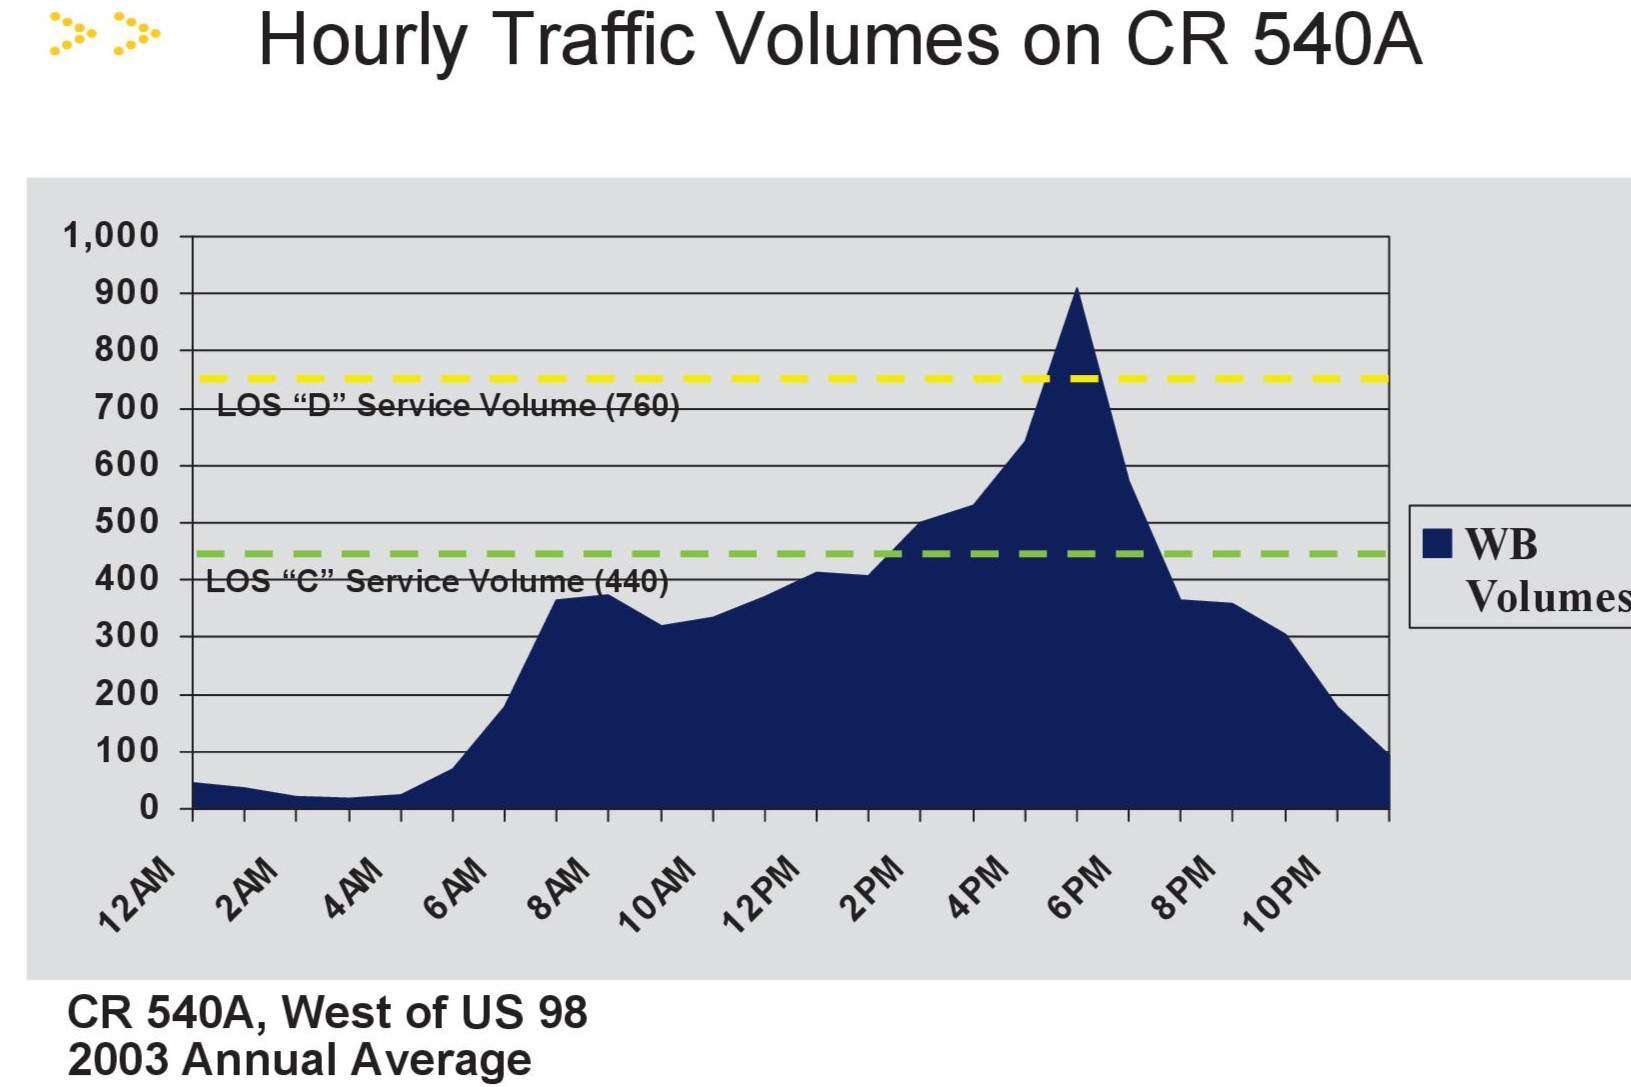

The above three images come from a presentation called ‘Concurrency 101’ for Polk County Florida 2006. Sadly no longer available on line
Footnote:
1. Total traffic count in 2023 was 159,400 vpd on the 12 lanes on 10 roads, divided by 2 = 79,700 cars entering the CBD&F per day, then divided by 12 lanes = 667 vehicle per lane
2. People per car based on 2023 census: 122,990 people said they travelled by car to work and/or education. Of these 97,373 drove, and 25,617 were passengers = 1.3 people per car.
end
No posts
Comments
Nothing yet. Say the first thing.
Sign in to join the conversation.