


This week we got two great inflation reports. Both producer and consumer prices stayed stable and September rate hike expectations got slashed in half.
The metal’s response was underwhelming to say the least. Gold did rally, touching 4449 on Thursday, but at the end closed almost exactly where it started.
This week I’m looking at three things that stand in the Gold’s way despite cooler inflation data: 1/ long-term treasuries 2/ oil 3/ market’s rate expectations.

Two weeks ago, I’ve mentioned how the short-term and long-term rates have split. The split isn’t going anywhere and this week was a good example of it - cool inflation dragged us02y lower whereas the us30y rose to the levels we haven’t seen in 20+ years.
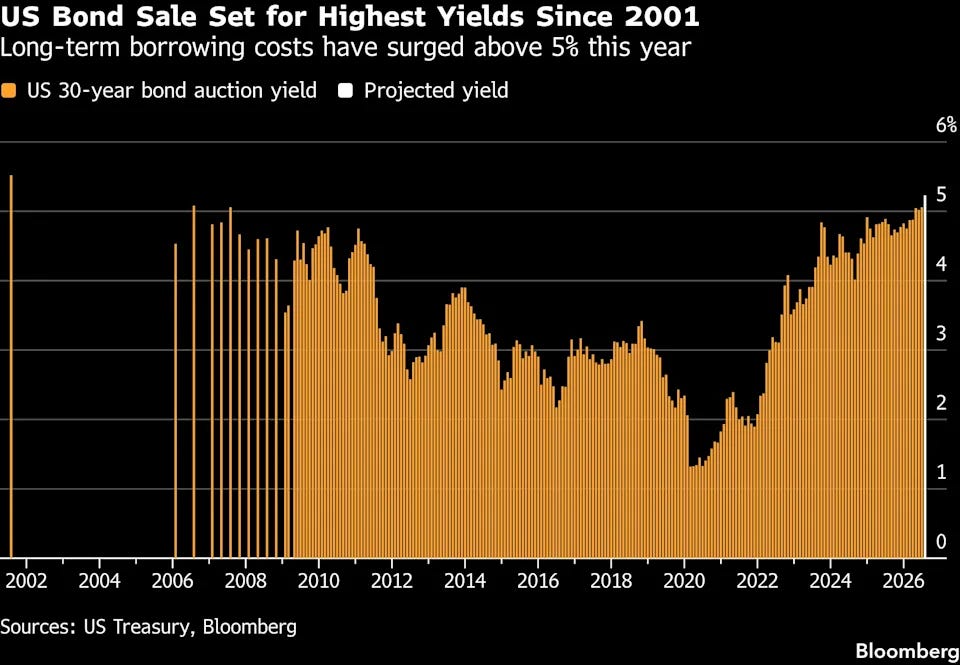
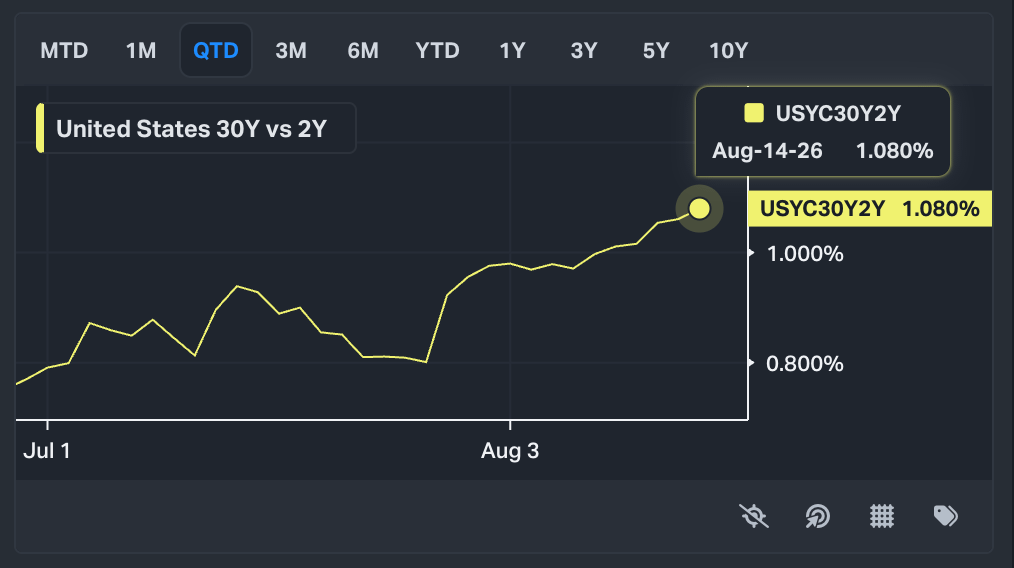
US debt is now close to $40 trillion, and it keeps borrowing. Those bonds need buyers, which creates a supply problem and partially explains why the high end of the yields is stuck so high. Note that I write “partially” because this week revealed there are more factors at play.
The first being - who is an actual buyer of these bonds.
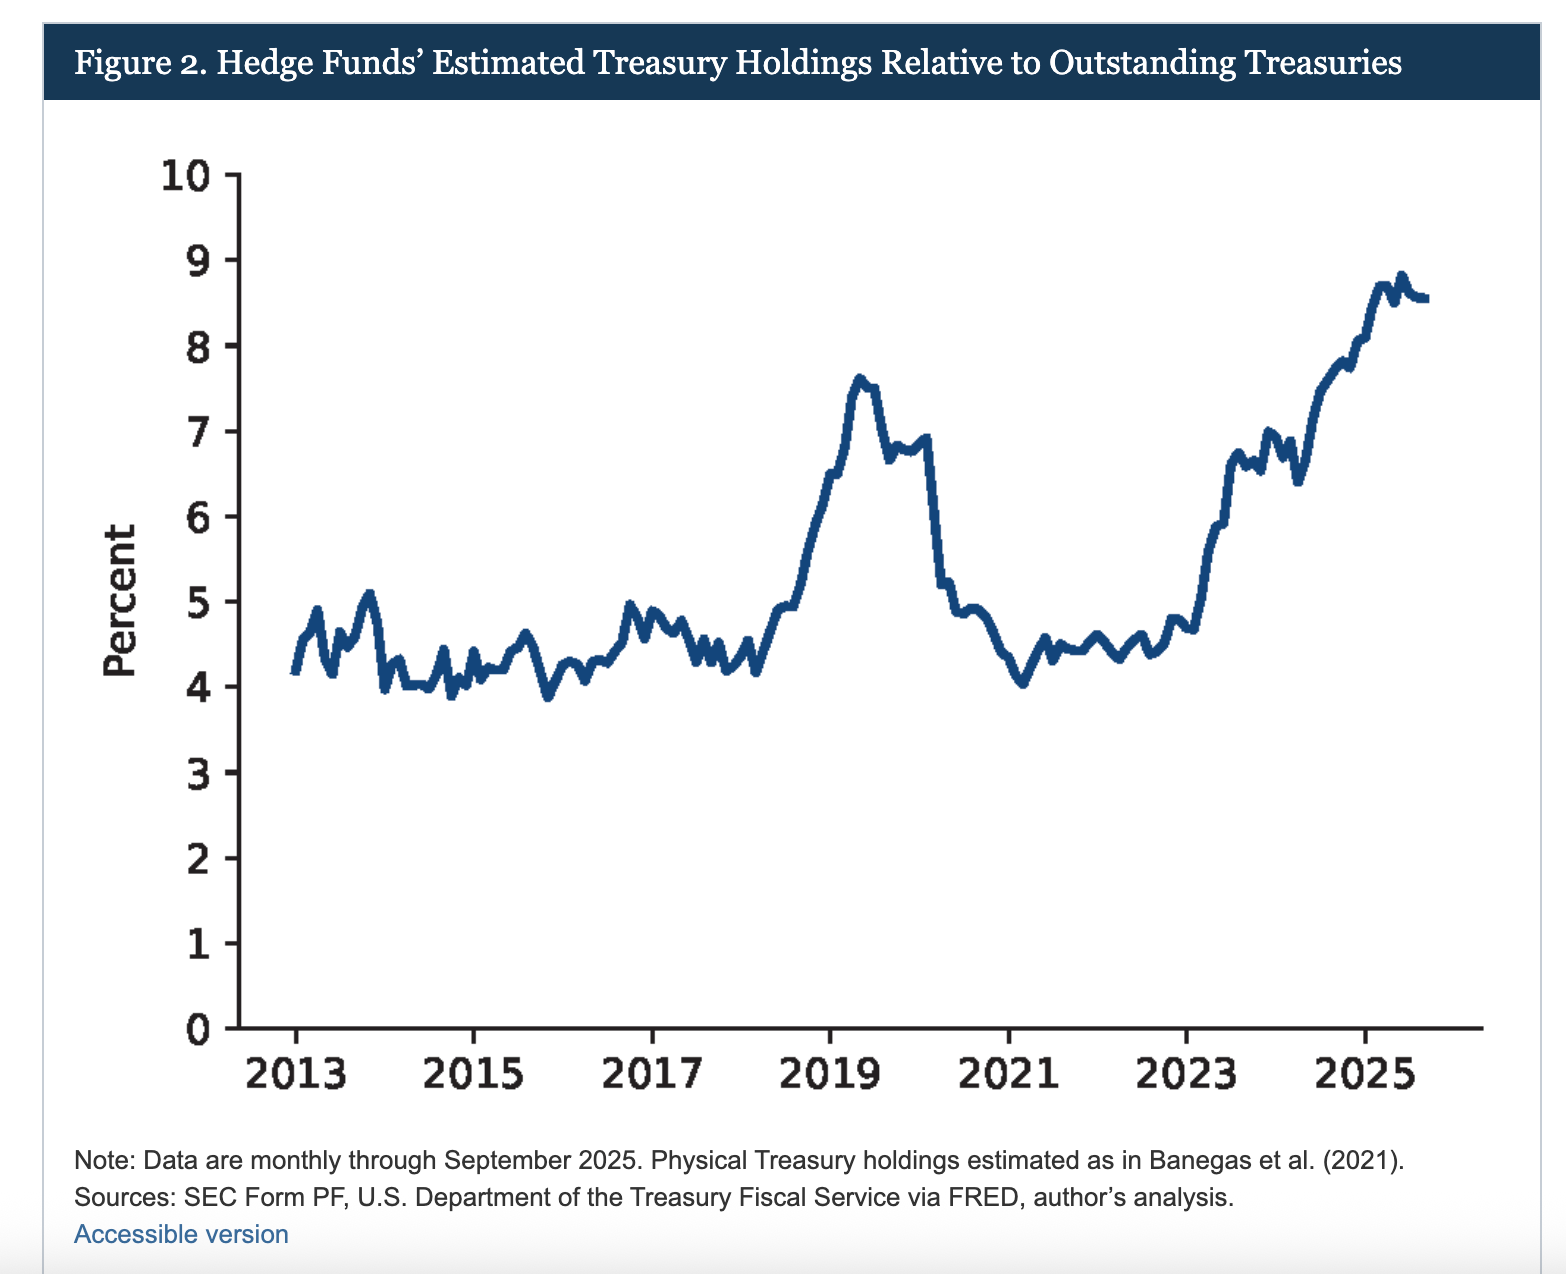
The June report from Federal reserve revealed that in Sep 2025, hedge funds owned ~$2.4 trillion of long exposure to US treasuries (Here’s the link to the actual report if you fancy a closer look). If that numbers doesn’t strike you enough, take a look at the table below.
The top 3 biggest foreign holders of US treasuries - Japan, UK, and China, held ~$2.75 trillion at the same time.

Of course, this is not a perfect comparison because the hedge funds number includes Treasury exposure across different strategies and the countries numbers measure reported holding. But these are striking numbers.
The Fed report then concludes that hedge fund’s long exposure was tied to basis trade and swap-spread arbitrage which rely heavily on leverage and borrowed money.
Why should we care?
Because borrowed positions don’t really choose when to sell. During market stress, those hedge funds sell bonds fast to repay their loans, lifting the yields higher and causing more selling.
So the problem here is obvious - the safest market in the world has a large chunk of buyers who get to panic first
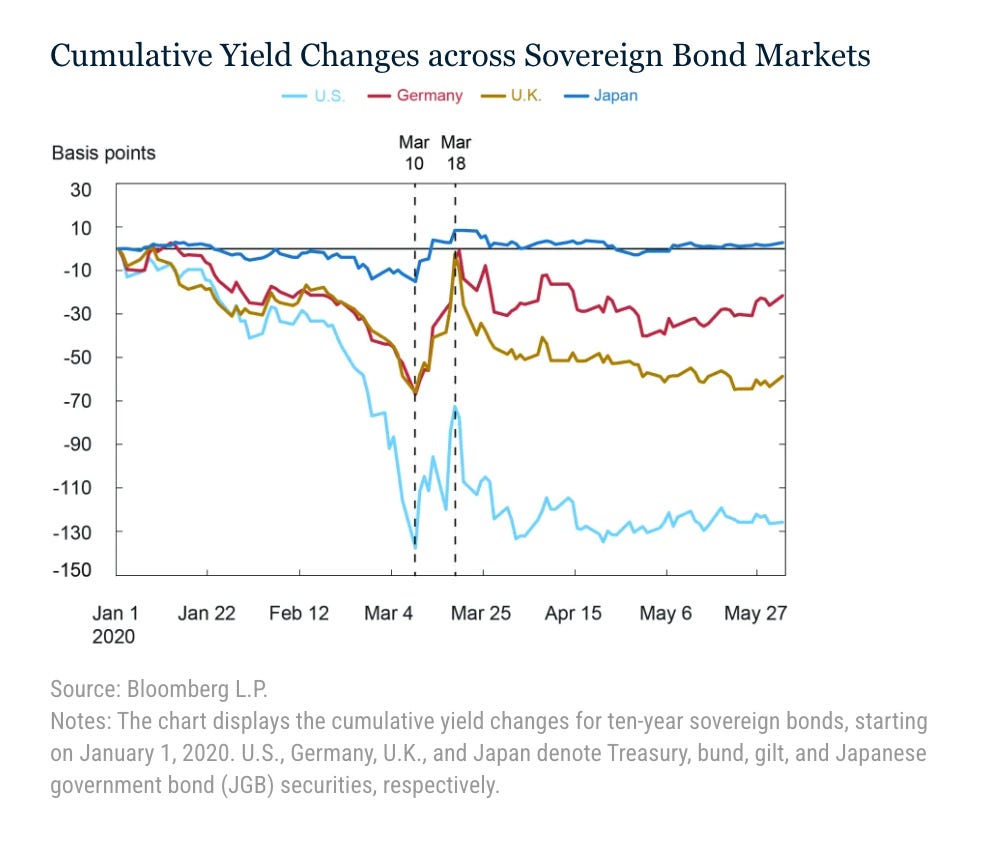
Let’s travel across the world all the way to Japan - the home of carry trade.
I won’t reiterate on the carry trade here. You can get a refresher in the post below (free to read for everyone).
Carry trade works great as long as Japanese rates are low. But markets are now expecting Bank of Japan to hike as soon as September. With stronger yen and higher rates, carry trade becomes less profitable and local investors have all the reasons to sell assets they bought with the borrowed yen. US Treasuries is a big chunk of those assets.
So look at the US bond market now and guess what happens if: US hedge funds with leveraged positions sell on one side and Japanese investors become sellers as soon as Japanese rates start climbing higher on the other.
Let’s come back to the answer a bit further on because we had the third piece in this story.
Every week, I read through hundreds of news, data releases, and positioning reports to map out how each economic event will move the Gold market. I turn that work into a weekly Gold plan that I use myself.
Inside this week’s plan:
Every support and resistance zone on my chart
5 setup ideas with exact entries, stops, and profit targets I’m using
My capital protection plan with exact alerts when to reduce/cut my position
The interactive Trade Board: input the current price and it shows you which setups are live and which need extra confirmation.
When you join premium, you also get:
The Gold Spotter indicator - my proprietary warning system that shows major market trend shifts before everyone else.
Proprietary SAGE indicator - a rule-based system designed to put you in high probability buy setups and keep you away from trashy ones.
Mid-week level updates on Telegram - Levels shift and when they do, I send you an update.
One trade won’t make your year. A process you can repeat every week just might.

Comments
Nothing yet. Say the first thing.
Sign in to join the conversation.