

This week's macro calendar looks busy, but most of it comes down to one good old question: Are there signs inflation has started spreading beyond energy?
We get three major data points to find out:
Wednesday: ISM Services Prices Paid
Thursday: Unit Labor Costs
Friday: Average Hourly Earnings
If these numbers come in hot, a September rate hike moves much closer to becoming the market's base case.

ISM Manufacturing came in at 55.6, above the 54.0 forecast.
The internals were just as strong with new orders up and production at its highest level since 2021. Factory employment also expanded for the first time in nearly three years.
Prices Paid eased from 73.0 to 71.1 , but I wouldn’t read too much into that. The survey mostly reflects June, when oil pulled back during the ceasefire. And for some perspective, Prices Paid started the year at 59. Today it’s 71.
One purchasing manager summed it up well, saying costs have climbed since oil jumped in March, and manufacturers expect to pass those increases on as quickly as possible. Now we need to see if it’s spreading beyond factories.
Unemployment is 4.2%. The Fed considers this full employment, so jobs are taking a back seat while inflation gets most of the attention.
I’m watching for:
Unemployment: 4.4% or higher
JOLTS job openings: below 7.0 million
Initial jobless claims: above 240,000
Anything short of that is unlikely to move policy.
Because the labor force is growing more slowly, the economy now needs only about 50,000 new jobs each month to keep unemployment steady. A payrolls report that looks soft isn’t automatically good news for Gold.
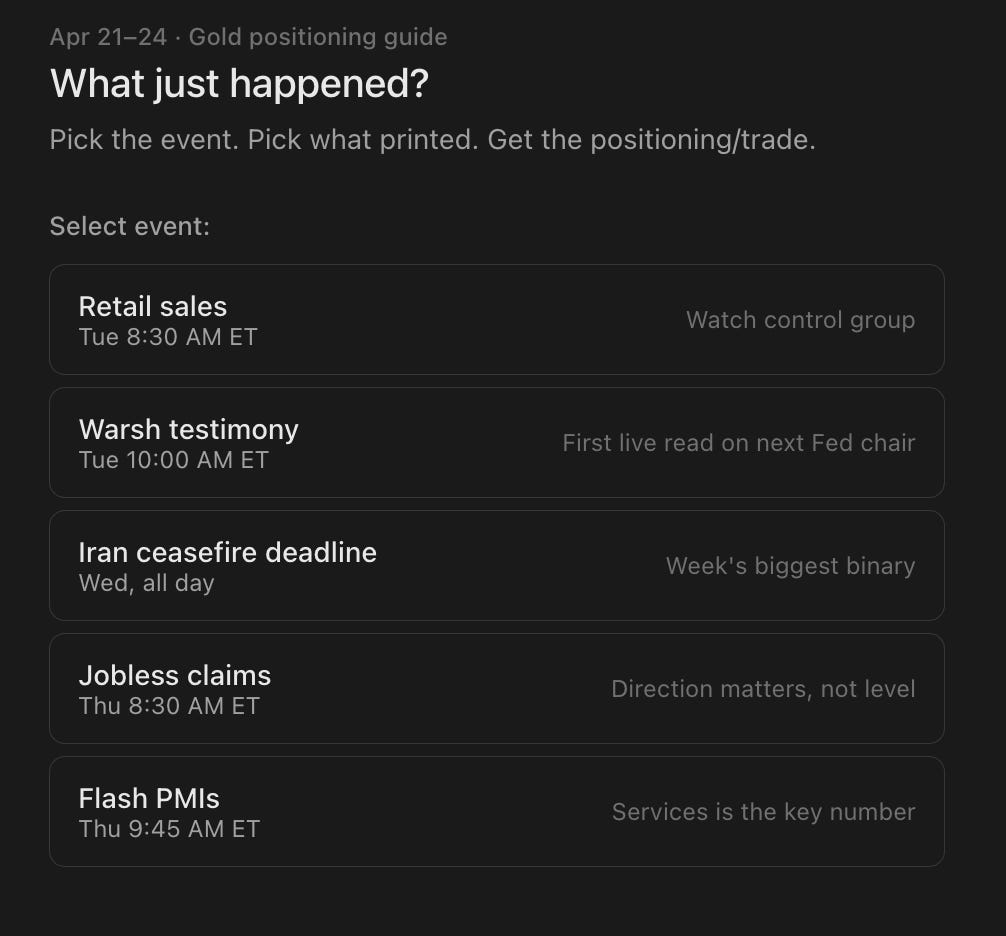
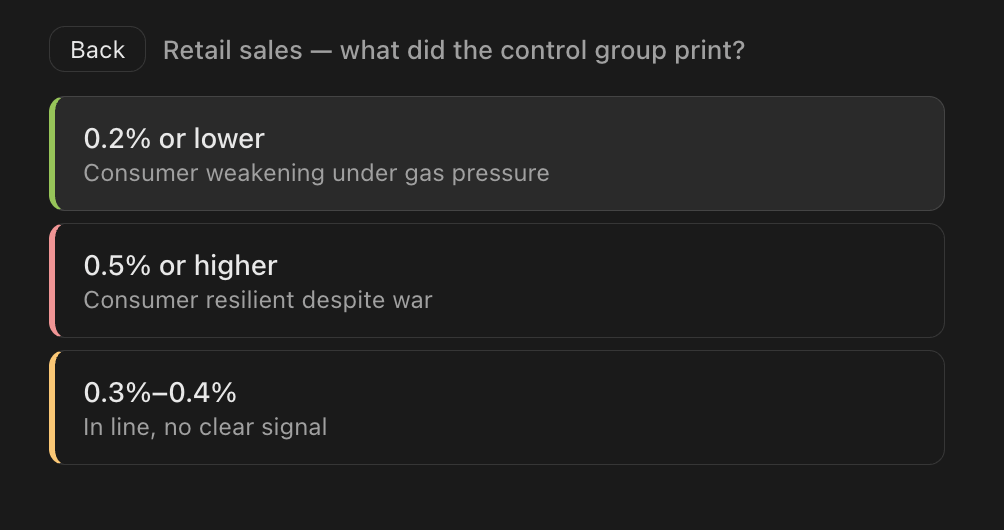
Instead of reading through every scenario to find the one that applies to you:
you tap the event
tap what printed
and get the exact verdict, execution plan, and warning in three seconds.
Open it on your phone before the number drops and you will know exactly what to do the moment it hits.
The context and reasoning behind each scenario is still in the post below, and I recommend reading it first so you understand the “why” before you use the tool for the “what.”

Gold is hovering ~4,050, right in the middle of the chop zone. From here, none of our 5 trade ideas from Sunday Gold Insider report are active yet.
Our job now is to wait until this week’s data pushes the price to the edge of the range.
🔴 Before taking any short from the Sunday plan (SS1, SS2, SS3), I want all four lined up:
2-year Treasury yield: rising ↑
DXY: rising ↑
30-year Treasury yield: holding steady or rising ↑
Brent crude: flat or higher ↑
🟢 For longs (SW1, LS1, LS2), I want the opposite:
2-year Treasury yield: falling ↓ and staying lower for at least 30 minutes
30-year Treasury yield: falling ↓
DXY: falling ↓
Brent crude: flat or lower ↓
❌ These are the combinations that usually keep me out.
2-year ↓ + DXY ↑
The dollar is moving for reasons other than Fed expectations. That’s often safe-haven demand or euro weakness. Gold tends to chop.
2-year ↓ + 30-year ↑
We saw this last week. Not a convincing long setup.
2-year ↑ + DXY ↓
Doesn’t happen often, but when it does it’s usually an overseas dollar-driven move. The 2-year matters more, but conflicting signals are still conflicting signals.
Brent ↑ + yields ↓
Lower yields can help Gold, but rising oil keeps inflation pressure alive. That combination often fades quickly, so I don’t chase longs especially if price is overstretched.
🔥 Hot prints (prices paid 68+, ULC 2.4%+, AHE 0.4%+, ADP 130K+, NFP 150K+):
A 1H close below 4,021 triggers Yellow Alert (from Sunday report) and opens up SS3 possibility.
If Gold bounces into 4,061-4,076, SS1 comes into play. The macro backdrop is still bearish, so I prefer selling the rally.
If price simply rolls over from the middle of the range without reaching either level, let it go.
If selling reaches key support, SW1 is only a swing setup until Tuesday's New York close. After that, it's just an intraday trade.
❄️ Cool prints (prices paid under 64, ULC under 1.8%, AHE 0.2% or lower) or a labor break (unemployment 4.4%+, openings under 7.0M, claims 240K+):
The first move will probably be higher, but patience matters here.
You can try to piece together the puzzle yourself...
...Or you can get the full breakdown before the numbers drop.
When you subscribe, you also get access to my entire professional toolkit:
My weekly roadmap and battle plan - exact levels, exact setups, and exact risk management for the week ahead. No guessing.
The Gold trend-shift indicator: My proprietary warning system for TradingView that helps you see major trend shifts before the crowd.
Proprietary SAGE - a rule-based indicator designed to put you in high probability buy setups and keep you away from bad ones.
Mid-week level updates on Telegram - Markets change. Levels shift. When they do, you’ll know immediately.
You don’t need more news. You need a plan.
Comments
Nothing yet. Say the first thing.
Sign in to join the conversation.