
Menu labels are supposed to help us make healthier choices. They are policy in action – mandatory calorie disclosure, salt content warnings, traffic lights and NutriScore. There is just a small problem: they are more often wrong than they are right.
We measured the salt content in takeaways from both local shops and major chains. The variation was startling – not just between outlets, but day-to-day at the same location. And when we compared our measurements to what the labels claimed? The labels failed more often than they succeeded.
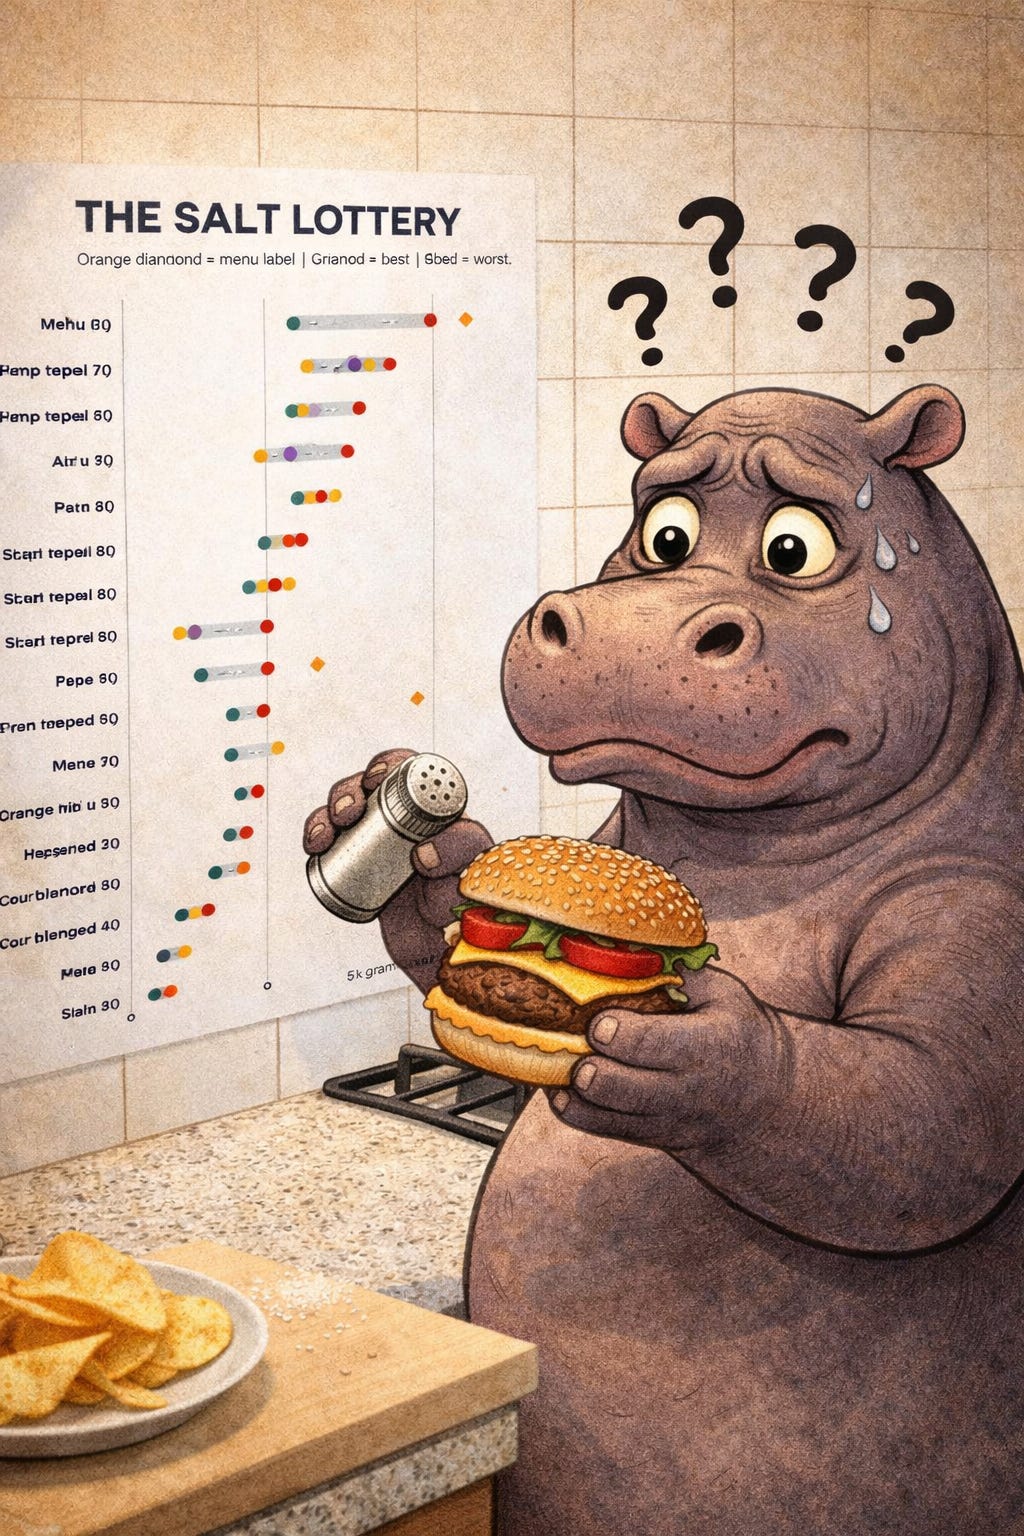
 for various takeaway-style meals from two locations labelled (A) and (B). The x-axis runs from 0 to 8 grams of salt. Each dish is represented by a horizontal bar with: A green circle (best/lowest salt), An orange diamond (menu label / stated value), A red circle (worst/highest salt), And a grey bar connecting the range of measured values. Dishes are ordered from highest variability / highest salt at the top to lowest at the bottom. Key findings include: Kebab (A) has the widest range (~1.2–6.2 g), with the single highest individual measurement. Vegan curry (A), vegan burger (A), and several other vegan options show moderate to high variability. Chips (B) has the lowest and most consistent salt (~0.8–1.8 g). Non-vegan kebabs, curries, burgers and chicken dishes generally range between ~2–5 g, with many showing substantial differences between labelled and measured values. Orange diamonds (menu stated values) frequently sit outside or at the edge of the measured range, illustrating inconsistent or misleading salt labelling across the tested dishes. This visualisation highlights the unpredictability of salt content in fast food, especially for kebabs, curries and burgers.")
This isn’t trivial variation. For someone managing hypertension and trying to stay under 6g daily salt intake, these measurement errors can mean the difference between compliance and excess – they would just never know.
This is not about regulatory failure or evil industry. It’s about a fundamental assumption in nutrition science that everyone knows is wrong (but that is conveniently ignored): food composition is constant.
A satsuma might cover your daily vitamin C needs. Or it might provide half that. Or double. We do not know unless we analyse the very satsuma you ate.
Even industrial food – the standardised, quality-controlled products from major chains – varies considerably. These foods are standardised – but not for composition but for taste, texture and mouthfeel.
This is not surprising – and every chef will agree.
Raw ingredients vary by season, soil, animal feed and storage. To maintain consistent flavour and texture, seasoning must adapt. In bread, sauces and sausages, salt affects structure and water-holding capacity. When ingredients behave differently, salt levels need adjustment. In fermented foods – bread, cheese, cultured products – salt controls microbial activity when flour or milk quality changes. That is one reason why it is difficult to reduce the salt content of bread.
Salt, sugar and many other ingredients (including additives) are not added because it is fun to do so – they are added because they have a very specific purpose.
Much like apples from the self-same tree differ in composition, processed foods vary considerably. The skilled baker or food technologist adjusts the recipe accordingly.
If labels are so unreliable, are they useful at all? That is the important question, especially as they can have a negative effect on people with eating disorders.
They probably are, because they can help consumers make better choices and – in turn – companies to reformulate food. If consumers consistently choose lower fat or lower carb foods, companies will adapt, because they want to sell their product.
But it is important to keep in mind the limitations – and this is something missing from most (or all?) labels. They provide numbers that give the impression of precision, when in reality, they’re nothing more than an educated guess.
There is no easy answer. It is obviously not possible to analyse all foods – it’s not just too expensive, but it would not be feasible as food analyses take time. And it is not needed, food labels are perfectly fine as long as they interpreted correctly.
That is why I actually like the UK’s traffic light system where low, medium and high are based on bands. Admittedly, they are also somewhat arbitrary and there will be at some uncertainty, but in combination with the figures added to the labels, it makes it easy to compare products.
The traffic light label provide enough information for consumers to make an informed decision. In contrast, Nutri-Score does not provide any information about actual food composition.
The final score is based on a complicated algorithm which includes a range of factors. Each 200 mg of salt gives one point - the chicken dish in our study could get anything from +5 to +10 points depending on the actual salt content, moving the food from category C to D or E. A consumer comparing two products might choose based on scores that don't reflect the actual nutritional difference between them. That means that in reality, a food might have a much better – or worse – score than is shown on the label.
And this problem extends far beyond consumer labelling.
Unreliable food composition data is one of the big problems of nutrition research:
Relevant, reliable and up-to-date food composition data are of fundamental importance in nutrition, dietetics and health, but also for other disciplines such as food science, biodiversity, plant breeding, food industry, trade, and food regulation.
Food composition data are the foundation on which nutrition research – and nutrition practice – rests. If these foundations are shaky, it raises many uncomfortable questions. And these are not just restricted to additives or so-called ultra-processed foods, but many other aspects of nutrition too.
This salt study highlights this very well: if we do not even have reliable data on the salt content of often very standardised foods, how can we make confident claims about nutrition and health based exclusively on food content data?
Unfortunately, a lot of public health nutrition proceeds as if measurement error does not exist. Activists declare confidently that specific foods or food categories cause harm based on observational studies riddled with measurement problems. When methodological limitations are raised, they are too often dismissed instead of addressed.
The problem is: poor methods lead to weak evidence, which leads to poorly targeted interventions, which erode public trust when they fail to deliver promised benefits. If we want nutrition science that actually improves health outcomes, we need to build on solid methodological ground, not convenient fictions about food composition.
No posts
Comments
Nothing yet. Say the first thing.
Sign in to join the conversation.