
This week, Always On Energy Research and the Institute for Energy Research published the remaining profiles for our Blue States, High Rates interactive website. Thanks to the tireless efforts of Sarah Montalbano, the site now contains energy policy profiles for all 50 states, Washington, D.C., and 10 regional summaries.
Writing 61 profiles was a heavy lift, and we hope you’ll enjoy exploring the website. In this edition of Energy Bad Boys, we share seven of the most surprising and interesting findings we made while writing the profiles.
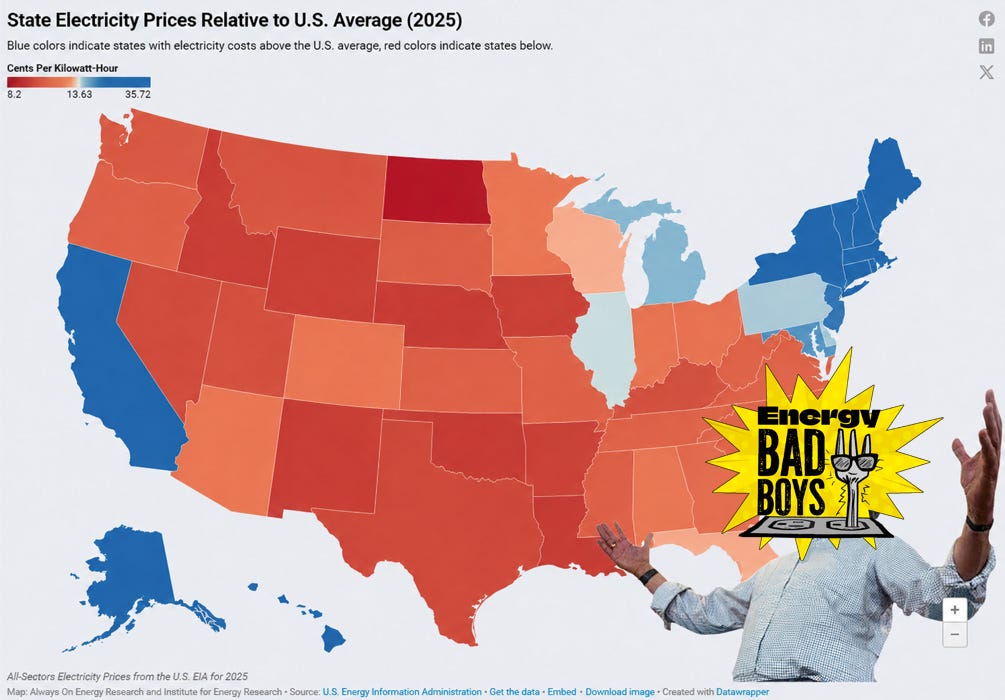
Our analysis found that Blue states, on average, have much higher rates than Red states. What’s interesting is the gap between Red-state and Blue-state prices has widened over time, suggesting that the energy policies enacted by these states are driving up costs.
For example, in 2011, average all-sector electricity prices in Blue states were about 3.6 cents per kilowatt-hour (kWh) higher than in Red states, or 44 percent higher. By 2025, Blue state electricity prices were 6.33 cents per kWh higher than those in Red states, a 61 percent difference.
For a more recent frame of reference, we found Red states have seen their electricity prices rise by 2 cents per kWh, or 22 percent, since 2018. Blue states saw their prices balloon by 5.5 cents per kWh, a 43 percent increase, with much of the increase occurring after 2022.
You can explore these rate trends for your state and compare how they stack up to others using the companion Blue States, High Rates data dashboard we are building to complement our state profiles.
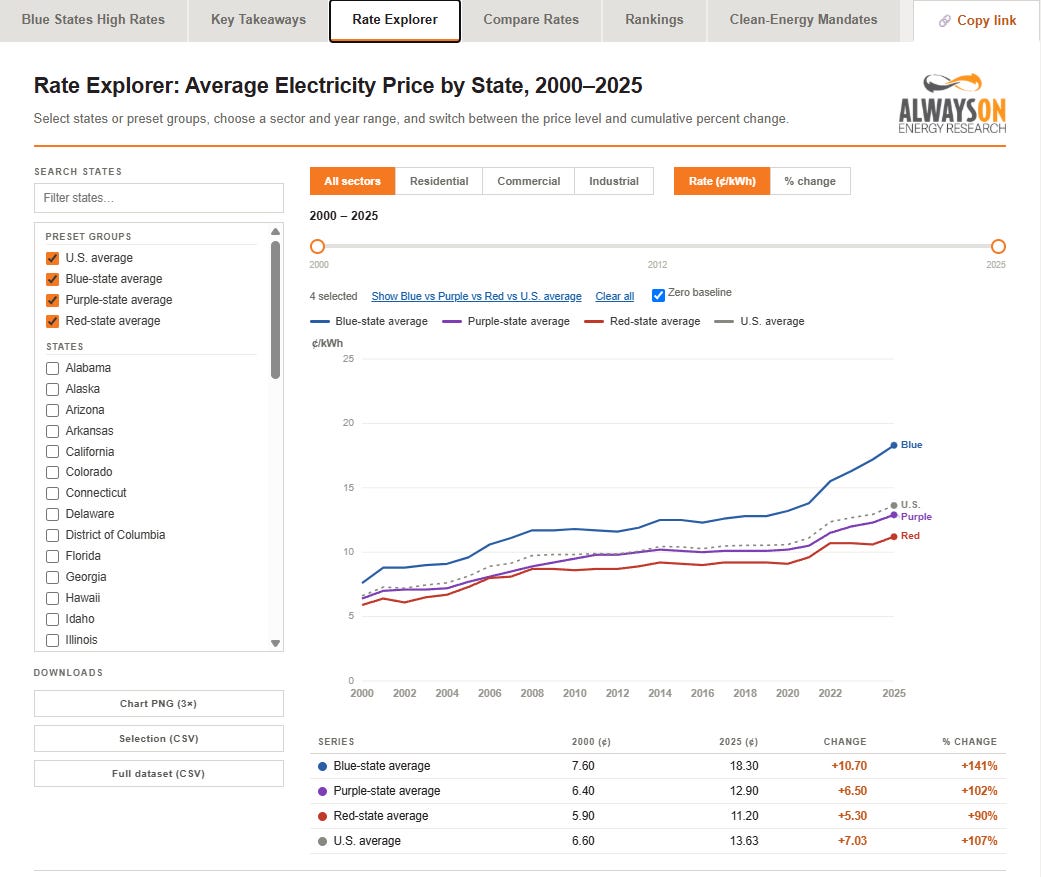
If the differences in rates were driven primarily by regional or geographic factors, we would expect the cost difference between red and blue states to remain fairly constant over time because geography doesn’t change.
The faster acceleration in electricity prices in Blue states than in Red states suggests the differences are due to policies enacted in those jurisdictions.
A major driver of this widening gap is the explosion in electricity prices in some of the country’s most notorious blue-state policy regions, such as New England and California.
California, specifically, has become a poster child for the ballooning costs of an electric grid that is increasingly reliant on wind, solar, and battery storage, while also mismanaging its forests for decades with similarly horrible environmental policies. As noted in the Blue States High Rates profile, with California being the first adopter of many of the worst blue state policies, it “is showing the rest of the U.S. where those mandates lead.” New England, on the other hand, has shown what happens when a region becomes irrationally hostile to building new natural gas infrastructure.
The evidence is hard to ignore. Since 2011, electricity prices in New England and California have increased nearly 4 times faster than the national average excluding them. As you can see, California and New England rates have increased by a combined 90 percent—compared to just 23 percent in the rest of the U.S. (excluding California and New England).
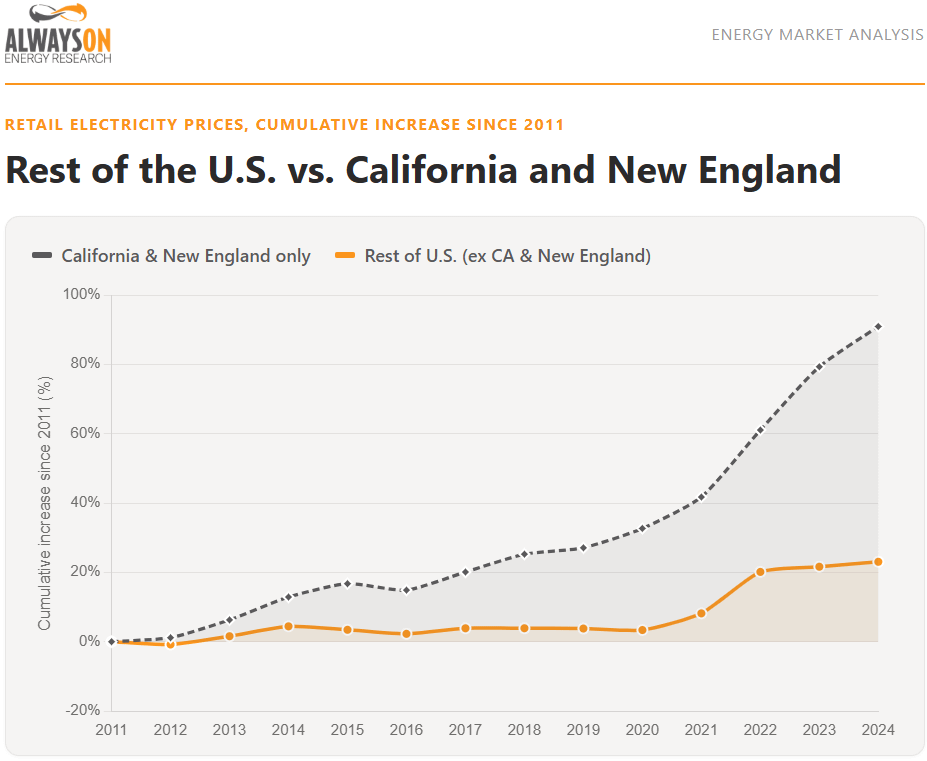
Also notice that prices rose in CA and New England from 2011 to 2020, while the rest of the country remained fairly flat. In fact, by 2018, price increases in the two regions already surpassed the national increase through 2024. Recent inflationary pressures have certainly added fuel to the fire, but they only accelerated a trend that was already well underway.
Adjusting for inflation makes the trend even clearer. California and New England collectively increased by nearly 40 percent since 2011, compared to a 12 percent drop for the country as a whole, minus CA and New England.
Pennsylvania’s Alternative Energy Portfolio Standard (AEPS) (Act 213 of 2004) requires 18 percent of electricity sold to retail customers to come from alternative sources by 2021. The AEPS requires 8 percent to come from Tier 1 sources, including solar PV, wind, low-impact hydro, geothermal, biomass, and 10 percent from Tier II, including waste coal, large-scale hydro, demand-side management, integrated gasification combined-cycle coal, and municipal solid waste.
According to research from the Commonwealth Foundation, AEPS compliance costs rose modestly as the mandate phased in toward 18 percent through 2020. Act 114 of 2020 changed the trajectory by restricting Tier II compliance to Pennsylvania-sited generation. The law left the 10 percent Tier II requirement unchanged, forcing the same mandated demand onto a smaller pool of eligible suppliers. The Tier II credit price rose fourteenfold in five years.[18] Tier I credit prices have risen sharply as well, with non-solar Tier I prices increasing 176 percent from 2021 to 2025. Total compliance costs rose from $122.5 million in RY2020 to over $700 million annually in RY2024 and RY2025.
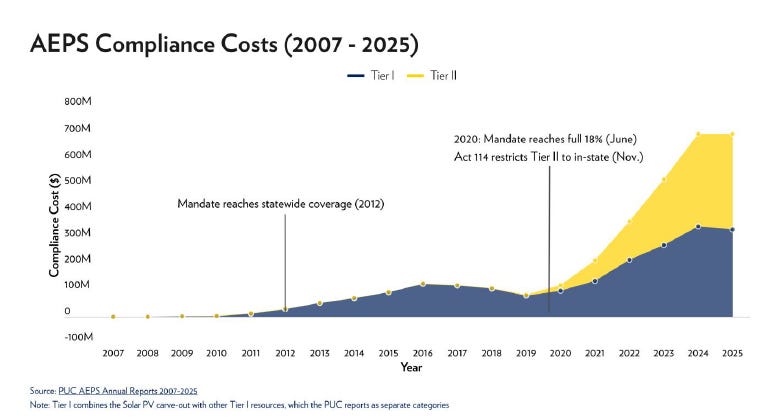
Pennsylvania sold 143.3 million megawatt-hours (MWh) of electricity in 2025 for $20.22 billion, translating into a rate of 14.11 cents per kilowatt-hour (kWh). Dividing the 2025 compliance cost of the AEPS by the MWhs sold, we concluded that eliminating the program could shave 0.49 cents per kWh off the cost of electricity in Pennsylvania, or 3.5 percent of the total cost of power.
Eliminating the AEPS would save Pennsylvania customers approximately $50 per year. If ever there was an easy affordability win on the table for policymakers, repealing the AEPS seems like low-hanging fruit.
State-level electricity price data provide a solid overview of high-level trends across the country. Individual utility data, however, is where things get really interesting. Using EIA Form 861 data, we examined data for specific utilities to identify trends that state-level data do not always capture.
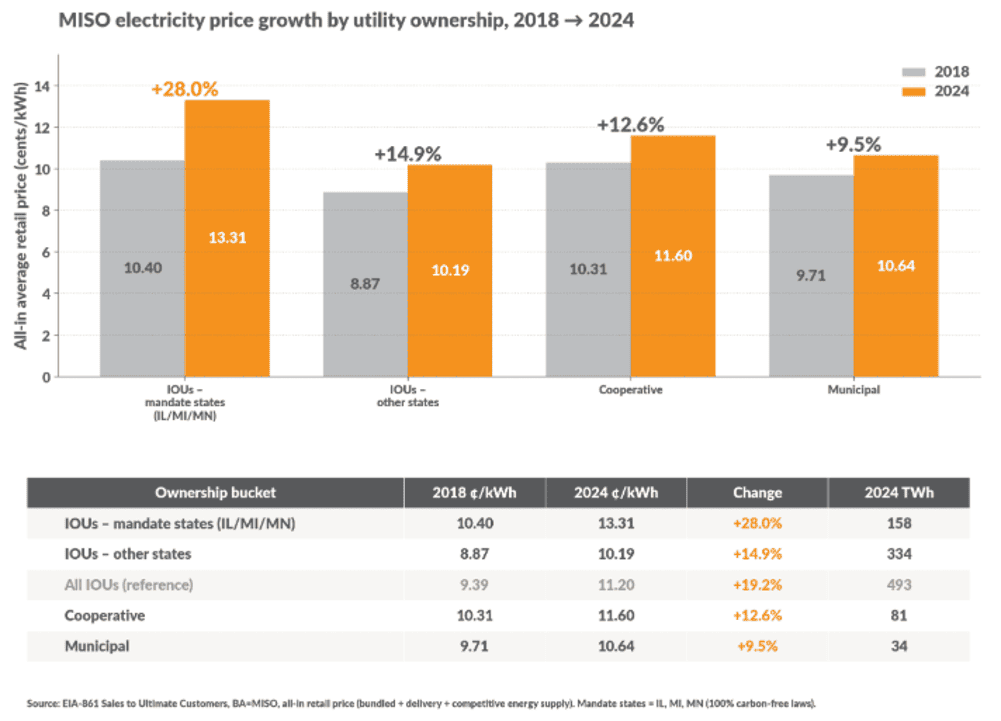
For example, while writing the profile for the Midcontinent Independent System Operator (MISO), we discovered that Investor-Owned Utilities (IOUs) in states with 100 percent carbon-free mandates (Illinois, Michigan, and Minnesota) saw their prices increase by 28 percent from 2018 to 2024. In contrast, IOUs in non-mandate states only rose by 14.9 percent.
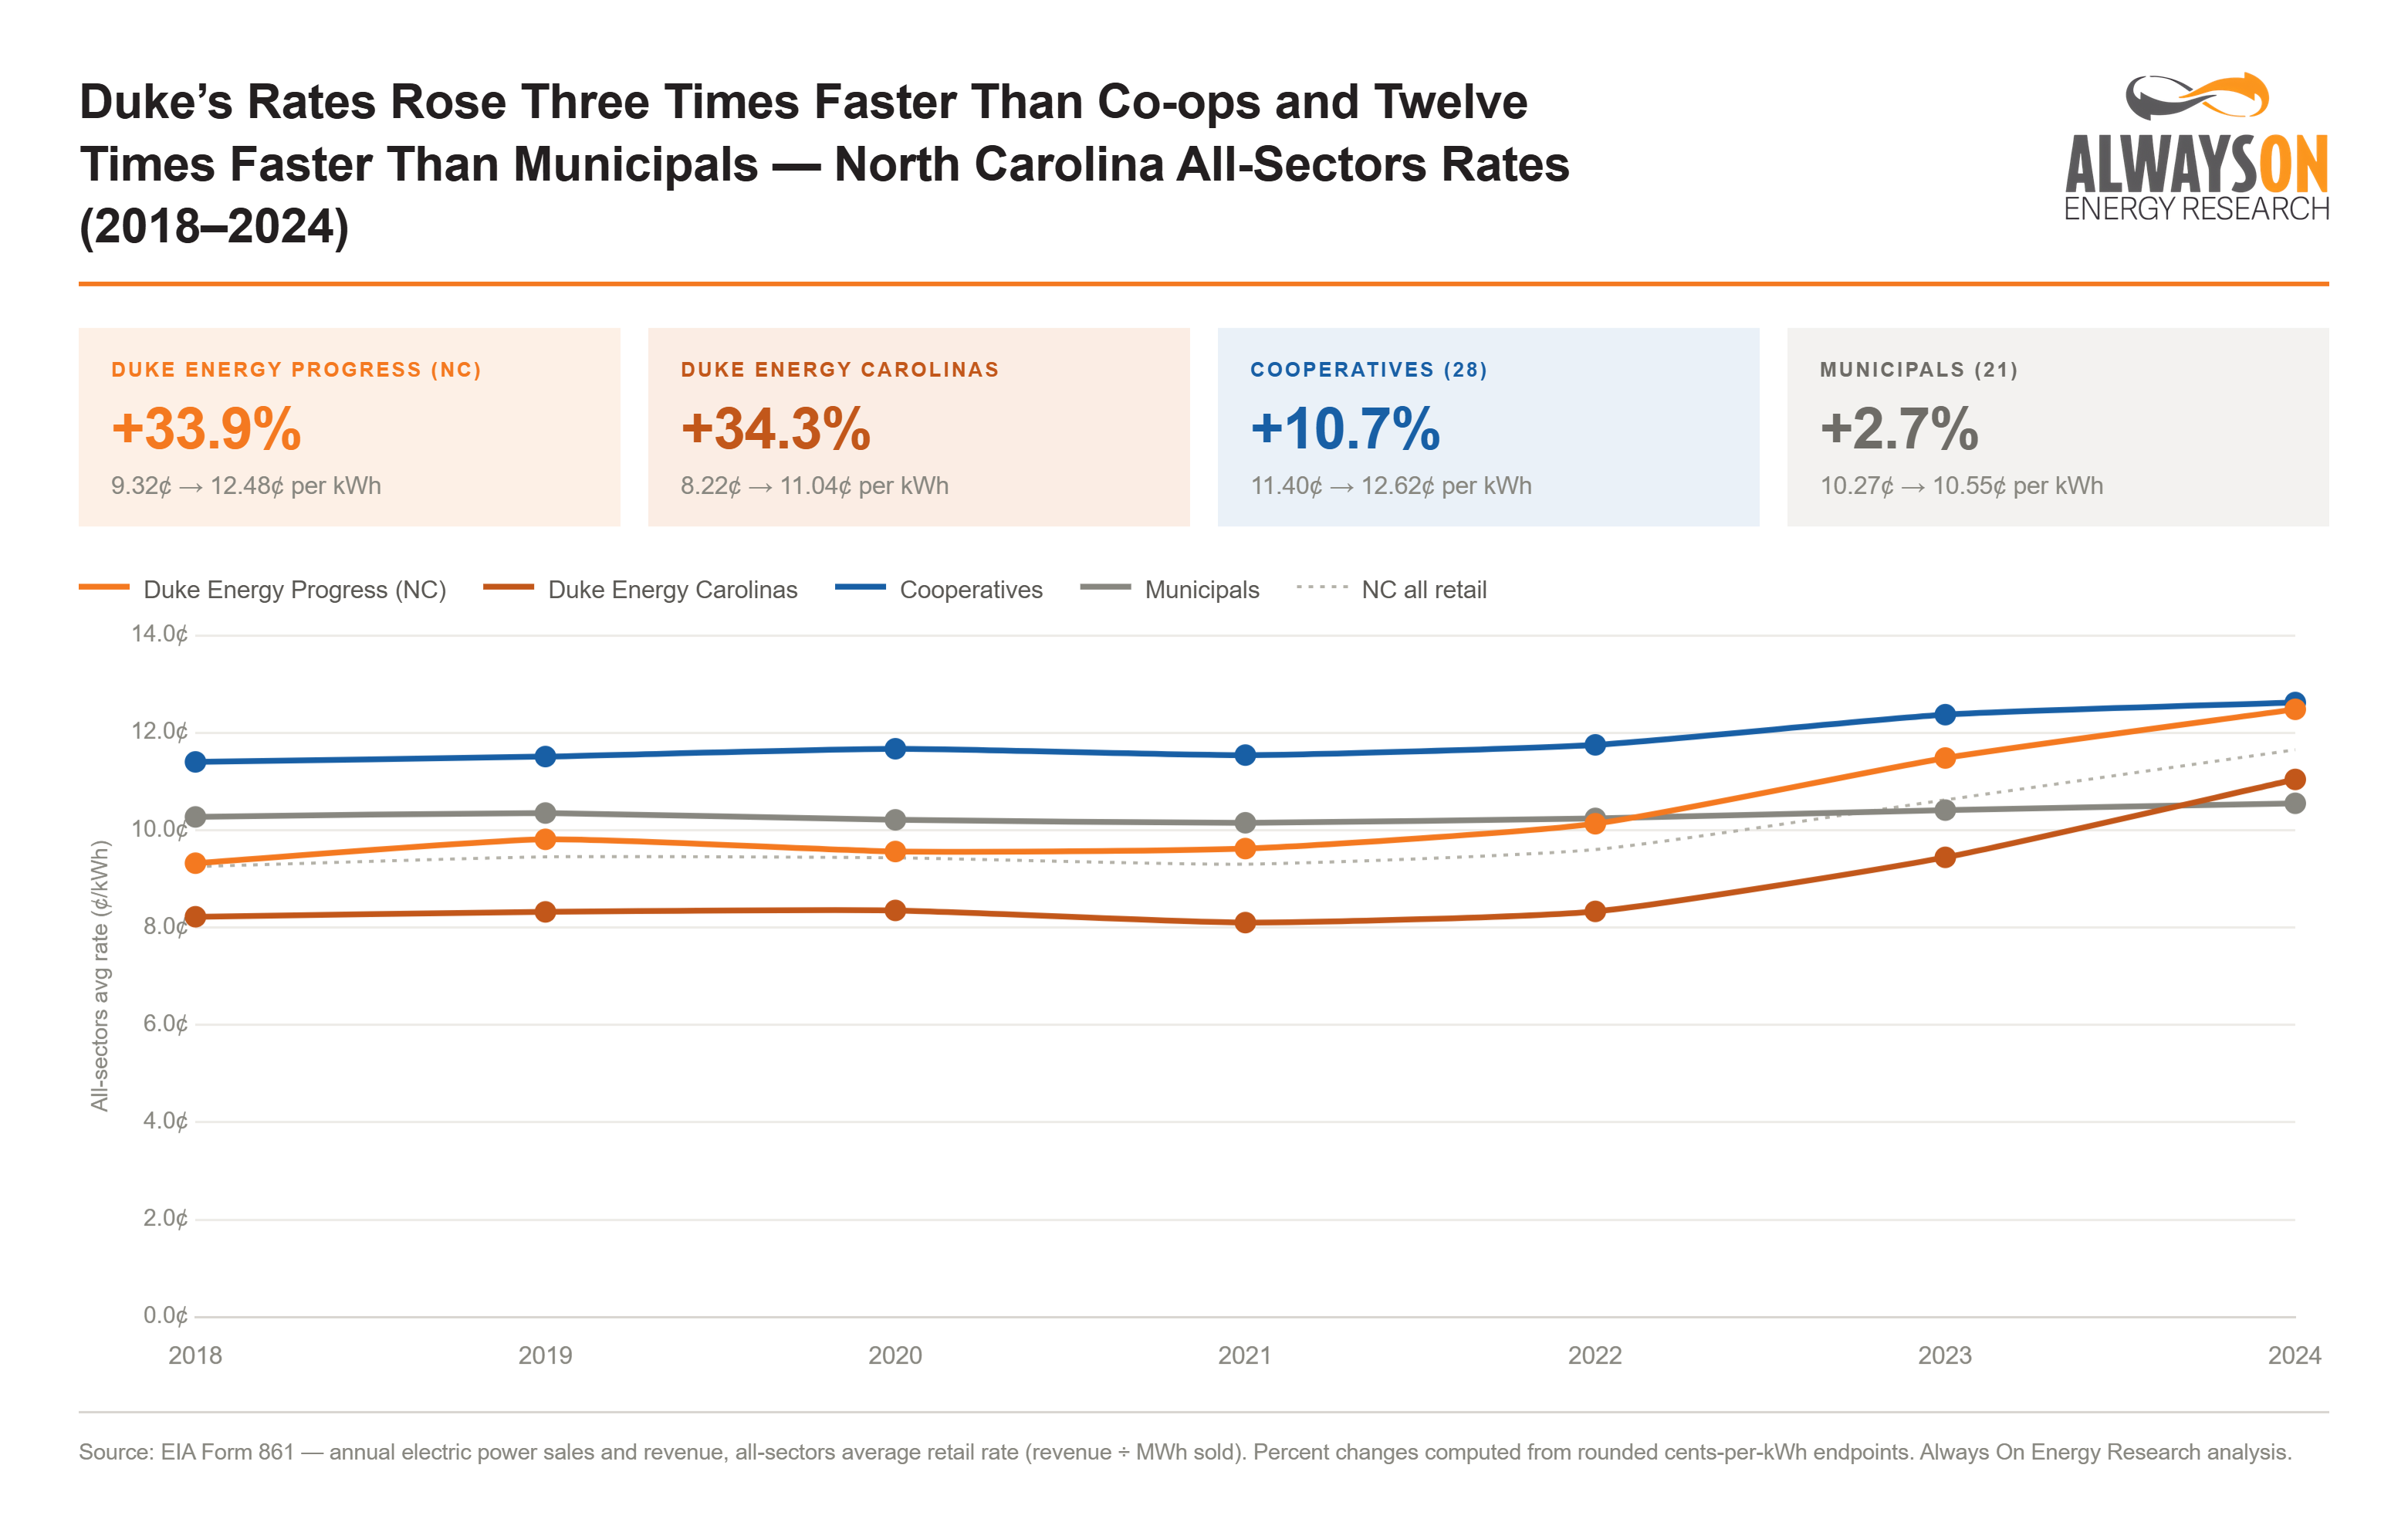
This trend was also apparent in North Carolina, where Duke Energy subsidiaries are subject to carbon-free electricity by 2050 mandates, but co-ops and municipal utilities are not. As you can see, Duke Energy’s price advantage is quickly evaporating—especially for Duke Energy Progress, which has increased by nearly 34 percent since 2018 and is now on par with the cost of cooperatives.
These findings aren’t surprising, as these states are mandating massive investments of ratepayer money in wind, solar, and battery storage projects that will cause rates to necessarily skyrocket.
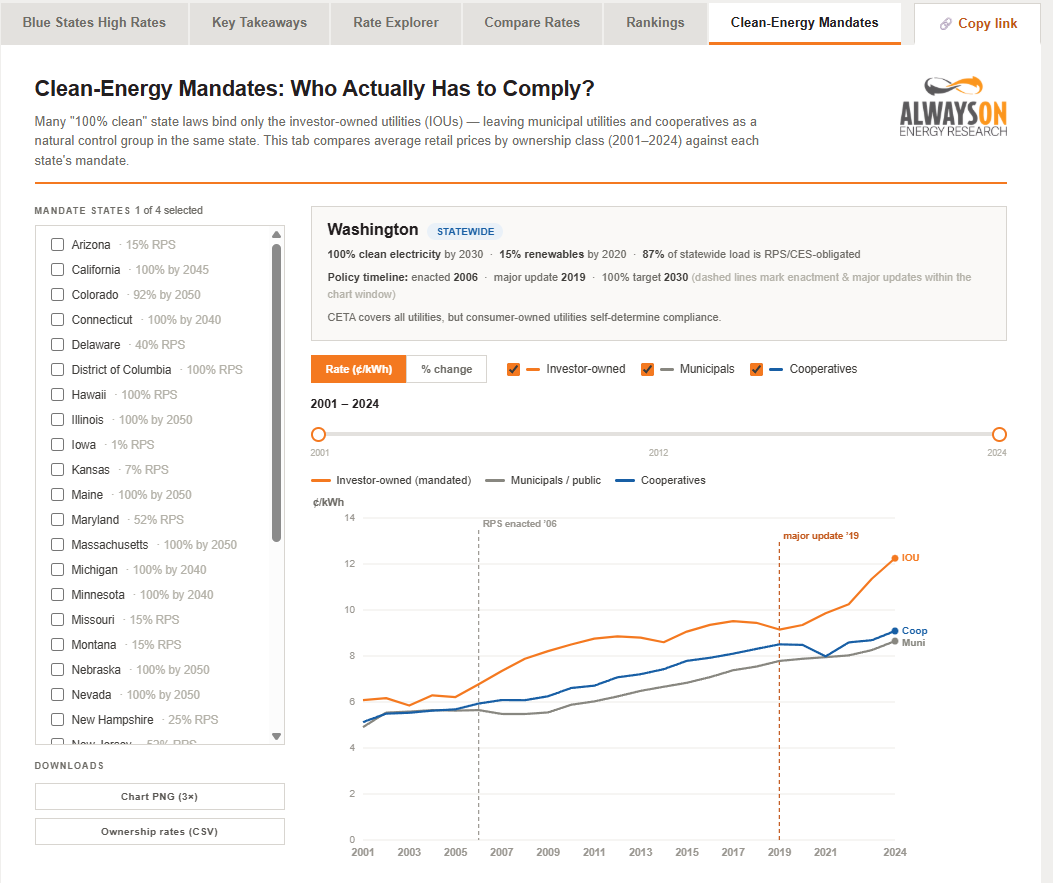
Furthermore, many states have higher RPS compliance targets for IOUs than co-ops or municipalities, so it makes sense prices would increase faster for utilities with more stringent wind and solar mandates. You can check out these trends for your state on the Clean-Energy Mandates tab in the dashboard.
When the history books are written, these policies will likely be remembered as some of the largest government-mandated malinvestments of all time.
Southwest Power Pool is an interesting case because the Regional Transmission Organization (RTO) covered only small portions of states with aggressive carbon-free mandates (Minnesota and New Mexico) in 2024, the most recent year for which utility-level data are available.
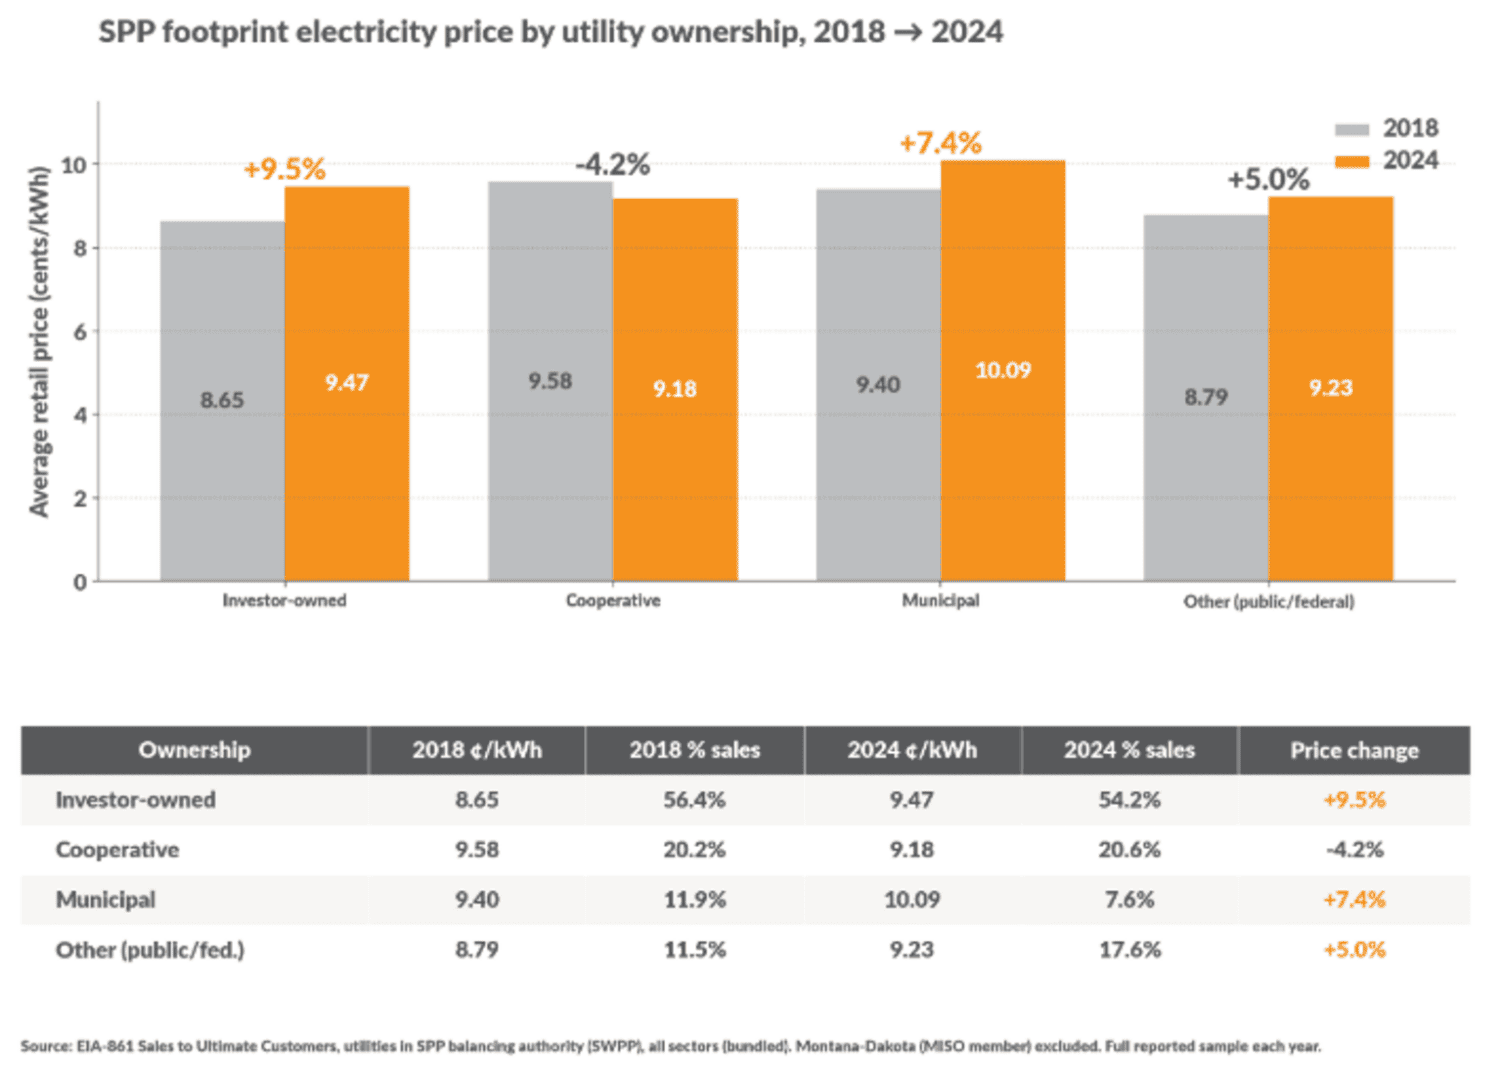
Still, IOUs in SPP experienced a 9.5 percent increase in electricity prices from 2018 to 2024, while municipal utilities rose only 7.4 percent. In contrast, rural electric cooperatives in SPP actually experienced a rate decrease during this time period, falling by 4.2 percent, shown in the graph below.
Because most states in SPP have modest renewable energy mandates, changing resource portfolios are increasingly driven by voluntary carbon-reduction goals set by investor-owned utilities (IOUs) serving retail load across the SPP footprint.
Data compiled by the Smart Electric Power Alliance show every IOU in SPP’s pre-2026 footprint has adopted a voluntary carbon-reduction goal.6 Nine of the ten IOUs are subsidiaries of parent companies with net-zero or carbon-free targets, while Oklahoma Gas & Electric has committed to reducing carbon emissions from electric generation by 50% from 2005 levels by 2030.
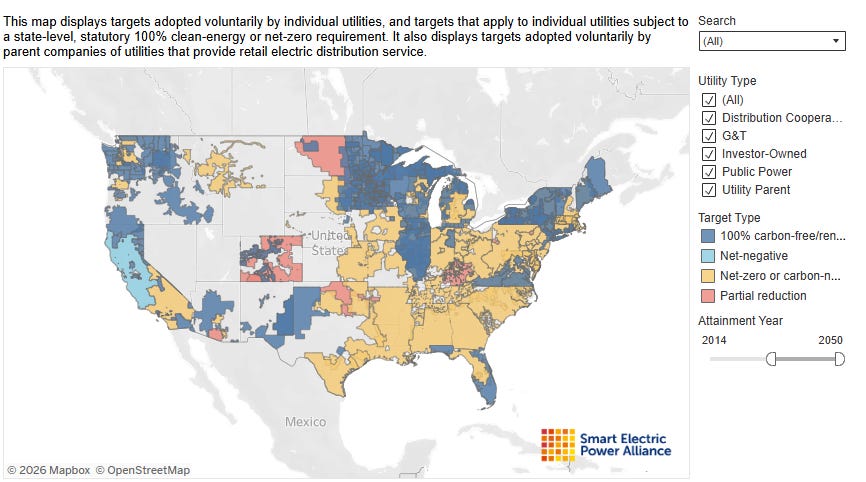
These carbon-reduction goals, in addition to the fact that some of the modest RPS requirements in SPP states exempt municipal utilities and co-ops, likely factor into IOUs in SPP raising their prices more than co-ops and municipal utilities since 2018.
We strongly suspect that the negative rate trend for co-ops in SPP is driven by oil production in North Dakota, which has caused a surge in demand and allowed these utilities to spread their fixed costs over more megawatt-hours (MWhs) of generation. We will look into that possibility in greater detail in a future EBB article.
Some people have tried to counter “blue states high rates” by pointing to high wind penetration in Iowa and North Dakota coupled with low electricity prices as evidence that these energy sources don’t drive up costs.
The only problem with this argument is that wind presence in ND and IA isn’t driven by state policies. Instead, they are largely built to soak up federal subsidies for wind and solar and to serve blue-state policies in neighboring states.
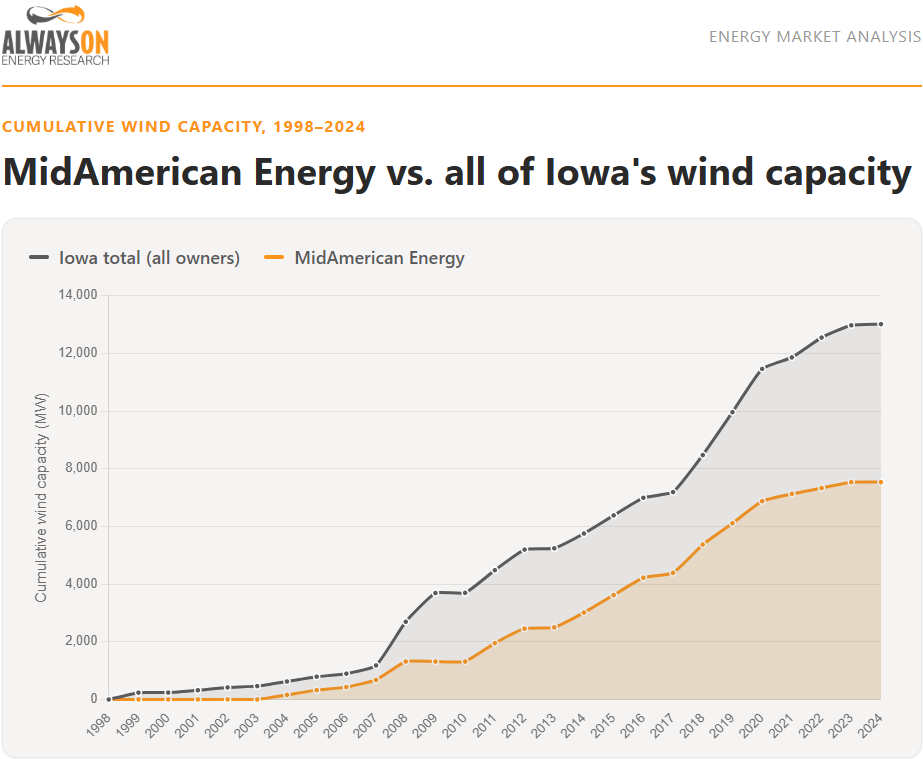
Warren Buffett—the former CEO of Berkshire Hathaway, which owned MidAmerican Energy Co. and is the largest owner of wind farms in Iowa—famously stated this relationship directly in 2014, noting that “on wind energy, we get a tax credit if we build a lot of wind farms. That’s the only reason to build them. They don’t make sense without the tax credit.” In 2012, he said, “I don't think any of our projects would make sense without that subsidy.” As late as 2017, he clarified that the “market system wouldn’t do it” without subsidization.
And as you can see, MidAmerican is responsible for over half of the state’s wind resources—and the rest are just as much dependent on federal subsidies as MidAmerican’s fleet.
It’s helpful to note that ND and IA have some of the best wind resources in the country—meaning if they only make sense with subsidies here, they only make sense with subsidies everywhere.
So what’s really responsible for the affordable rates in North Dakota and Iowa? For one, they avoid the blue-state policies that drive up electricity prices in the states that endorse them.
The profiles for North Dakota and Iowa show clearly that these states do not mess around with other high-cost blue-state policies. For instance, they don’t have renewable or clean energy mandates or carbon pricing mechanisms. North Dakota’s net metering program is tied to the utilities' avoided cost and not retail rates, and Iowa is transitioning to the same policy starting in 2027.
North Dakota even passed an “Administrative rules adopted in 2023 affirmatively bar utilities from selecting resources based on carbon cost, greenhouse gas reduction goals, renewable standards, or ‘other externalities’ in their North Dakota preferred plans.” So while the state’s utilities may have corporate emissions targets, they are limited by this administrative rule.
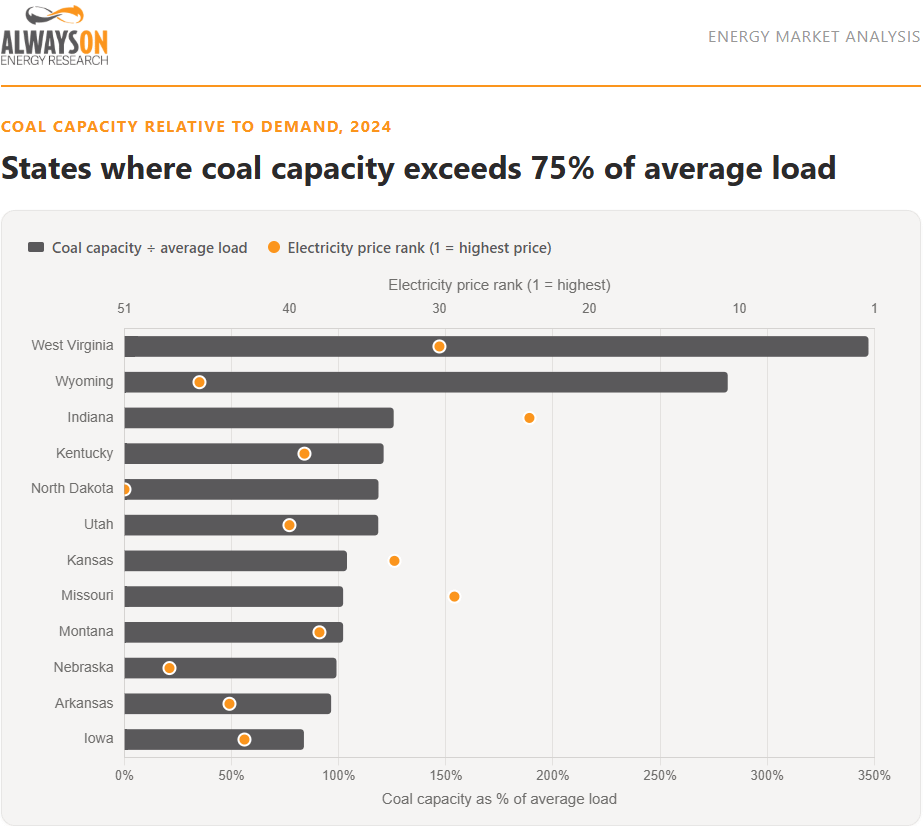
Furthermore, they are far more favorable to dispatchable and baseload generators like natural gas and coal. In fact, both Iowa and North Dakota are among the states where coal capacity exceeds 75 percent or more of the state’s daily average load. Unsurprisingly, all of these states are in the bottom half of electricity prices, except Indiana, which sits right on the edge at 24.
As affordability pressures have mounted, Blue state climate policies have come under scrutiny. Over the last 18 months, some of the bluest states in the country have walked back their climate policies.
In June 2025, Connecticut became the first New England state to walk back a major renewable mandate with Substitute Senate Bill (SSB) 4. SSB 4 lowered the renewable energy procurement target from 40 percent to 29 percent for 2030, and from 32 percent to 25 percent for 2026. These reforms are expected to save approximately $60 million per year starting in 2026, helping lower residential electric bills by around 14 percent.
In the 2026 legislative session, New York Governor Kathy Hochul (D) introduced a proposal to loosen the timeline for the Community Protection Act (CLCPA) of 2019, which requires 70 percent of statewide electric generation from renewables by 2030 and zero emissions from the statewide electrical system by 2040.
After negotiations, the legislature agreed to loosen the law’s emissions accounting process and replace the binding 2030 obligation with a 2040 target of 60 percent reductions to the “maximum extent feasible and cost-effective.”
In North Carolina, Senate Bill (S.B.) 266, which passed in 2025 over Gov. Josh Stein’s (D) veto. S.B. 266 removed the interim goal of reducing emissions by 70 percent below 2005 levels by 2030, amid concerns that the interim targets would increase electricity prices. An analysis performed by North Carolina Public Staff found that eliminating the interim target would avoid $13 billion in costs ultimately passed on to customers. The 2050 carbon-neutrality requirement remains in place, for now.
Renewable Portfolio Standards in the bluest states are unlikely to go out with a bang, but they may slowly whimper away as timelines are delayed, accounting mechanisms are massaged, and resources like nuclear are allowed to qualify.
In total, our analysis found six Blue states (Colorado, Minnesota, New Mexico, Oregon, Virginia, and Washington) with electricity rates below the national average. These states are fascinating, and we will almost certainly do a deep dive on them in the future.
We believe the fifty states represent a laboratory of energy democracy. The Federal Power Act reserved broad powers for the states to set their own electricity policies, producing a natural experiment in which policy choices compound over time.
If our thesis is correct, we expect that the affordability gap between Red states and Blue states will widen over time, unless, of course, Blue state policymakers continue backtracking on their climate commitments to keep prices in check.
Please like, share, and subscribe, or we’ll raise your electric rates.

Dash to gas — Why this natural gas build cycle will be slower, costlier and more inflationary for power prices by Cobank: Surging demand and high turbine costs will make this round of natural gas capacity expansion more expensive than previous gas buildouts.
Comments
Nothing yet. Say the first thing.
Sign in to join the conversation.