
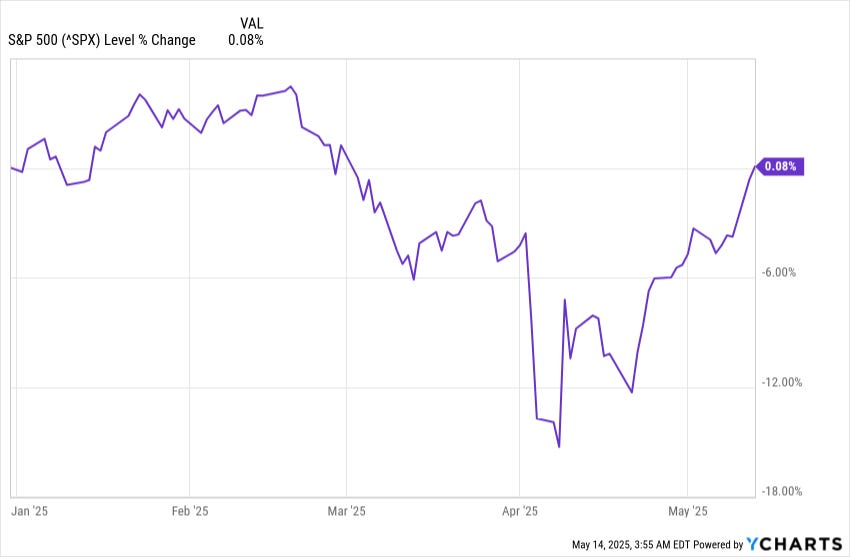
After falling nearly 16% in the aftermath of the tariff announcements, the S&P 500 is back to flat on the year - talk about a whole lot of drama amounting to nothing! Feels like one of my exes.
Since WWII, this was only the ninth time that the index lost more than 10% and was able to climb out of the hole before year’s end. It is also the fifth time that the decline was over 15%. The four other instances were in 1970, 1982, 2009, and 2020, all of which were recession years.
The good news is that for all nine prior instances where the index lost 10% or more, it was higher twelve months later, with an average gain of 20.4% and a median of 17.1%.
The only way to understand what is happening geopolitically these days is by reading President Trump’s “The Art of the Deal.” The game is all about creating a crisis, then leveraging the ensuing anxiety and confusion to extract concessions from your counterparty. This is like nothing we’ve ever seen in America’s foreign relations, and to be perfectly honest, I have no idea if 10 years from now we will look back on it as genius or insanity, maybe a bit of both?
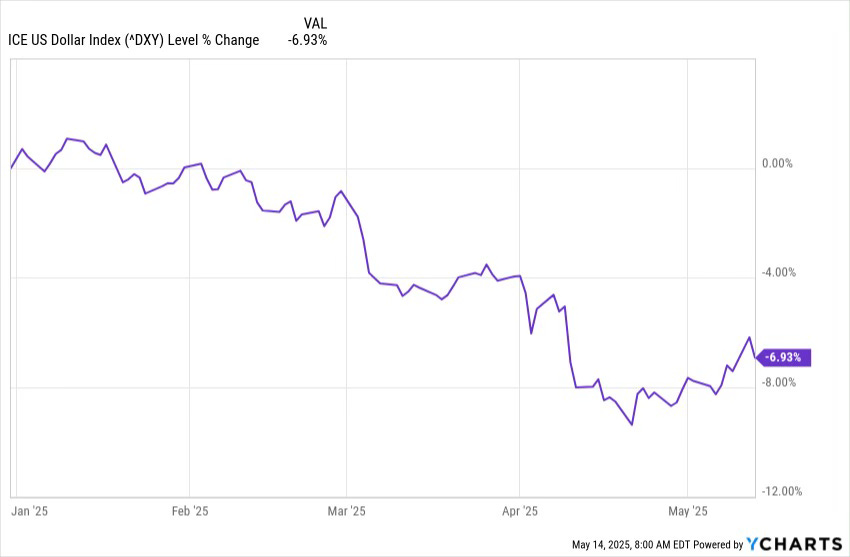
The dollar, as measured by the US Dollar Index (DXY), remains depressed, not Prozac levels, but it was an unusually rapid decline for the world’s reserve currency. At one point, the DXY was down 9.5% from its January high. Monday, it closed down by -7.9%.
This is particularly noteworthy in light of the European Central Bank’s rate cutting. When rates get cut, all things being equal, demand for that currency ought to decline, which would mean the US dollar would strengthen, at least with respect to the euro, and that’s a meaningful component of the DXY. Instead, the ECB is cutting rates, and the dollar weakens. ECB head Christine Lagarde might want to send Trump a muffin basket.
On Monday, the VIX dropped below 20 and its 200-day moving average, marking the quickest return to sub-20 levels after breaching 50 on record. The only other times the VIX rose above 50 for the first time in years were in 2008 and 2020.
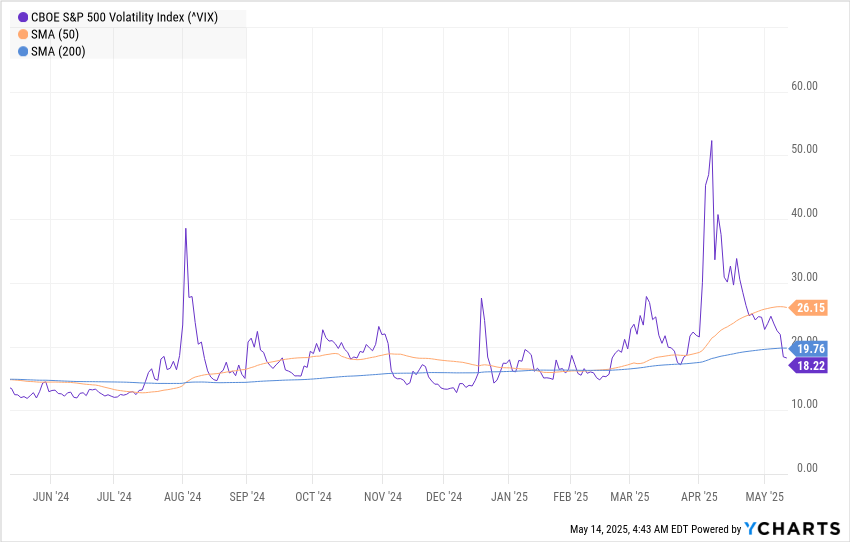
On October 6, 2008, the VIX closed at 52.1, and it took 306 trading days to drop below 20, which it did on December 22, 2009. A year later, on December 22, 2010, the S&P 500 had gained 12.6%.
On March 9, 2020, the VIX closed at 54.5 and didn’t drop below 20 until February 12, 2021, 236 trading days later. A year later, on February 12, 2022, the S&P 500 had gained 12.3%.
Similarly, if we examine previous periods in which the VIX closed below 40 for the first time and then consider how many trading days it took to close below 20, yesterday marked yet another record-breaking crash in volatility, occurring just 21 days after it closed below 40. The previous periods in which the VIX dropped below 40, then to under 20, were in 2010, 2011/12, 2015, and 2020/21, which took (respectively) 98, 73, 29, and 73 trading days. In each instance, the market was in positive territory 12 months later, up 2.6%, 13.1%, 8.7%, and 12.3%, respectively.
The Federal Reserve published its latest Senior Loan Officer Opinion Survey on Tuesday, which is a quarterly survey of up to 8 major domestic banks and 24 smaller branches, providing insights into bank lending practices and loan demand. This release showed tightened lending standards for the quarter that reversed most of the loosening observed in the second half of last year.
Part of this tightening was attributed to the significant increase in the spread between corporate yields and the 10-year Treasury yield. The report also found a net weakening of demand across loan types. Non-residential CRE and multifamily almost saw net positive demand, but consumer borrowing areas, such as credit cards, experienced weaker demand. For banks of all sizes, demand for commercial and industrial loans moved from a net increase to a net decrease quarter over quarter as lending standards tightened.
The NY Fed’s quarterly Household Debt & Credit report was also released Tuesday, and provides insight into the consumer debt. Total consumer credit rose by 0.93% QoQ to $18.2 trillion, driven by mortgage (the largest share of total debt) and home equity revolving credit. Student loan credit also increased, but credit card and auto loan balances decreased slightly. Compared to the same quarter last year, aggregate debt is up 2.9%, a significantly slower growth rate than the mid-to-high single-digit readings in 2022 and 2023.
Over 95% of all consumer loans are current, which is a healthy level in itself. However, this percentage has been declining for a few years, and the current level represents the highest share of noncurrent loans since March 2020. Last quarter was the largest QoQ increase in aggregate noncurrent loans since the financial crisis years. So while the absolute level is solid, the recent rate of change is concerning.
Part of the increase in non-current loans may be attributed to student loans. The temporary pause on payments initiated during the pandemic ended in September 2023, with a following one-year period during which missed payments were not reported to credit bureaus. That reporting pause ended in October 2024, so the first delinquencies are just now appearing. The percentage of student loans newly delinquent and seriously (90+ days) delinquent skyrocketed in Q1, but remains below the elevated levels of the 2010s.
On a more positive note, last week saw the second-strongest volume of applications for home purchase mortgages (not for refinancing) in the past year. While the absolute level of mortgage applications remains very low relative to historical norms, they are trending higher, which suggests the housing market freeze may be thawing. That said, we remain a long way from normal, and a large portion of the existing mortgages are far below current rates.
The markets are behaving as if this whole tariff tussle is in the rear-view mirror, but the current tariff structure (30% on US imports from China, and 10% on China’s imports from the US) is not viable for either side.
If these were the final levels, China would lose face as it would be perceived as unbalanced, with Trump besting Xi. On the other hand, Trump cannot return to pre-April levels, as that would mean losing face for him (not an option), and he looks to hold firm on a minimum of 10% on imports in general. That means a loss of consumer purchasing power that the markets are no longer pricing in.
There is also a long list of additional tariff policies waiting in the wings, including renegotiation of the USMCA (which Trump himself negotiated in his first term) with Canada and Mexico. This 90-day pause has also forced companies to purchase more than they usually would in advance of the tariffs, which means higher shipping costs, higher inventory levels, and accompanying lower relative cash balances. This results in less optimal inventory controls, leading to slimmer margins.
Comments
Nothing yet. Say the first thing.
Sign in to join the conversation.