
This weekly email has three parts: the Schedule of economic data for the following week, a Review of data for the previous week, and a brief Commentary on a current topic.
The key reports this coming week are June Existing Home Sales, and the May Trade Deficit.
----- Monday, July 6th -----
10:00 AM ET: the ISM Services Index for June.
----- Tuesday, July 7th -----
8:30 AM: U.S. International Trade in Goods and Services for May from the Census Bureau. The consensus is for a U.S. trade deficit of $78.8 billion from $55.9 billion in April.
----- Wednesday, Wednesday, July 8th -----
7:00 AM: The Mortgage Bankers Association (MBA) will release the results for the mortgage purchase applications index.
2:00 PM: FOMC Minutes, Meeting of June 16-17
----- Thursday, July 9th -----
8:30 AM: The initial weekly unemployment claims report will be released. The consensus is for initial claims to decrease to 210 thousand from 215 thousand last week.
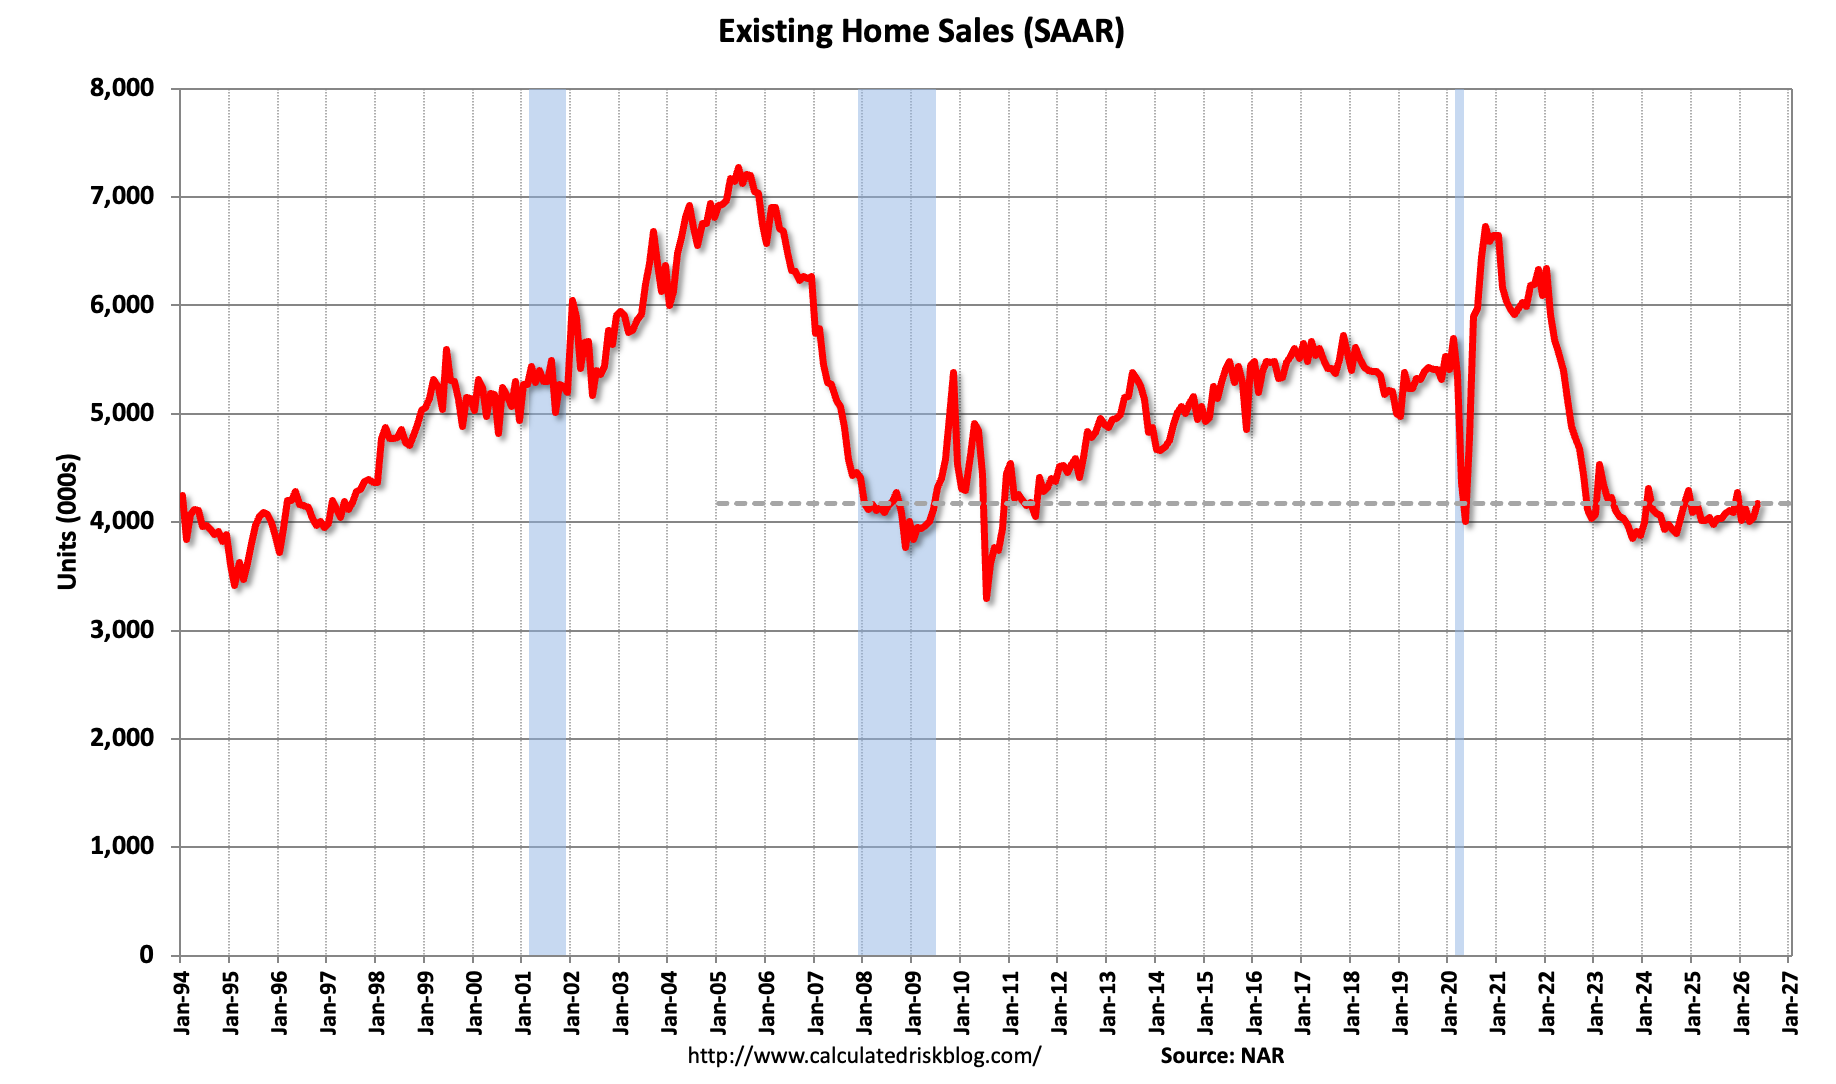
10:00 AM: Existing Home Sales for June from the National Association of Realtors (NAR). The consensus is for 4.20 million SAAR, up from 4.17 million in May. This graph shows existing home sales, on a Seasonally Adjusted Annual Rate (SAAR) basis since 1994.
----- Friday, July 10th -----
No major economic releases scheduled.
• Case-Shiller: National House Price Index Up 0.8% year-over-year in April
• FHFA’s Q1 National Mortgage Database: Outstanding Mortgage Rates, LTV and Credit Scores
• Freddie Mac House Price Index Increased in May; Up 1.9% Year-over-year
• Lawler: Update on the GSEs: MBS Holdings Decline, Interest Rate Risk Measures Keep Rising
• Fannie and Freddie: Single Family Delinquency Rate Mostly Unchanged in May
Economic data was mostly weak again last week.
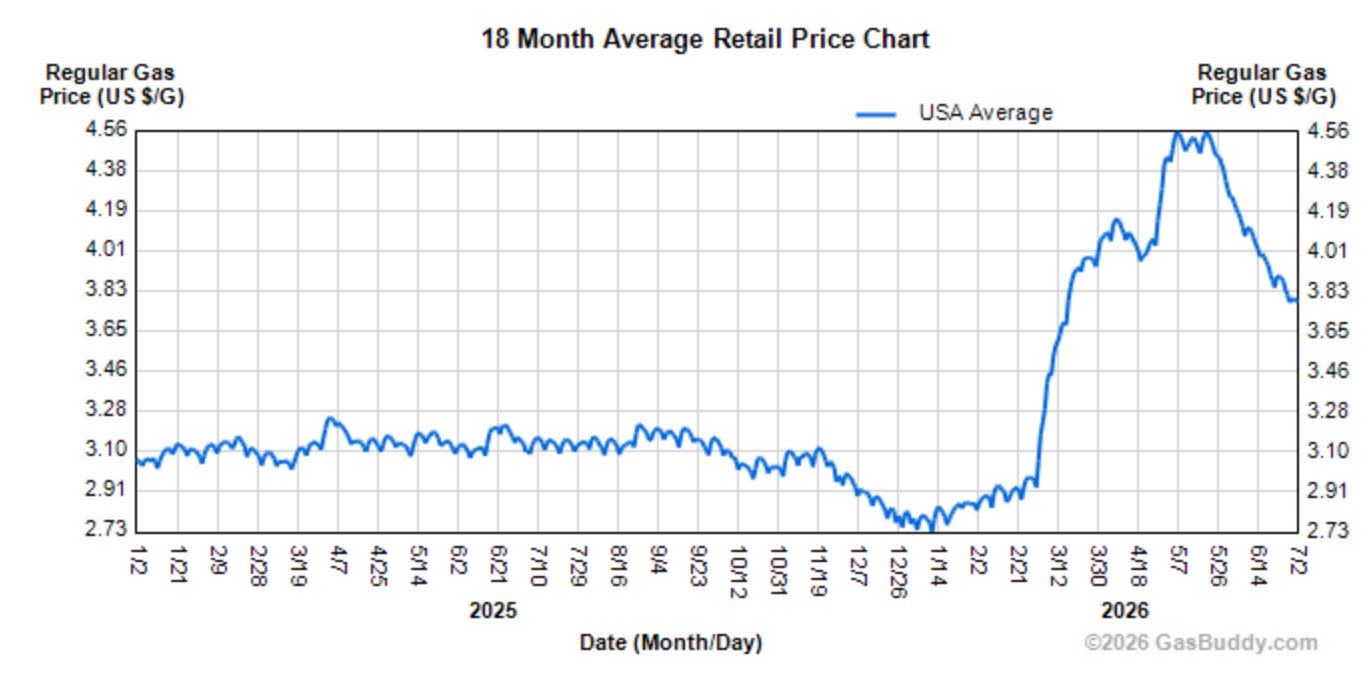
• Oil and Gas prices. WTI oil prices are at $69 per barrel as of this writing, down significantly with easing tensions, and up only 6% from late February. The national average gasoline price is $3.79 per gallon, down sharply from the recent peak of $4.56 per gallon, but up about 30% since late February. It takes time for lower oil prices to reach the pumps.
• Employment Report for June.
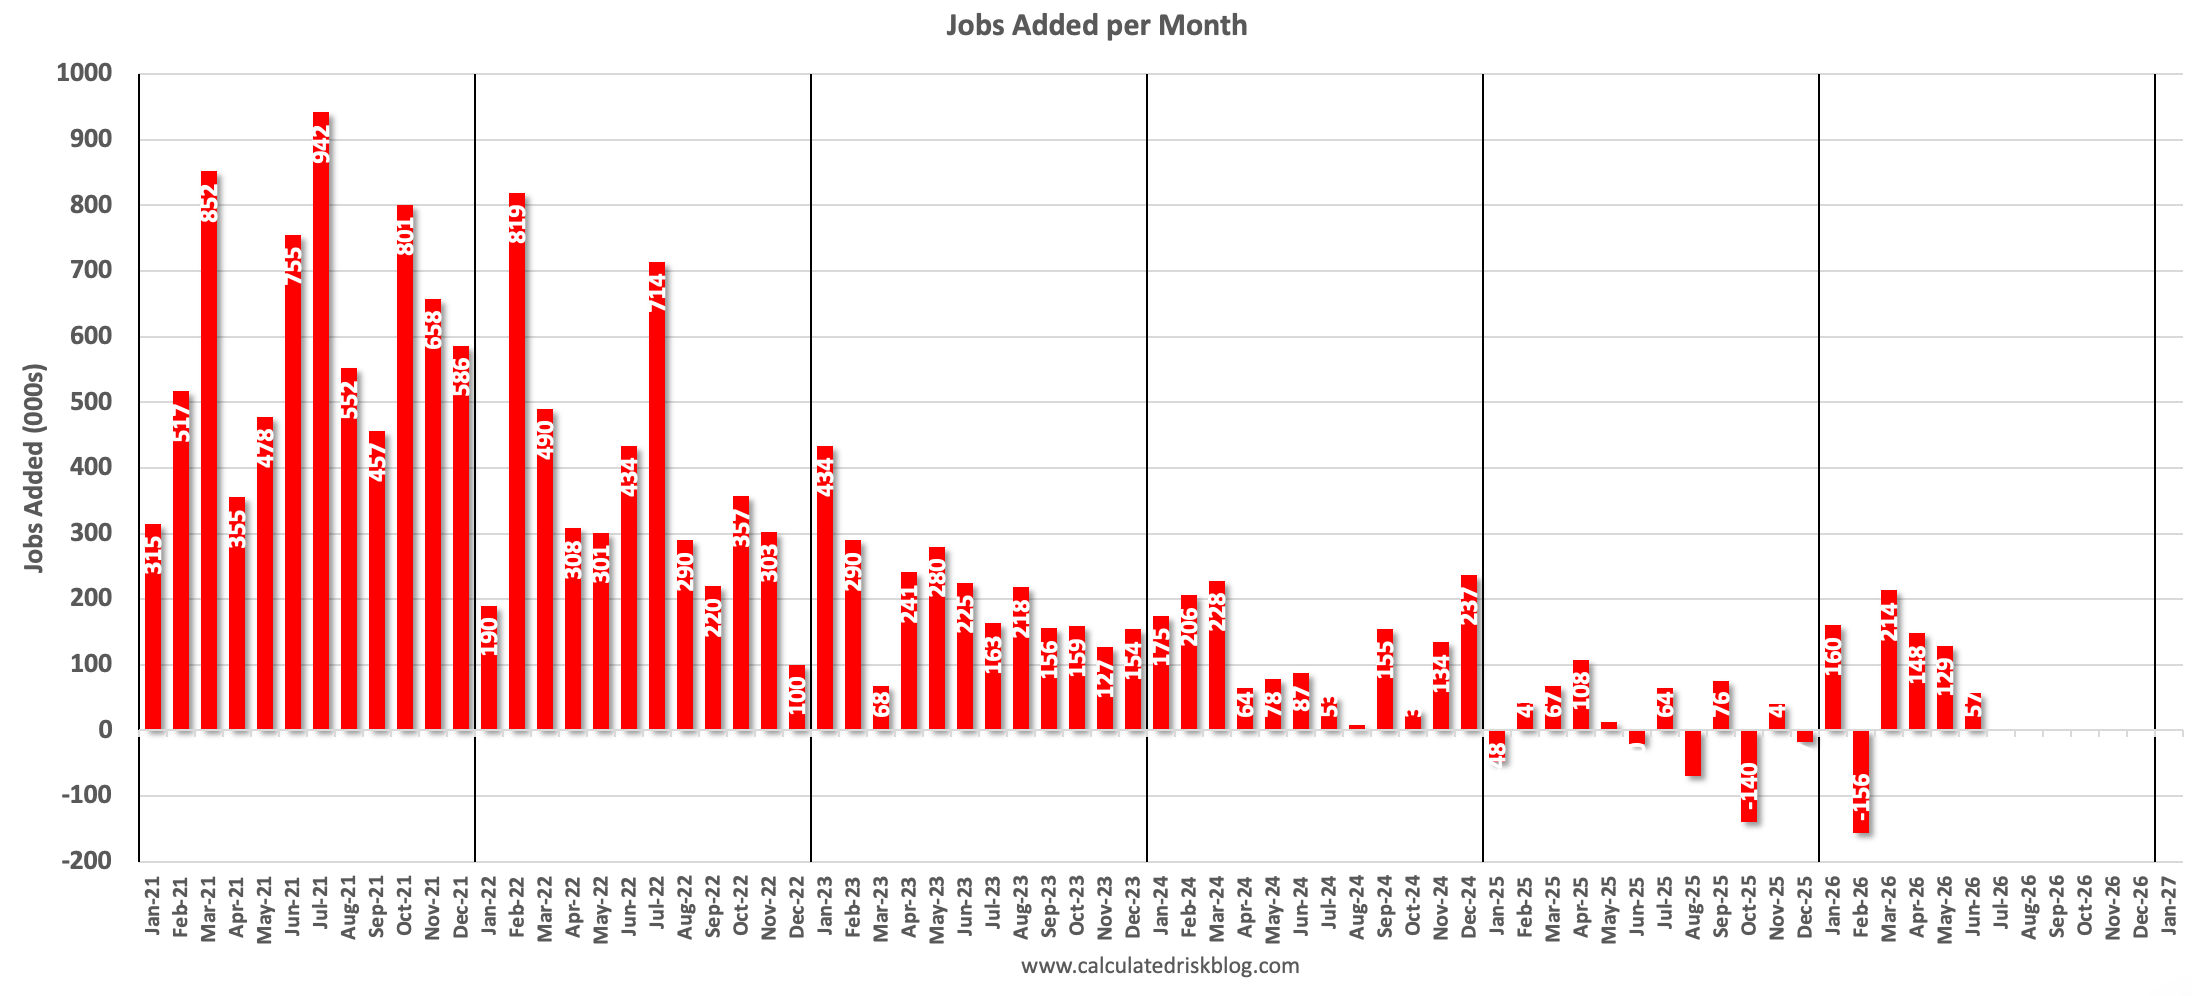
Both total nonfarm payroll employment (+57,000) and the unemployment rate (4.2 percent) changed little in June.
This was well below the consensus estimate and the previous two months were revised down sharply.
• Dallas Fed Survey of Manufacturing Activity for June.
Texas manufacturing output growth decelerated in June, according to business executives responding to the Texas Manufacturing Outlook Survey. The production index, a key measure of state manufacturing conditions, fell five points to 4.1, a reading suggestive of a below-average pace of output expansion.
This was below the consensus estimate.
• Chicago Purchasing Managers Index for June.
The Chicago Business BarometerTM, produced with MNI, cooled 6.0 points to 56.7 in June. The Barometer remained in expansionary territory for a second consecutive month.
This was below the consensus estimate.
• Job Openings and Labor Turnover Survey for May.
The number of job openings was unchanged at 7.6 million in May, the U.S. Bureau of Labor Statistics reported today. Hires were unchanged at 5.2 million, while total separations changed little at 5.1 million. Within separations, quits (3.1 million) changed little, while layoffs and discharges (1.7 million) were unchanged.
• The mortgage purchase applications index from the Mortgage Bankers Association (MBA).
The seasonally adjusted Purchase Index increased 1 percent from one week earlier. The unadjusted Purchase Index increased 11 percent compared with the previous week and was 3 percent higher than the same week one year ago.
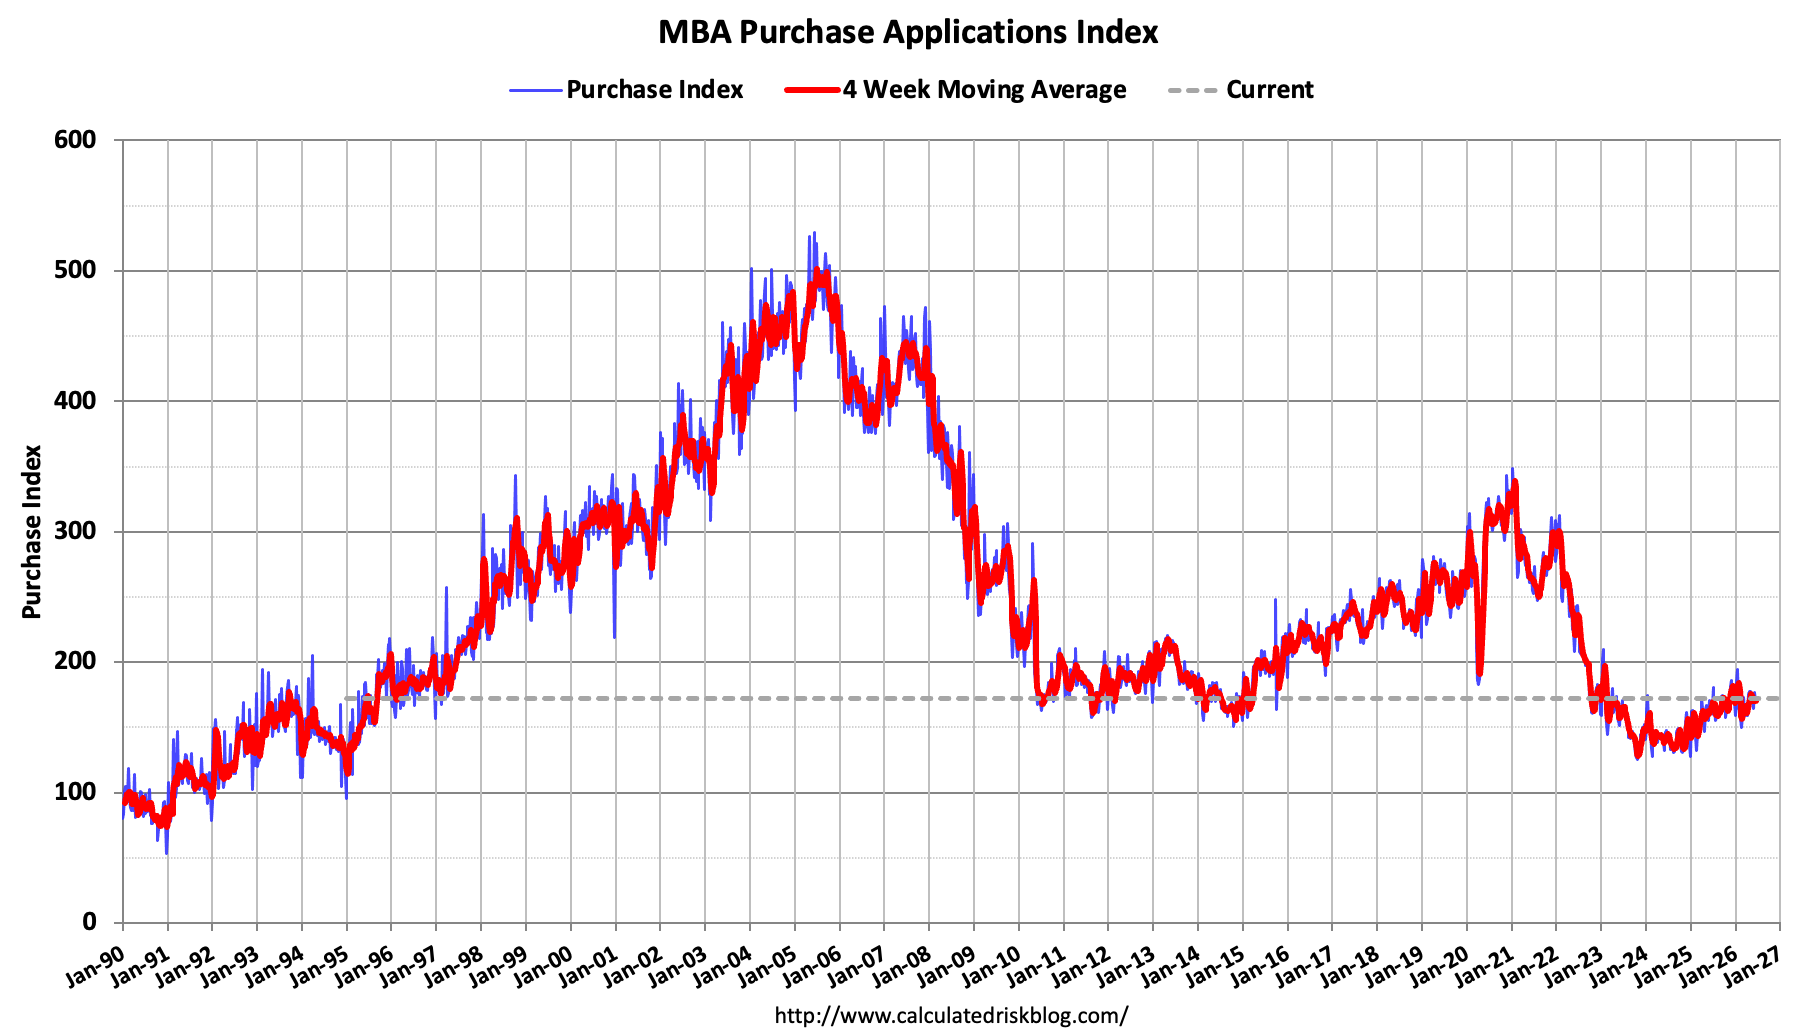
This remains historically weak.
• ADP Employment Report for June.
Private employers added 98,000 jobs in June
This was below consensus expectations.
• Construction Spending for May.
Construction spending during May 2026 was estimated at a seasonally adjusted annual rate of $2,210.2 billion, 0.1 percent (±0.7 percent)* above the revised April estimate of $2,207.1 billion. The May figure is 1.5 percent (±1.3 percent) below the May 2025 estimate of $2,244.4 billion.
This was below consensus expectations.
• ISM Manufacturing Index for June.
The Manufacturing PMI® registered 53.3 percent in June, 0.7 percentage point lower than in May. The overall economy continued in expansion for the 20th month in a row.
This was below consensus expectations.
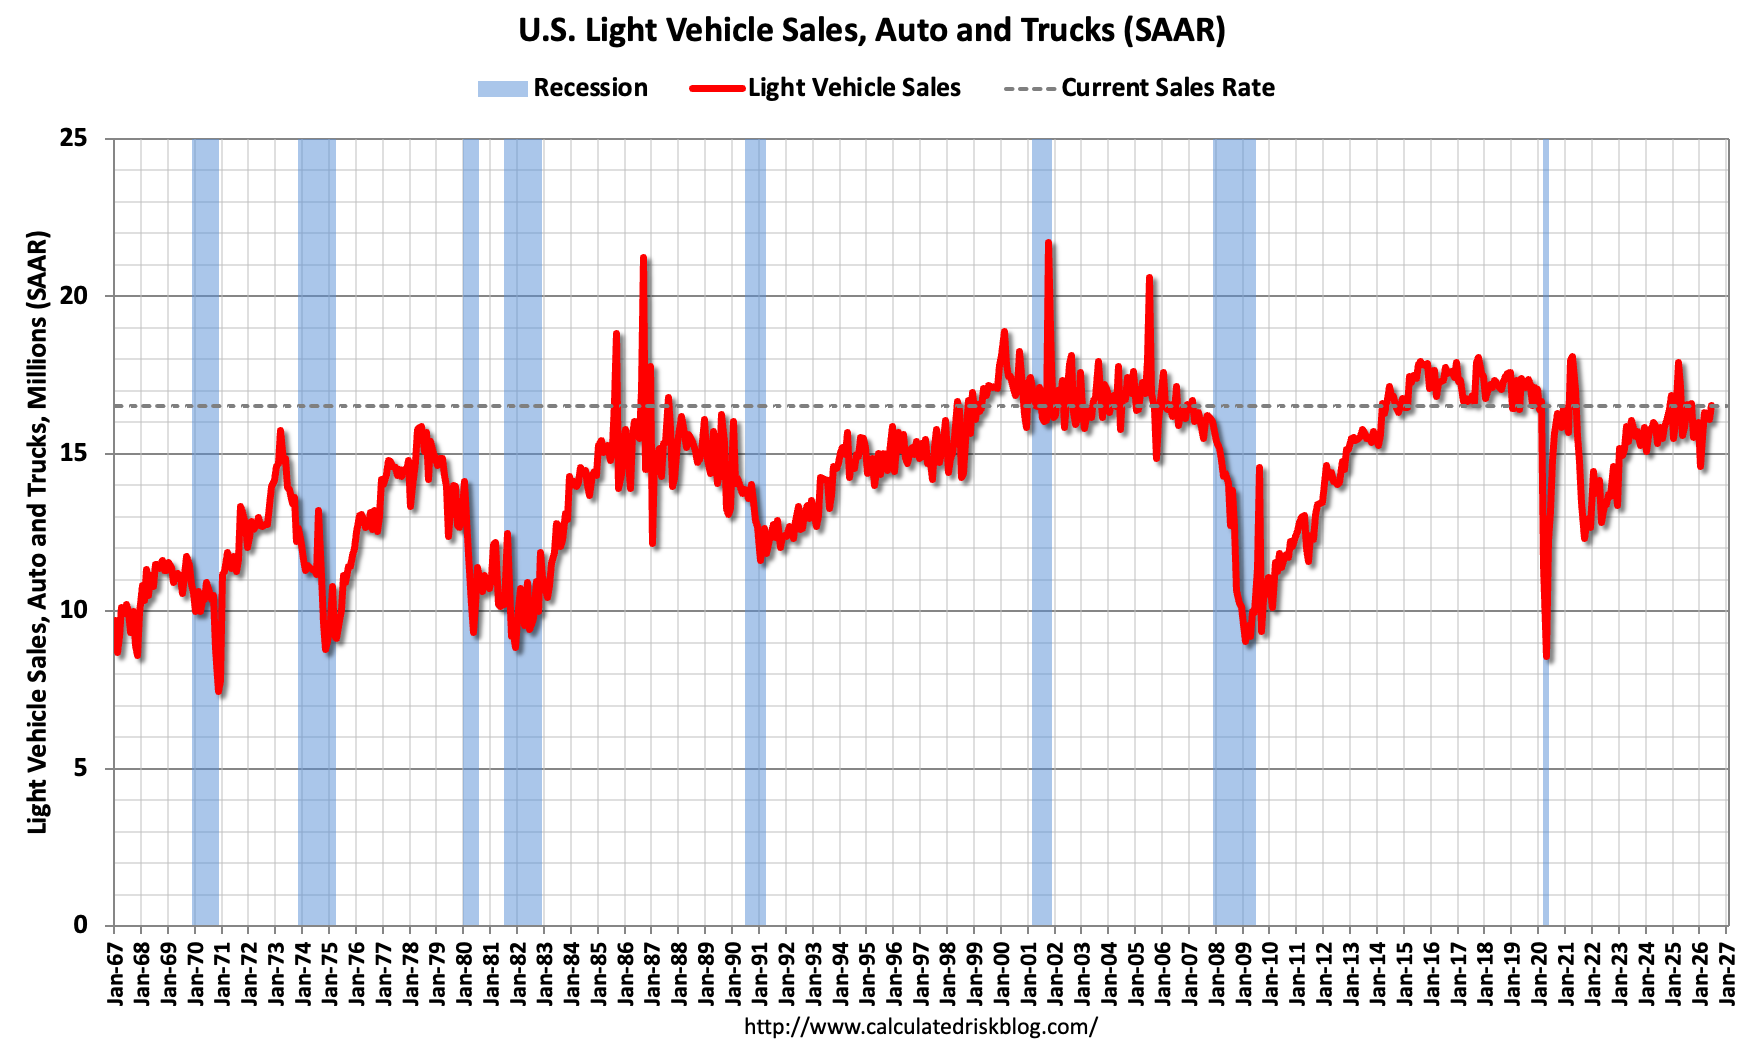
• Light vehicle sales for June. Sales were at 16.5 Million SAAR, up from 16.1 million the previous month. This was at consensus expectations.
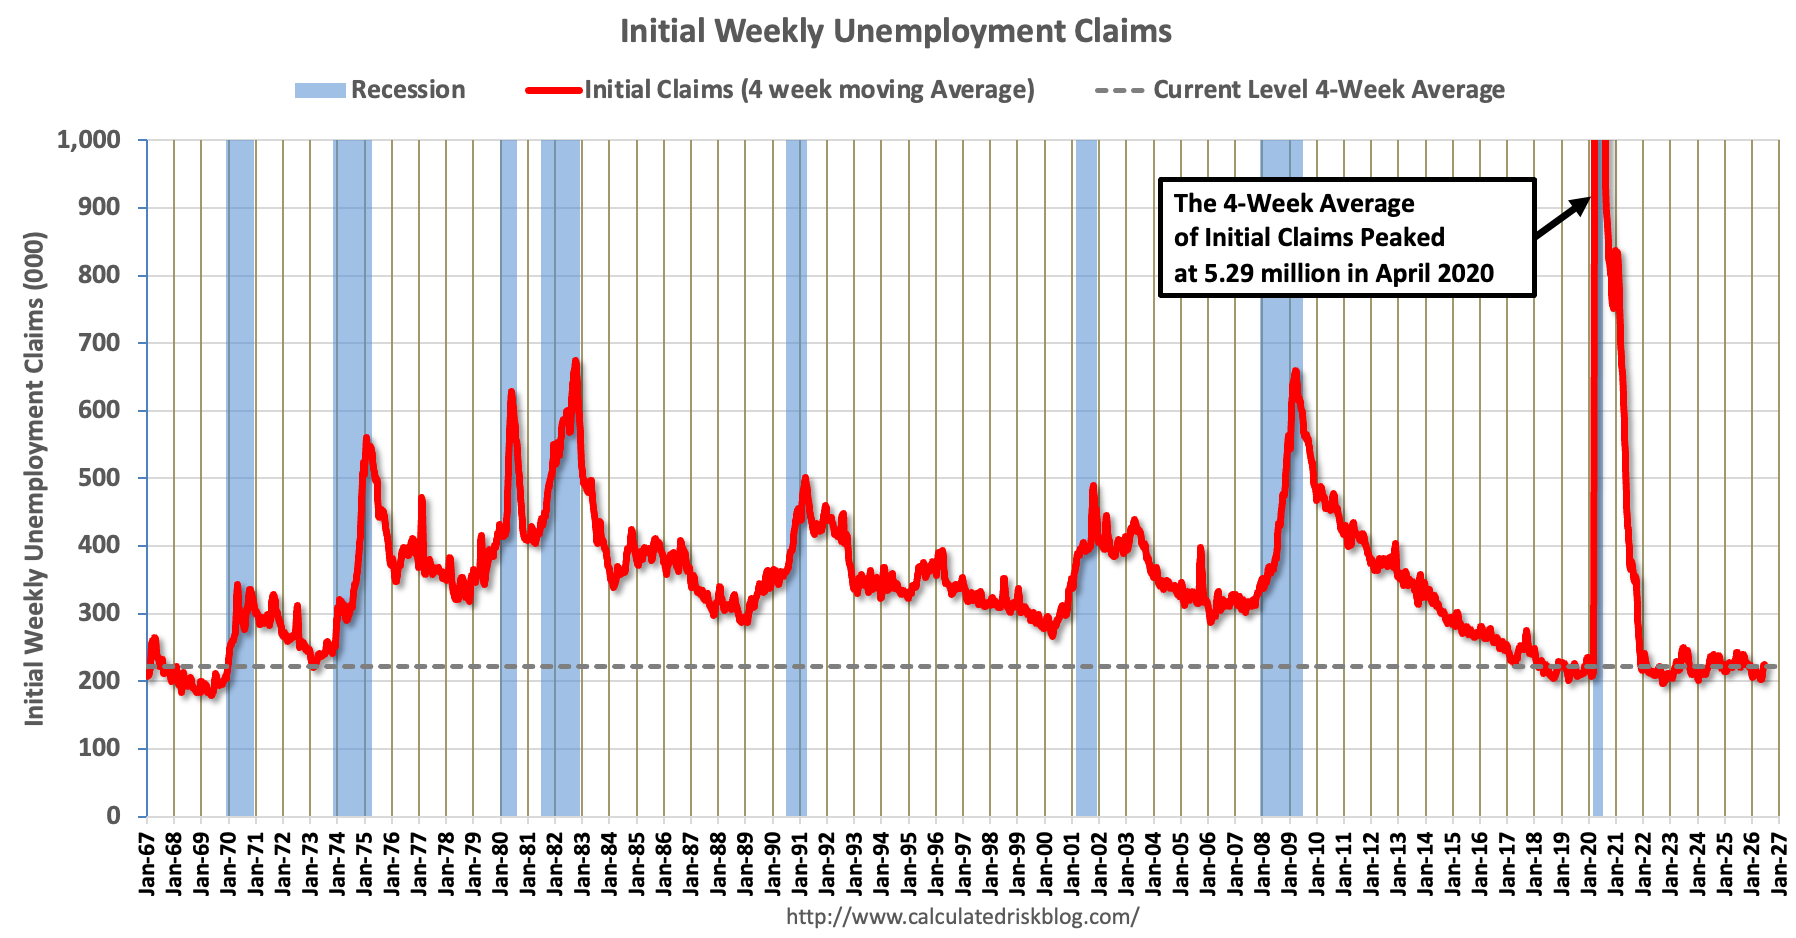
• The initial weekly unemployment claims report.
In the week ending June 27, the advance figure for seasonally adjusted initial claims was 215,000, a decrease of 1,000 from the previous week’s revised level. The previous week’s level was revised up by 1,000 from 215,000 to 216,000.
This was lower than expected.
Something I like to track is hotel occupancy. Last year was very difficult for hotels as international travel during the Summer months declined due to the policies and rhetoric of the current administration.
This Spring was positive for hotels, and occupancy will improve in the Summer with the World Cup being held in the U.S..
From Costar: U.S. hotel results for week ending 20 June
14-20 June 2026 (percentage change from comparable week in 2025):
Occupancy: 71.3% (+1.2%)
Average daily rate (ADR): US$178.03 (+8.4%)
Revenue per available room (RevPAR): US$126.86 (+9.7%)
Cities that hosted World Cup matches was the largest increase in occupancy.
Among the Top 25 Markets, San Francisco saw the highest increases in each of the three key performance metrics: occupancy (+17.6% to 84.8%), ADR (+53.5% to US$301.35) and RevPAR (+80.5% to US$255.45). The market’s performance was helped by two World Cup matches and the Databricks Data + AI Summit.
Houston, which hosted three World Cup matches, reported the second-largest RevPAR gain (+28.1% to US$100.01), while Seattle, host of two World Cup matches, posted the second-highest ADR lift (+30.5% to US$271.80).
The following graph shows the seasonal pattern for the hotel occupancy rate using the four-week average.
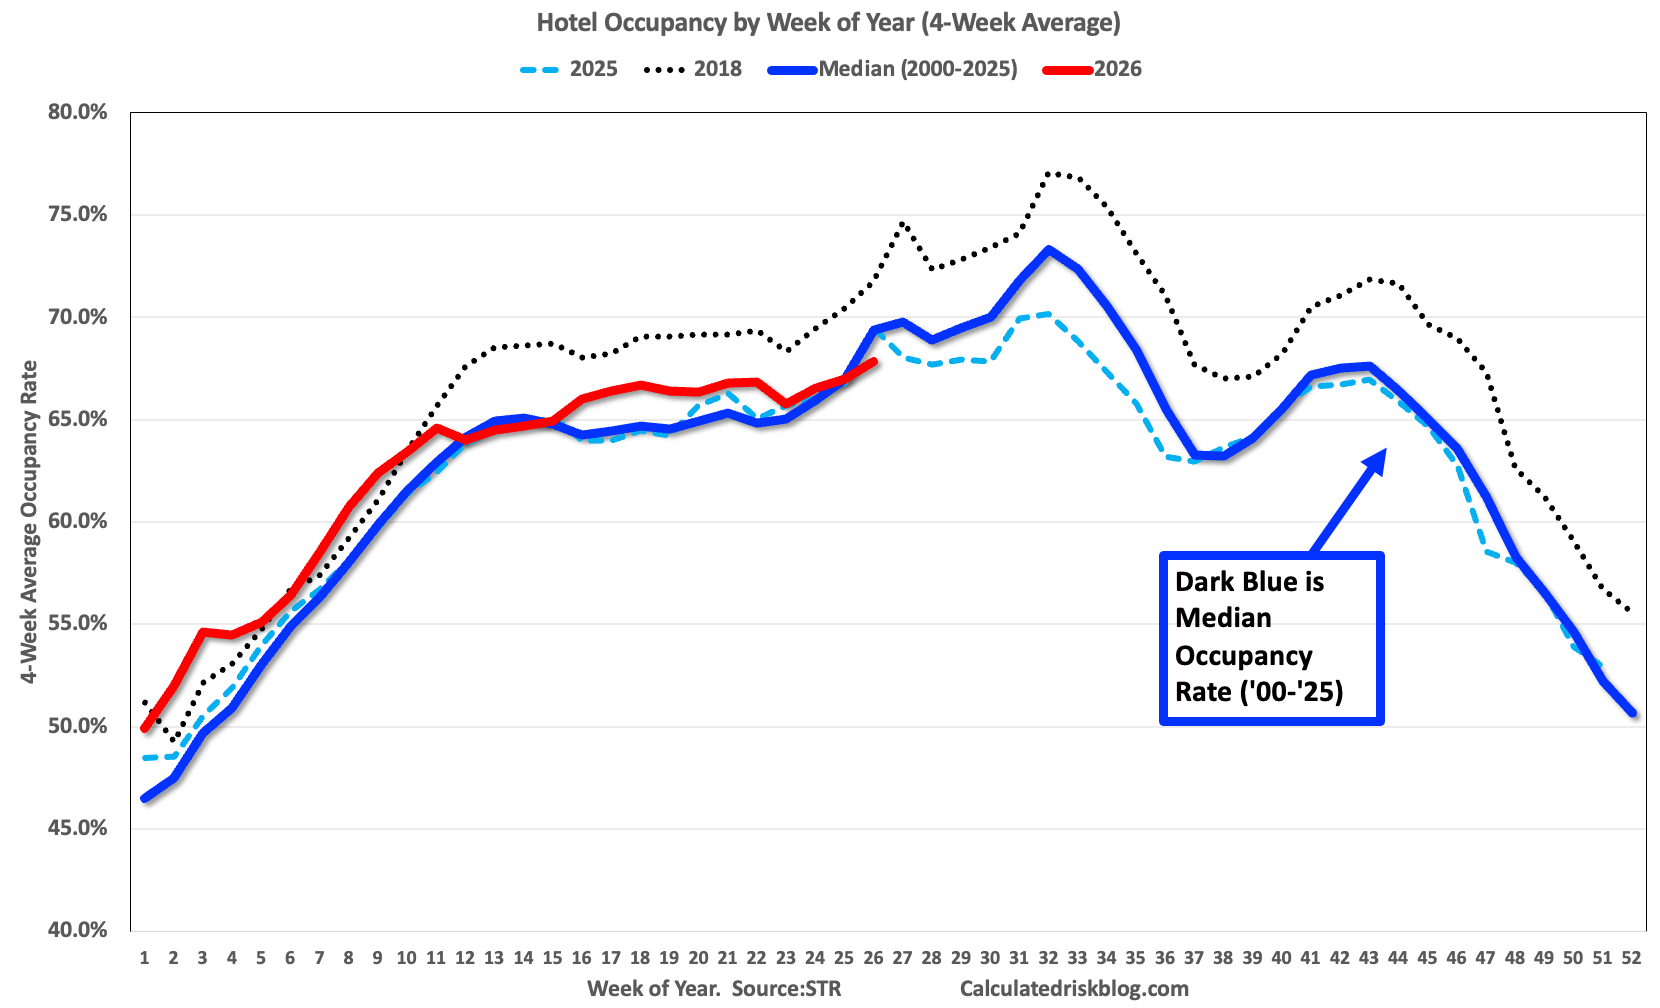
The red line is for 2026, blue is the median, and dashed light blue is for 2025. Dashed black is for 2018, the record year for hotel occupancy. The 4-week average is just below the median for 2000-2025.
Note: Y-axis doesn’t start at zero to better show the seasonal change.
A key for hotels will be after the World Cup finishes.
Thanks for reading Economic Weekly! This post is public so feel free to share it.
No posts
Comments
Nothing yet. Say the first thing.
Sign in to join the conversation.