
This weekly email has three parts: the Schedule of economic data for the following week, a Review of data for the previous week, and a brief Commentary on a current topic.
The key reports this coming week are June CPI, Retail Sales and Housing Starts.
----- Monday, July 13th -----
No major economic releases scheduled.
----- Tuesday, July 14th -----
6:00 AM ET: NFIB Small Business Optimism Index for June.
8:30 AM: The Consumer Price Index for June from the BLS. The consensus is for a 0.1% decrease in CPI, and a 0.3% increase in core CPI. The consensus is for CPI to be up 3.9% Year-over-year (YoY), and core CPI to be up 2.9% YoY.
10:00 AM: Testimony, Fed Chairman Kevin Warsh, Semiannual Monetary Policy Report to Congress, Before the U.S. House Financial Services Committee
----- Wednesday, Wednesday, July 15th -----
7:00 AM: The Mortgage Bankers Association (MBA) will release the results for the mortgage purchase applications index.
8:30 AM: The New York Fed Empire State manufacturing survey for July. The consensus is for a reading of 8.6, up from 5.7.
8:30 AM: The Producer Price Index for June from the BLS. The consensus is for a no change in PPI, and a 0.4% increase in core PPI.
10:00 AM: Testimony, Fed Chairman Kevin Warsh, Semiannual Monetary Policy Report to Congress, Before the U.S. Senate Committee on Banking, Housing, and Urban Affairs
2:00 PM: the Federal Reserve Beige Book, an informal review by the Federal Reserve Banks of current economic conditions in their Districts.
----- Thursday, July 16th -----
8:30 AM: The initial weekly unemployment claims report will be released. The consensus is for initial claims to increase to 218 thousand from 215 thousand last week.
8:30 AM: Retail sales for June is scheduled to be released. The consensus is for a 0.3% increase in retail sales.
8:30 AM: the Philly Fed manufacturing survey for July. The consensus is for a reading of 15.0, up from 10.3.
10:00 AM: The July NAHB homebuilder survey. The consensus is for a reading of 35, unchanged from 35 last month. Any number below 50 indicates that more builders view sales conditions as poor than good.
10:00 AM: Pending Home Sales Index for June. The consensus is for a 1.0% increase in this index.
----- Friday, July 17th -----
9:15 AM: The Fed will release Industrial Production and Capacity Utilization for June. The consensus is a 0.2% increase in Industrial Production, and for Capacity Utilization to be unchanged at 76.2%.
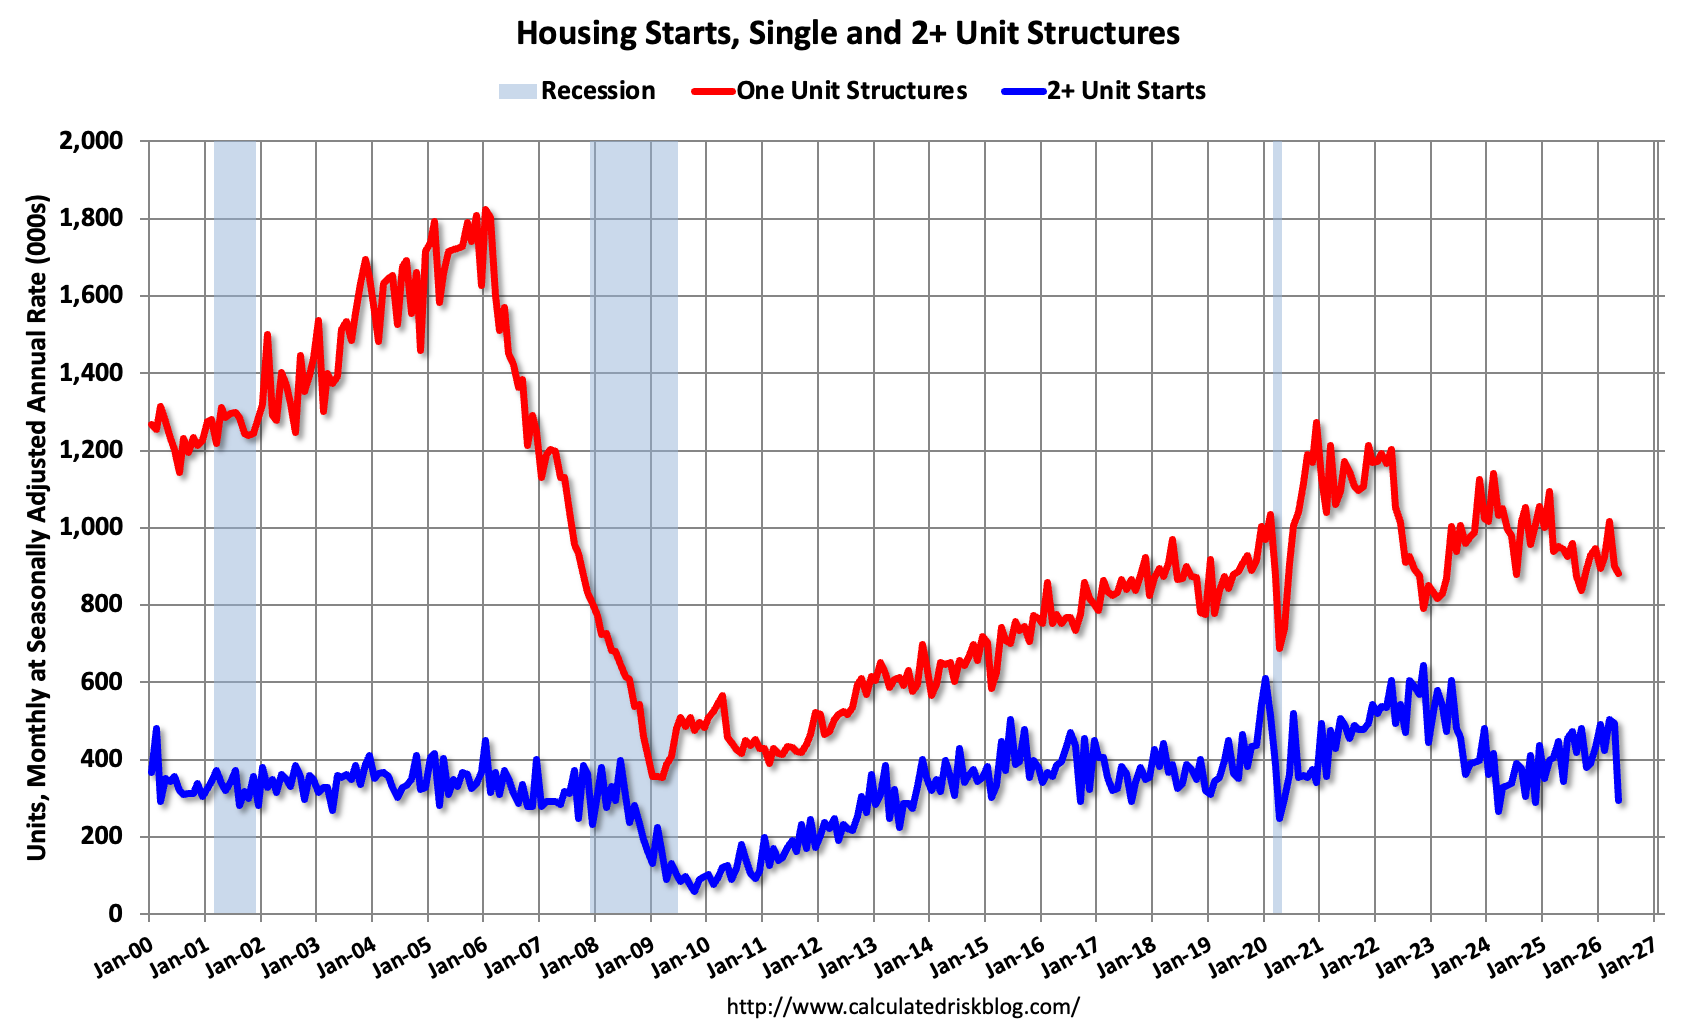
8:30 AM: Housing Starts for June. The consensus is for 1.320 million SAAR in June, up from 1.177 million SAAR in May. This graph shows single and multi-family housing starts since 2000 (including housing bubble).
10:00 AM: University of Michigan's Consumer sentiment index (Preliminary for July).
• NAR: Existing-Home Sales Decreased to 4.09 million SAAR in June
• Inflation Adjusted House Prices 4.4% Below 2022 Peak
• July ICE Mortgage Monitor: "Annual home price growth was 1.3% in mid-June"
• Asking Rents Continue to Decline Year-over-year
• 1st Look at Local Housing Markets in June
Economic data was close to expectations this week (Existing home sales were below expectations).
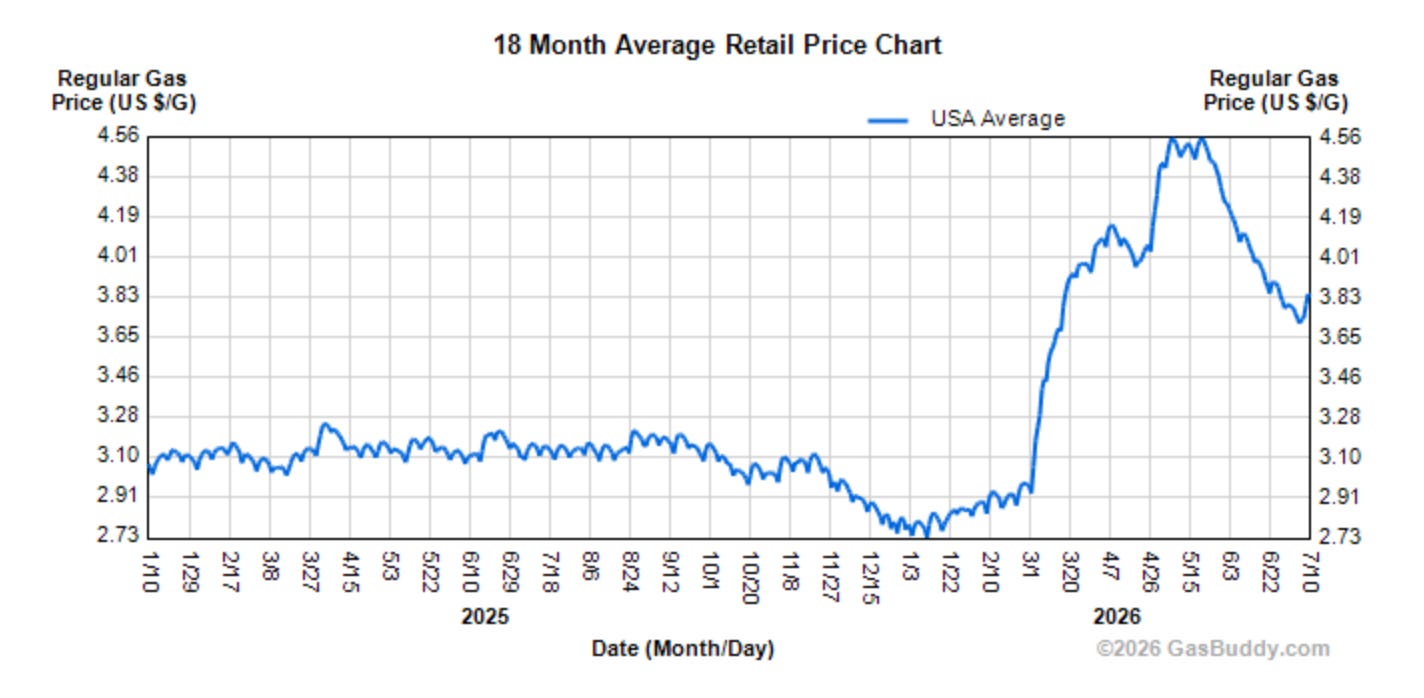
• Oil and Gas prices. WTI oil prices are at $72 per barrel as of this writing, down significantly from recent peak, and up 10% from late February. The national average gasoline price is $3.84 per gallon, down sharply from the recent peak of $4.56 per gallon, but up about 31% since late February. It takes time for lower oil prices to reach the pumps.
• ISM Services Index for June.
In June, the Services PMI® registered 54 percent, a decrease of 0.5 percentage point compared to May’s figure of 54.5 percent.
This was close to expectations.
• U.S. International Trade in Goods and Services for May.
The U.S. Census Bureau and the U.S. Bureau of Economic Analysis announced today that the goods and services deficit was $77.6 billion in May, up $23.0 billion from $54.6 billion in April, revised.
May exports were $317.7 billion, $10.5 billion less than April exports. May imports were $395.3 billion, $12.5 billion more than April imports.
This was close to the consensus estimate.
• The mortgage purchase applications index from the Mortgage Bankers Association (MBA).
The seasonally adjusted Purchase Index decreased 1 percent from one week earlier. The unadjusted Purchase Index decreased 11 percent compared with the previous week and was 5 percent higher than the same week one year ago.
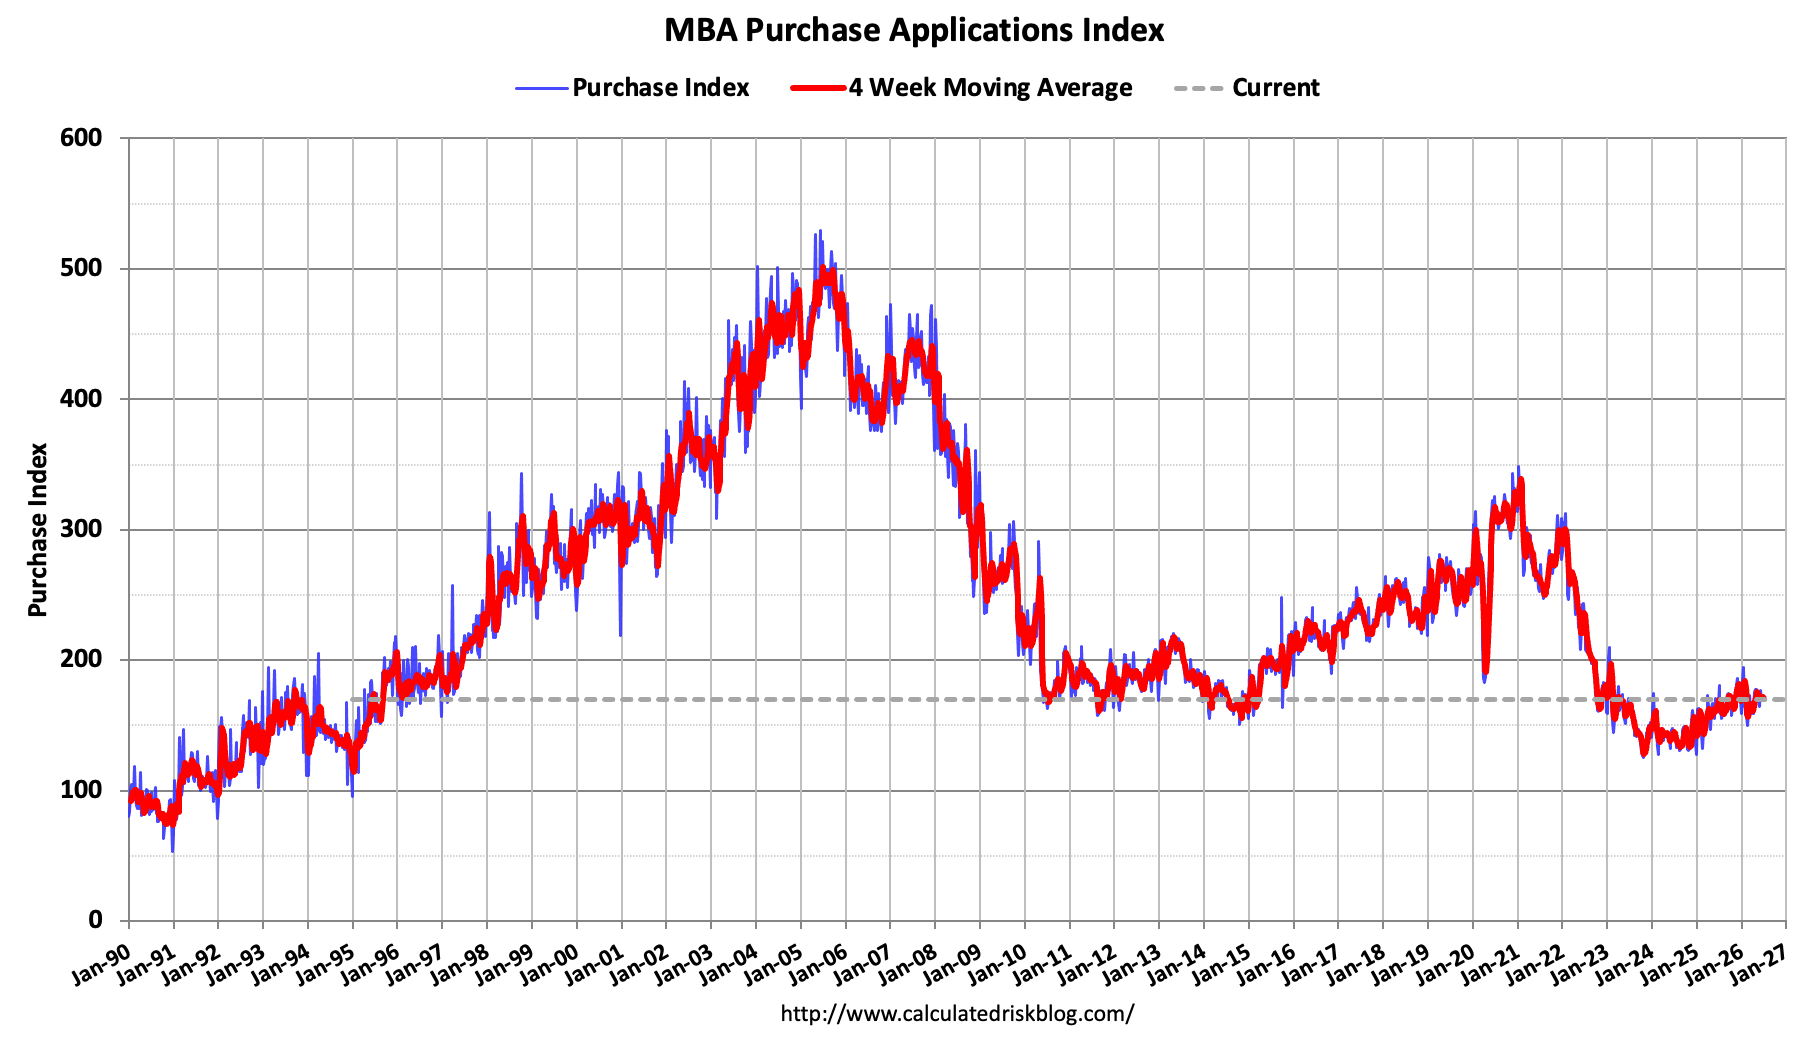
This remains historically weak.
• FOMC Minutes, Meeting of June 16-17
The majority of participants highlighted the possibility that, after several years of inflation above 2 percent, continued elevated inflation rates could begin to affect inflation expectations and wage- and price-setting decisions. …
Regarding participants' individual assessments of appropriate monetary policy under what each participant judged to be the most likely scenario for the economy, many participants indicated that the appropriate level of the federal funds rate would be within or slightly below the current target range at the end of this year. Many other participants, however, assessed that the appropriate level of the federal funds rate would be above the current target range at the end of this year.
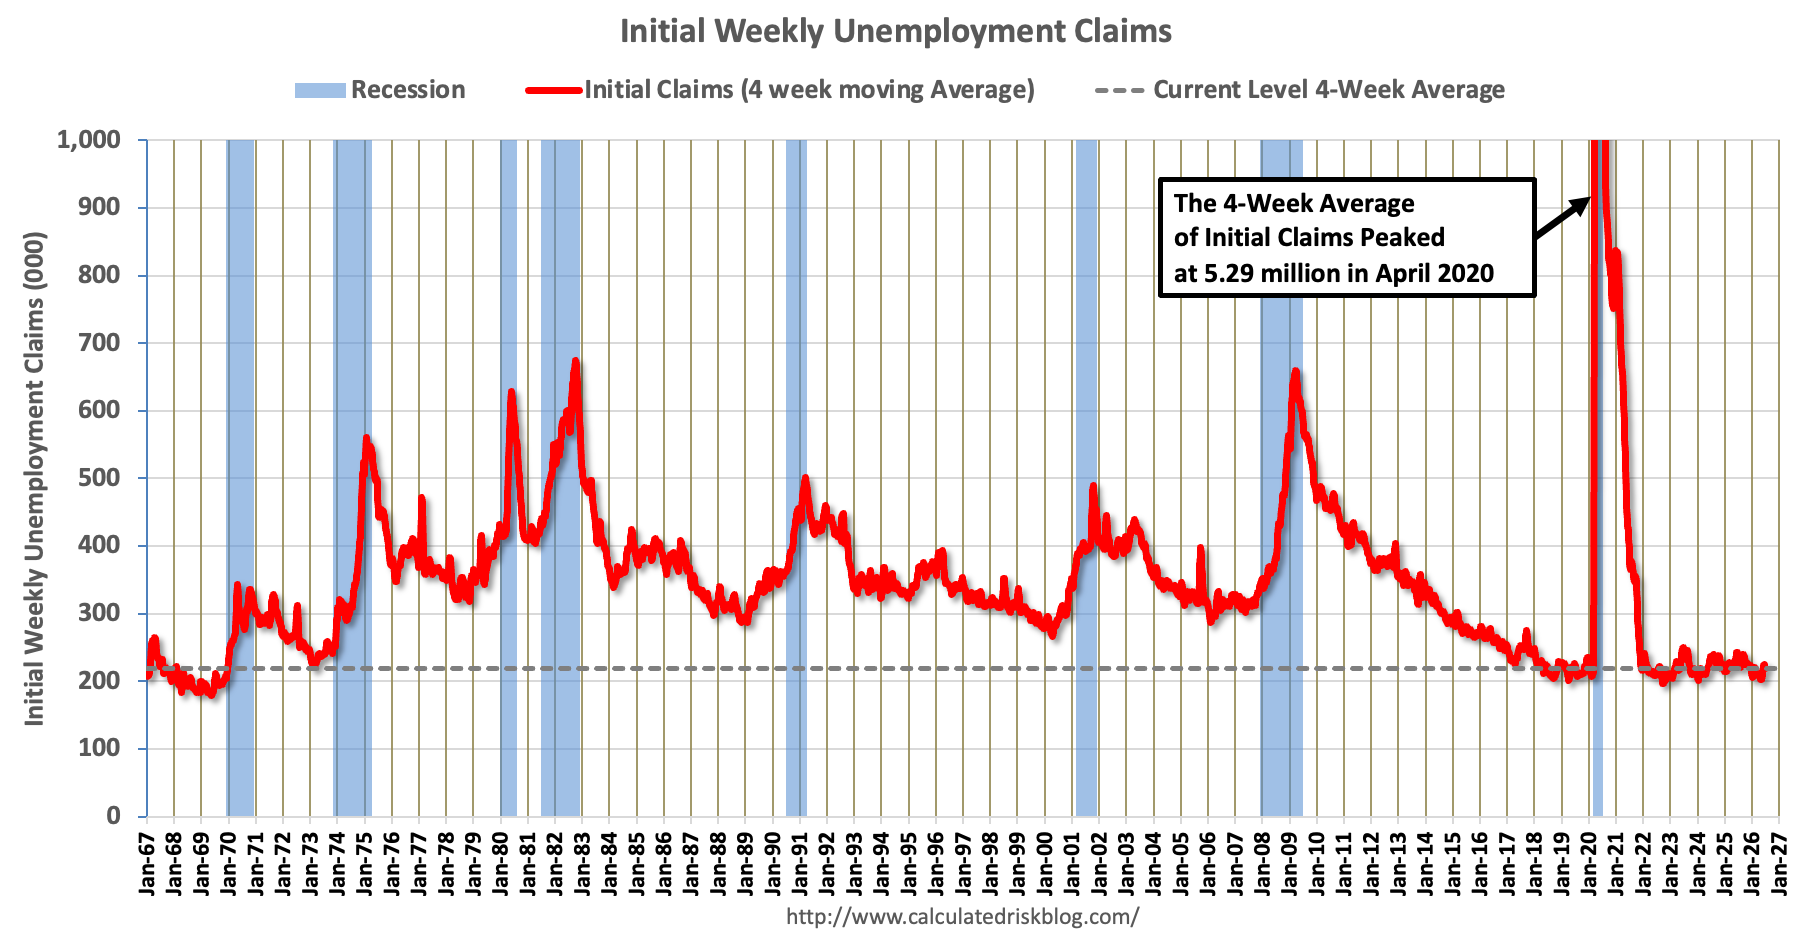
• The initial weekly unemployment claims report.
In the week ending July 4, the advance figure for seasonally adjusted initial claims was 215,000, a decrease of 2,000 from the previous week’s revised level. The previous week’s level was revised up by 2,000 from 215,000 to 217,000.
This was close to expectations.
The advance estimate of Q2 2026 GDP will be released July 30th. Some of the tracking estimates suggest GDP will be fairly weak in Q2 (and many analysts have been expecting the 2nd half of 2026 will be weak).
Here are some tracking estimates:
From BofA:
Since our last weekly publication, 2Q GDP tracking is down to 1.4% q/q saar and 1Q GDP came close to our forecast at 2.1% q/q saar in the third estimate. [July 10th estimate]
emphasis added
From Goldman:
We lowered our Q2 GDP growth tracking estimate by 0.1pp to 2.1% [July 6th estimate]
And from the Atlanta Fed: GDPNow. They are tracking at 1.3% as of July 8th.
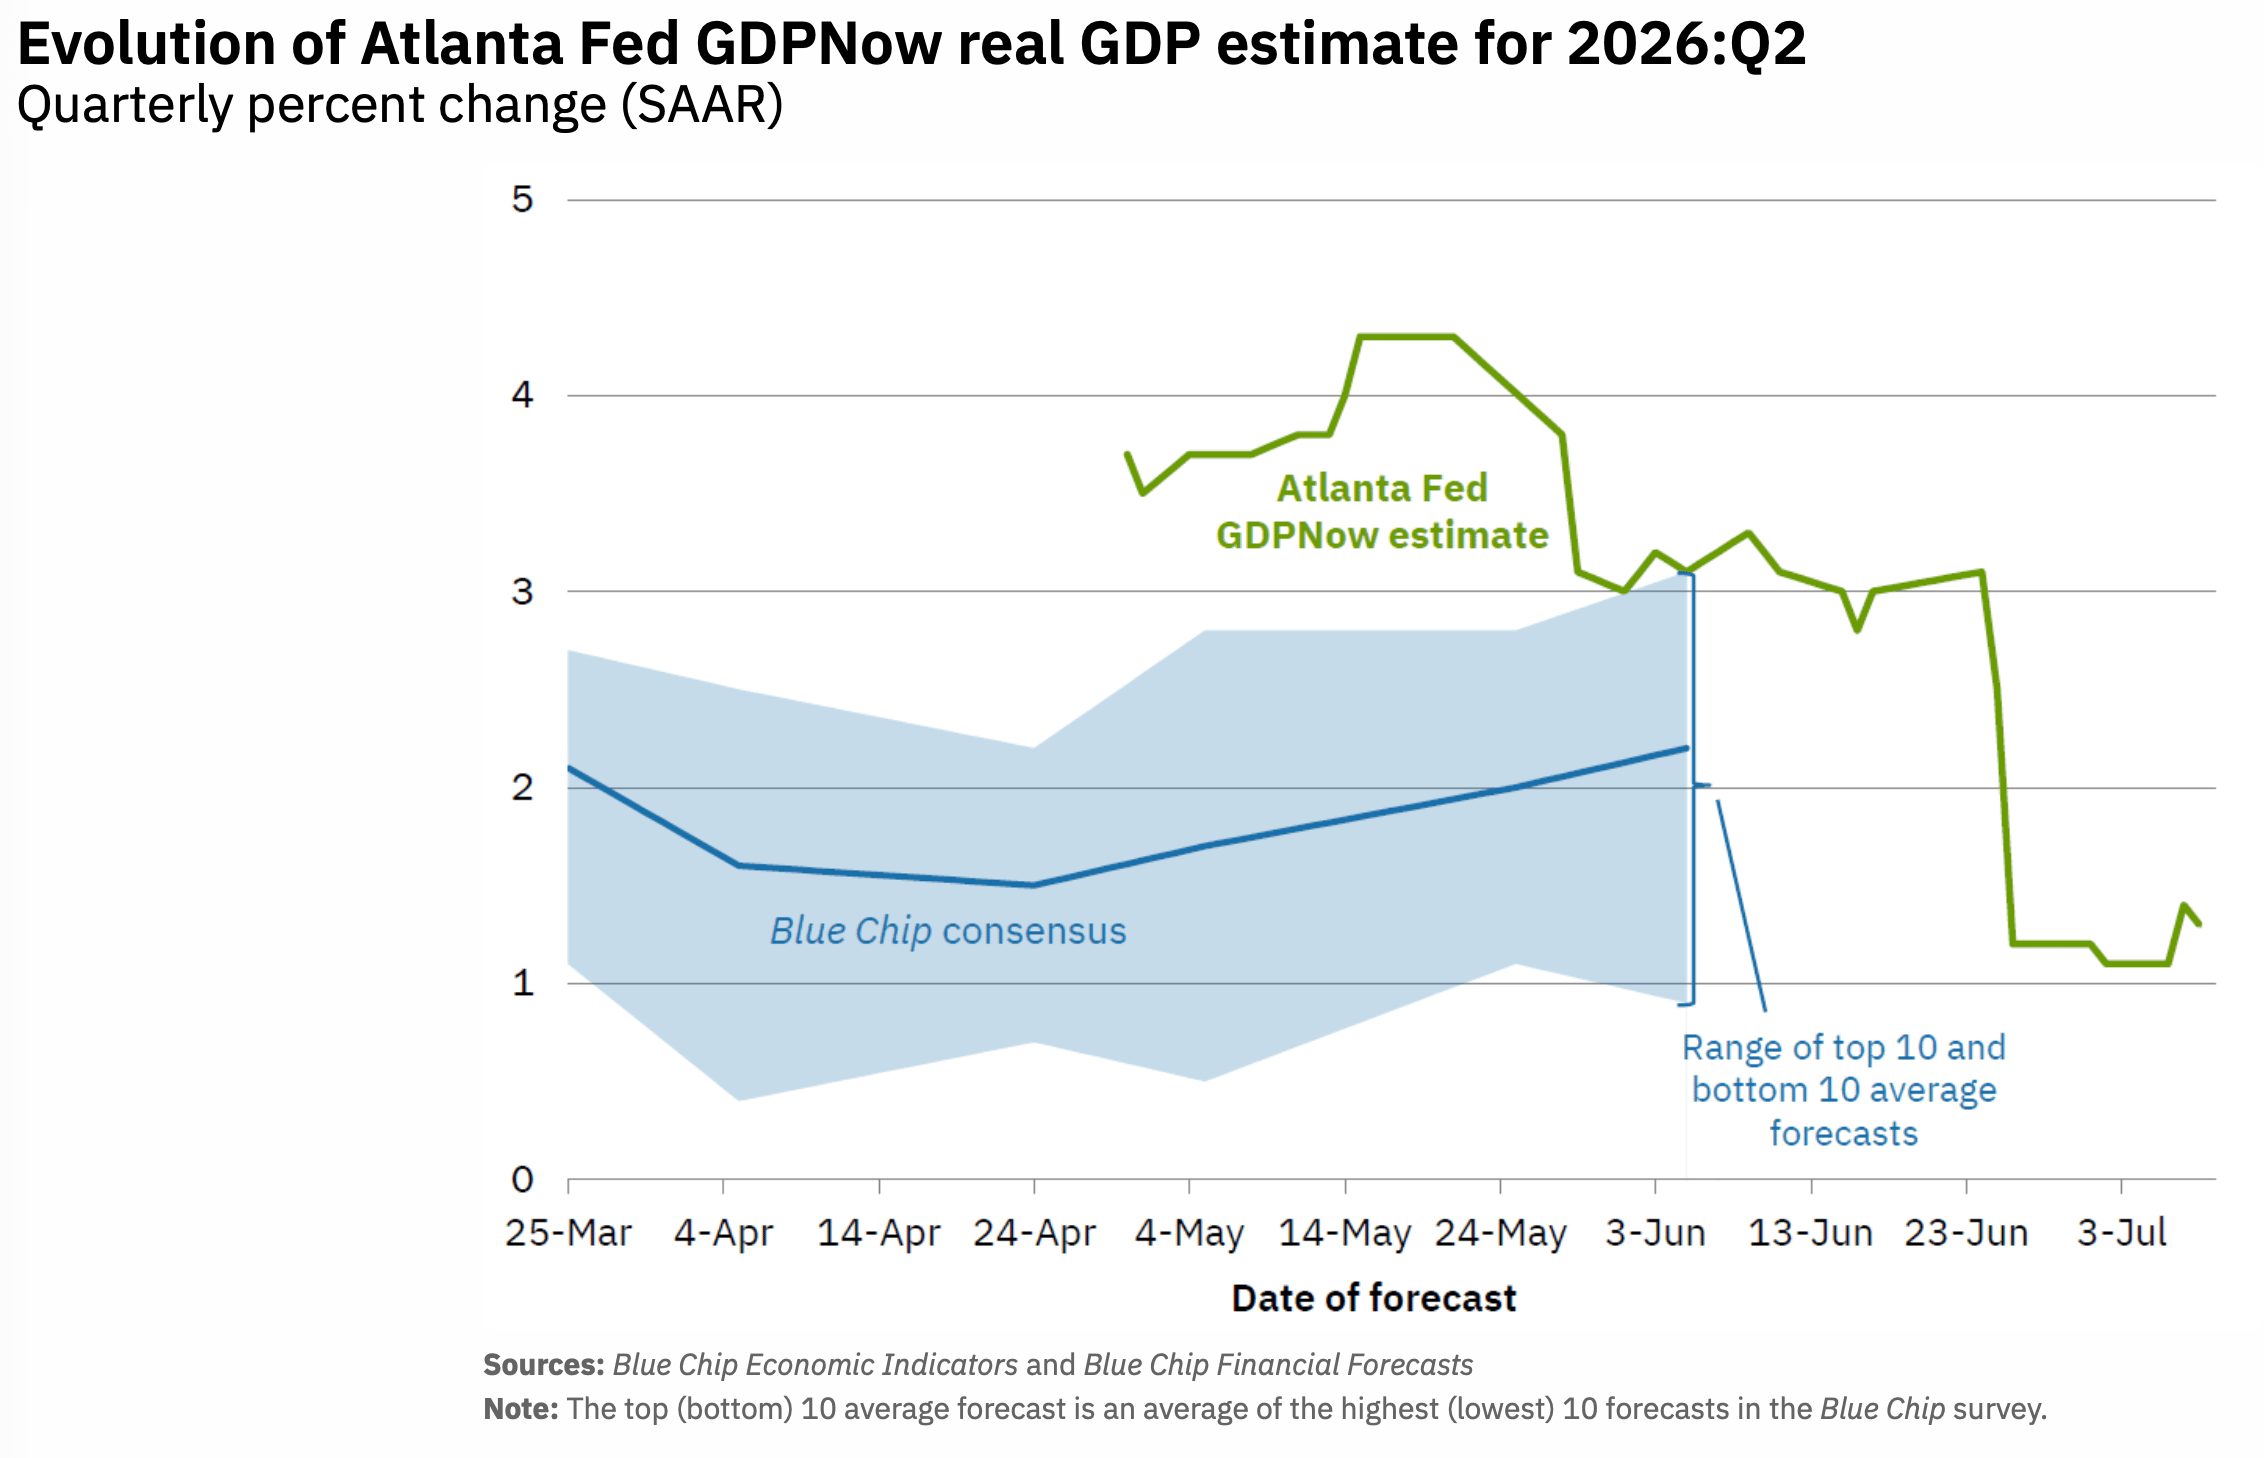
It appears GDP was somewhat weak in Q2.
Thanks for reading Economic Weekly! This post is public so feel free to share it.
No posts
Comments
Nothing yet. Say the first thing.
Sign in to join the conversation.