
This weekly email has three parts: the Schedule of economic data for the following week, a Review of data for the previous week, and a brief Commentary on a current topic.
The key report this coming week is June New Home Sales.
----- Monday, July 20th -----
No major economic releases scheduled.
----- Tuesday, July 21st -----
No major economic releases scheduled.
----- Wednesday, Wednesday, July 22nd -----
7:00 AM: The Mortgage Bankers Association (MBA) will release the results for the mortgage purchase applications index.
During the day: The AIA's Architecture Billings Index for June (a leading indicator for commercial real estate).
----- Thursday, July 23rd -----
8:30 AM: The initial weekly unemployment claims report will be released. The consensus is for initial claims to increase to 214 thousand from 208 thousand last week.
8:30 AM: Chicago Fed National Activity Index for June. This is a composite index of other data.
11:00 AM: Kansas City Fed Survey of Manufacturing Activity for July.
----- Friday, July 24th -----
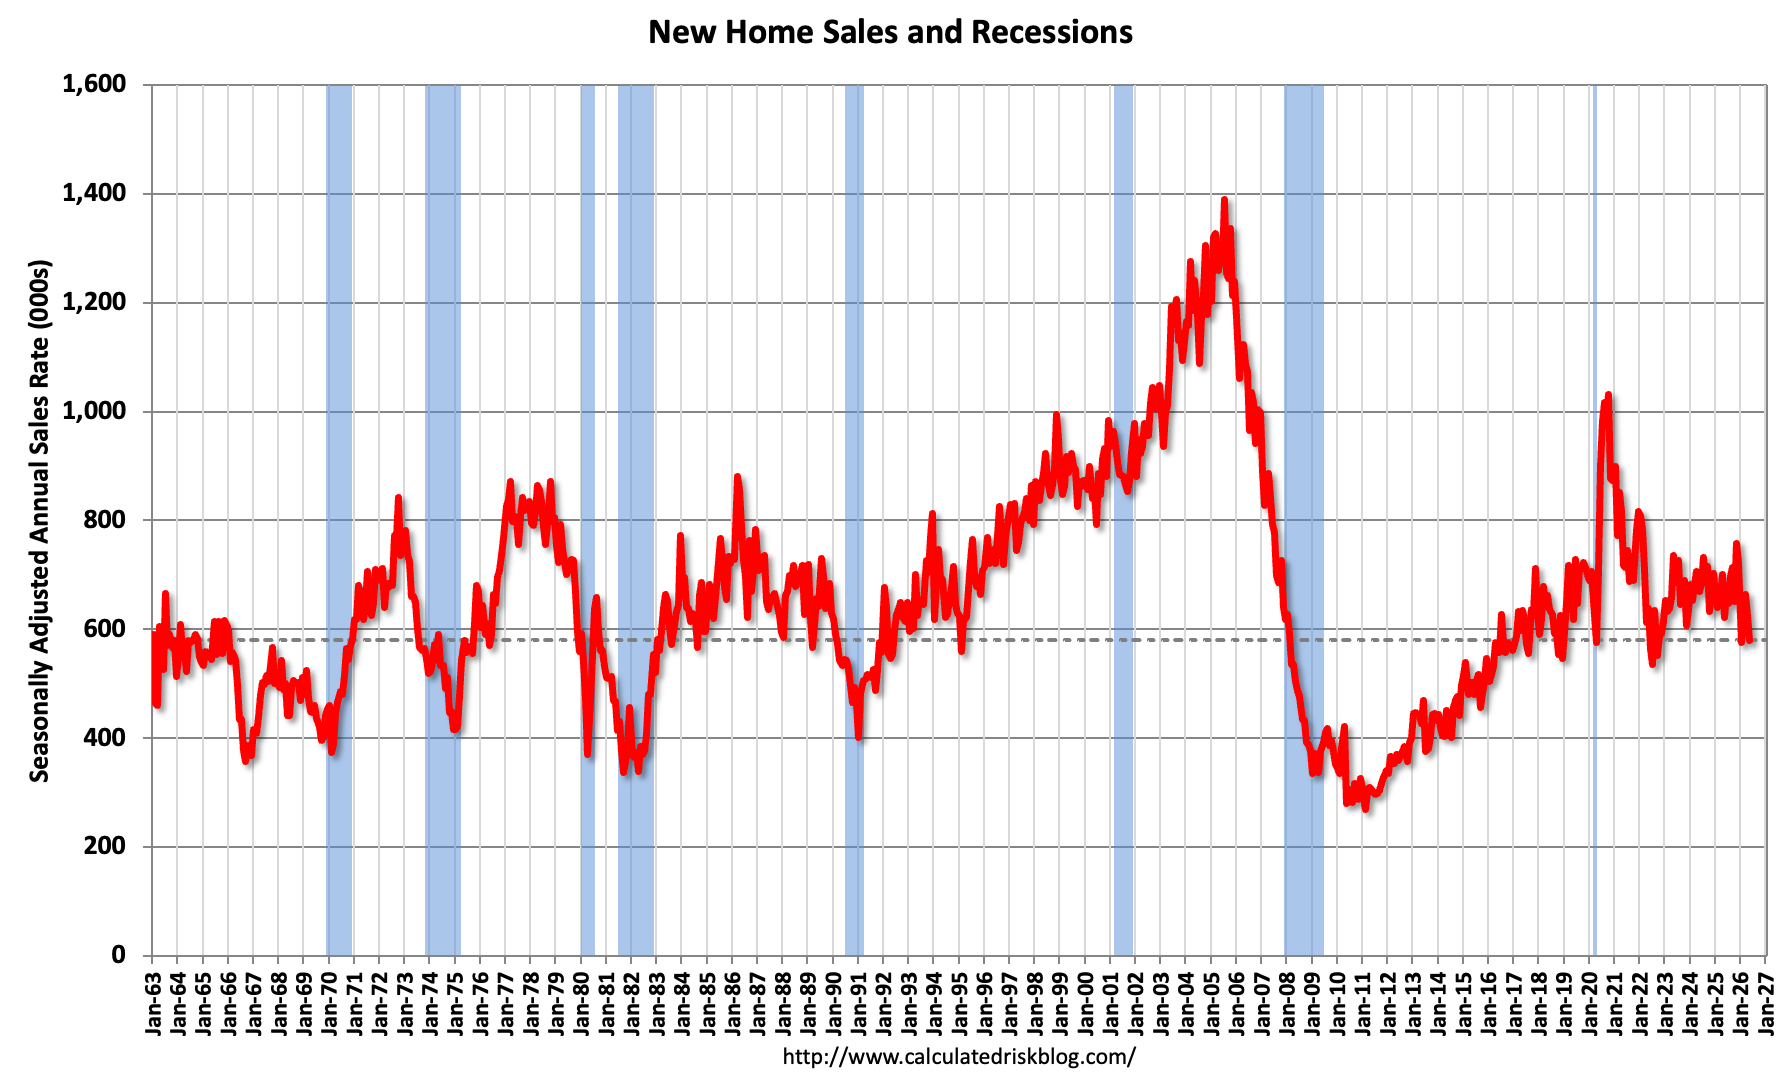
10:00 AM: New Home Sales for June from the Census Bureau. This graph shows New Home Sales since 1963. The dashed line is the sales rate for last month. The consensus is for 610 thousand SAAR in June, up from 580 thousand in May.
• Housing Starts Increased to 1.427 million Annual Rate in June
• NAHB Housing Market Index and Single Family Starts
• Part 1: Current State of the Housing Market; Overview for mid-July 2026
• Part 2: Current State of the Housing Market; Overview for mid-July 2026
Economic data was mixed last week, but inflation was lower than expected (Most housing data was weak, although housing starts were above expectations due to the volatile multi-family sector).
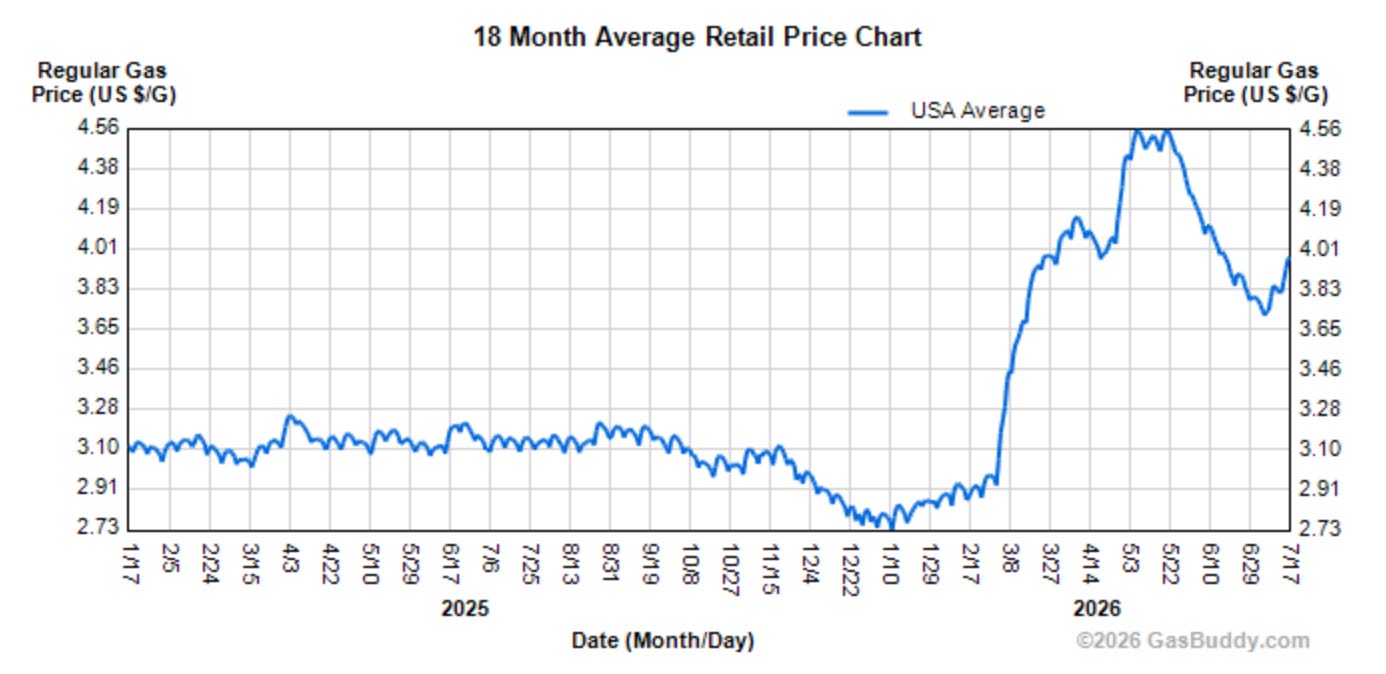
• Oil and Gas prices. WTI oil prices are at $81 per barrel as of this writing, up since with the renewal of hostilities in the Middle East. The national average gasoline price is $3.98 per gallon, up recently, but down from the recent peak of $4.56 per gallon.
• Consumer Price Index for June.
The Consumer Price Index for All Urban Consumers (CPI-U) decreased 0.4 percent on a seasonally adjusted basis in June … The index for all items less food and energy was unchanged in June. …
The all items index rose 3.5 percent for the 12 months ending June after rising 4.2 percent for the 12 months ending May. The all items less food and energy index rose 2.6 percent over the year, following a 2.9-percent increase over the 12 months ending May.
The was well below the consensus estimate of a 0.1% increase in CPI, and a 0.3% increase in core CPI.
• The mortgage purchase applications index from the Mortgage Bankers Association (MBA).
The seasonally adjusted Purchase Index decreased 7 percent from one week earlier. The unadjusted Purchase Index increased 3 percent compared with the previous week and was 2 percent lower than the same week one year ago.
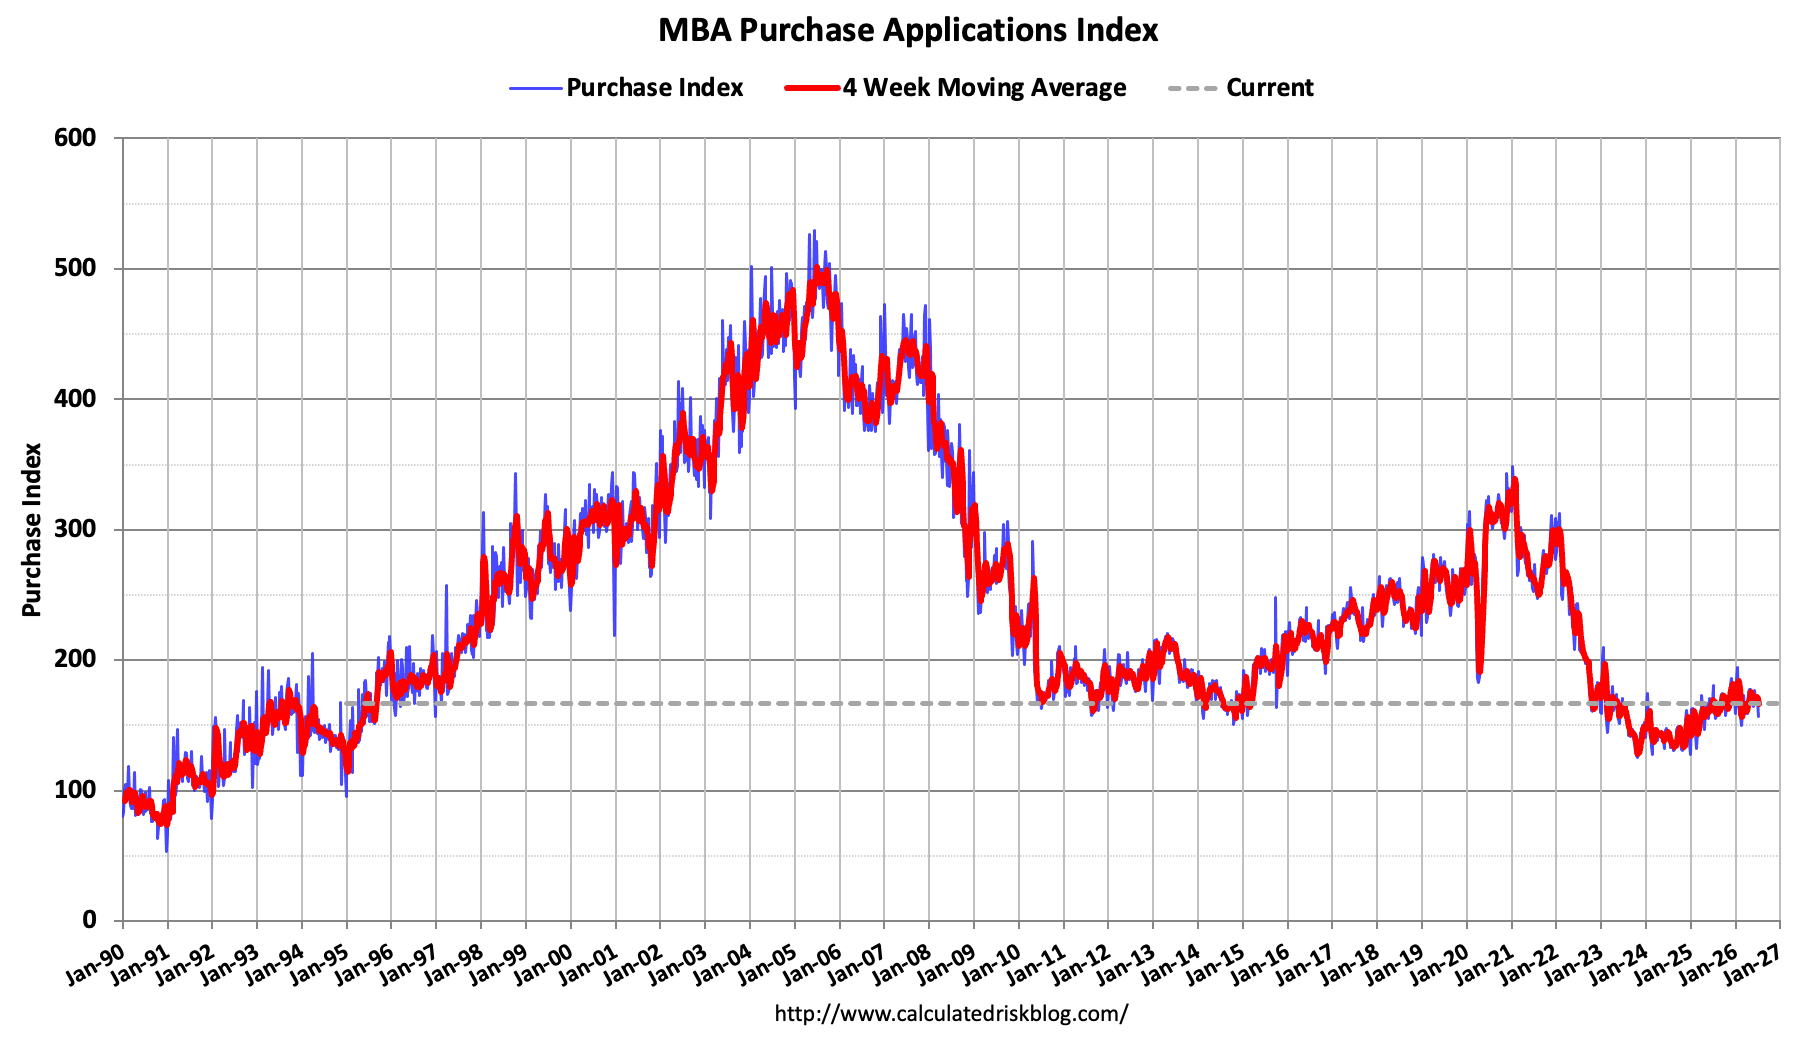
There was a holiday adjustment this week, but this index remains historically weak.
• New York Fed Empire State manufacturing survey for July.
Business activity picked up considerably in New York State in July, according to firms responding to the Empire State Manufacturing Survey. The headline general business conditions index rose ten points to 15.6.
This was above the consensus estimate for a reading of 8.6.
• The Producer Price Index for June.
The Producer Price Index for final demand fell 0.3 percent in June, seasonally adjusted ... On an unadjusted basis, the index for final demand increased
5.5 percent for the 12 months ended in June. …The index for final demand less foods, energy, and trade services increased 0.1 percent in June after jumping 0.8 percent in May. For the 12 months ended in June, prices for final demand less foods, energy, and trade services rose 5.1 percent.
This was below expectations of no change in PPI, and a 0.4% increase in core PPI.
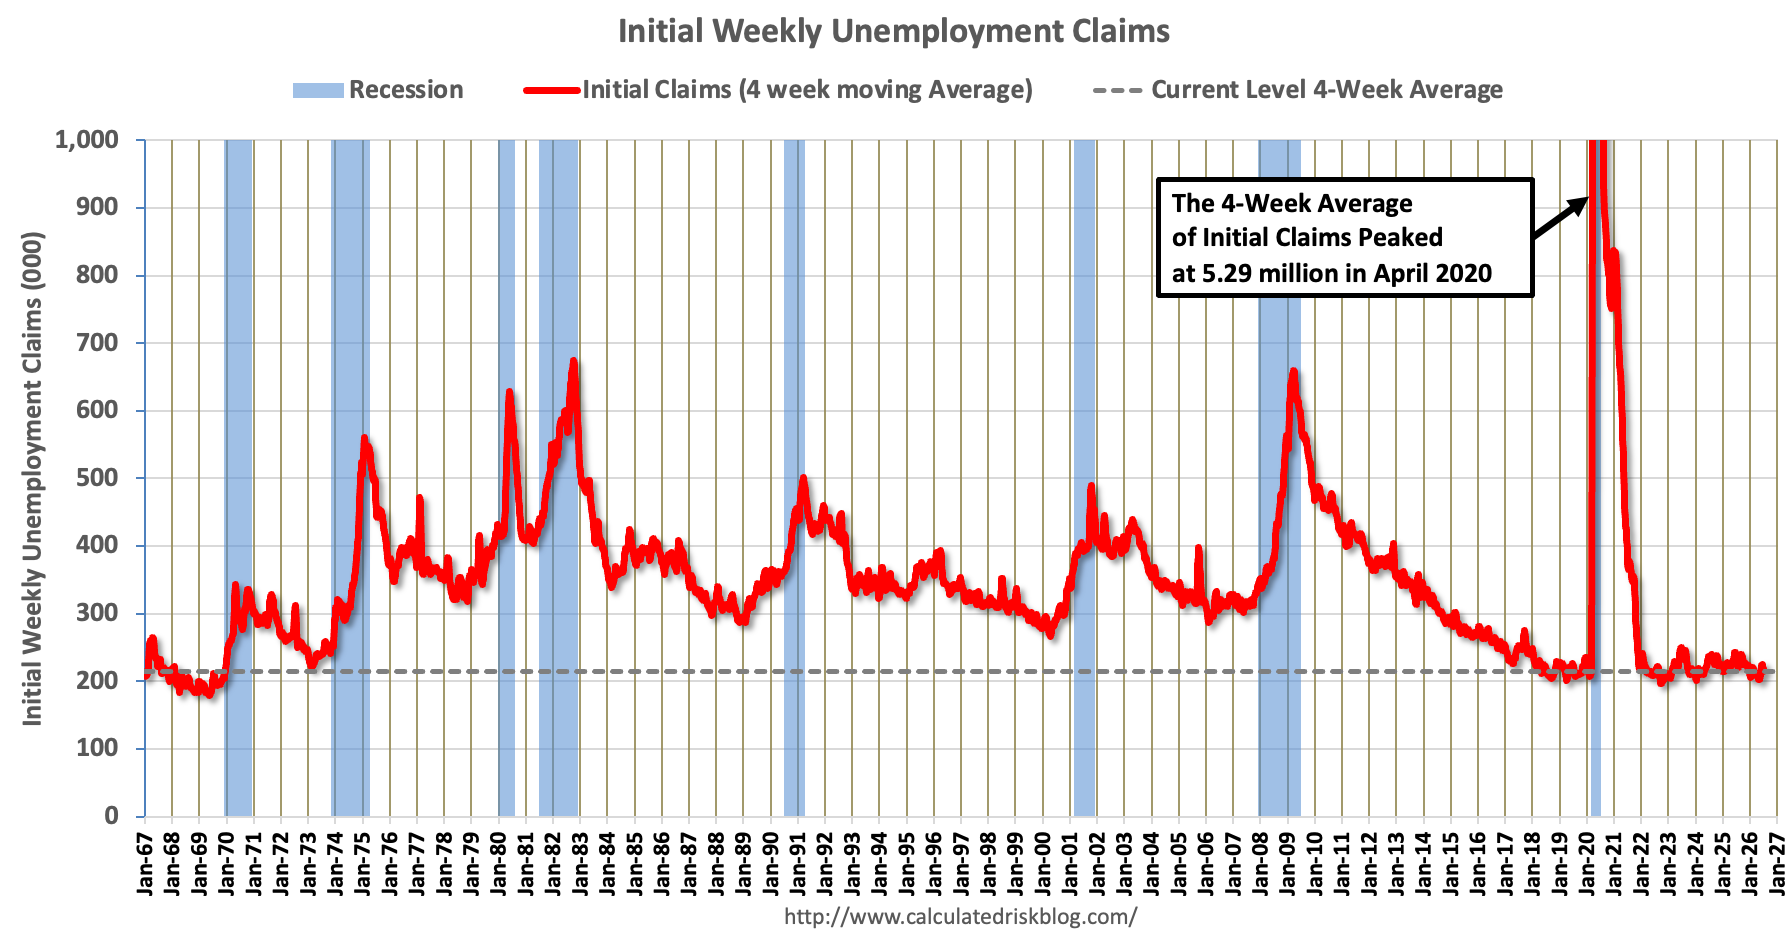
• The initial weekly unemployment claims report.
In the week ending July 11, the advance figure for seasonally adjusted initial claims was 208,000, a decrease of 8,000 from the previous week’s revised level. The previous week’s level was revised up by 1,000 from 215,000 to 216,000.
This was below expectations.
Advance estimates of U.S. retail and food services sales for June 2026, adjusted for seasonal variation and holiday and trading-day differences, but not for price changes, were $768.6 billion, up 0.2 percent from the previous month, and up 6.7 percent from June 2025.
This was slightly below the consensus estimate.
• Philly Fed manufacturing survey for July.
The diffusion index for current general activity rose from -0.4 in May to 10.3 in June
This was slightly weaker than expected.
• Industrial Production and Capacity Utilization for June.
Industrial production (IP) ticked up 0.1 percent in June and grew at an annual rate of 4.0 percent in the second quarter. Manufacturing output was unchanged in June but rose at an annual rate of 4.7 percent in the second quarter. The indexes for mining and for utilities both grew 0.4 percent in June. At 102.6 percent of its 2017 average, total IP in June was 1.1 percent above its year-earlier level. Capacity utilization was unchanged at 76.1 percent, a rate that is 3.3 percentage points below its long-run (1972–2025) average.
This was slightly below the consensus estimate.
Something I like to track is hotel occupancy. Last year was very difficult for hotels as international travel during the Summer months declined due to the policies and rhetoric of the current administration.
This Spring was positive for hotels, and occupancy was solid recently with the World Cup being held in the U.S..
From Costar: U.S. hotel results for week ending 4 July
28 June through 4 July 2026 (percentage change from comparable week in 2025):
Occupancy: 63.5% (+3.9%)
Average daily rate (ADR): US$167.95 (+6.7%)
Revenue per available room (RevPAR): US$106.66 (+10.9%)
The following graph shows the seasonal pattern for the hotel occupancy rate using the four-week average.
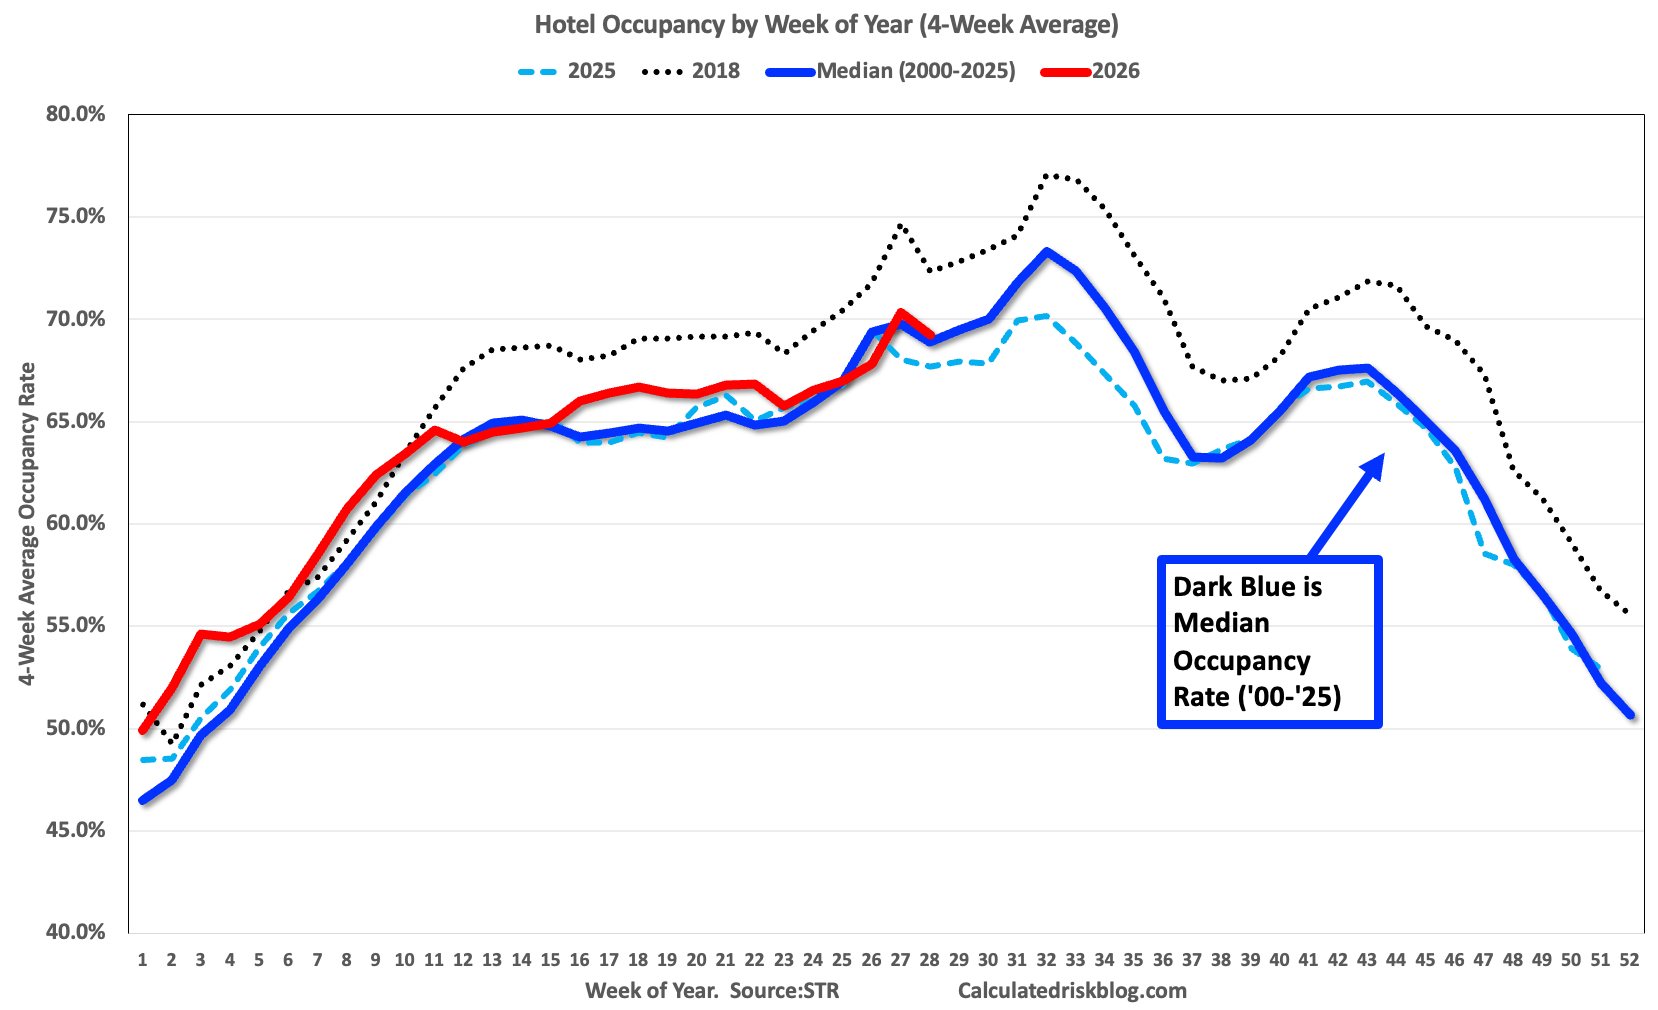
The red line is for 2026, blue is the median, and dashed light blue is for 2025. Dashed black is for 2018, the record year for hotel occupancy. The 4-week average is ahead of last year and at the median for 2000-2025.
Note: Y-axis doesn’t start at zero to better show the seasonal change.
The remainder of the Summer - after the World Cup - will be key for hotels.
Thanks for reading Economic Weekly! This post is public so feel free to share it.
No posts
Comments
Nothing yet. Say the first thing.
Sign in to join the conversation.