
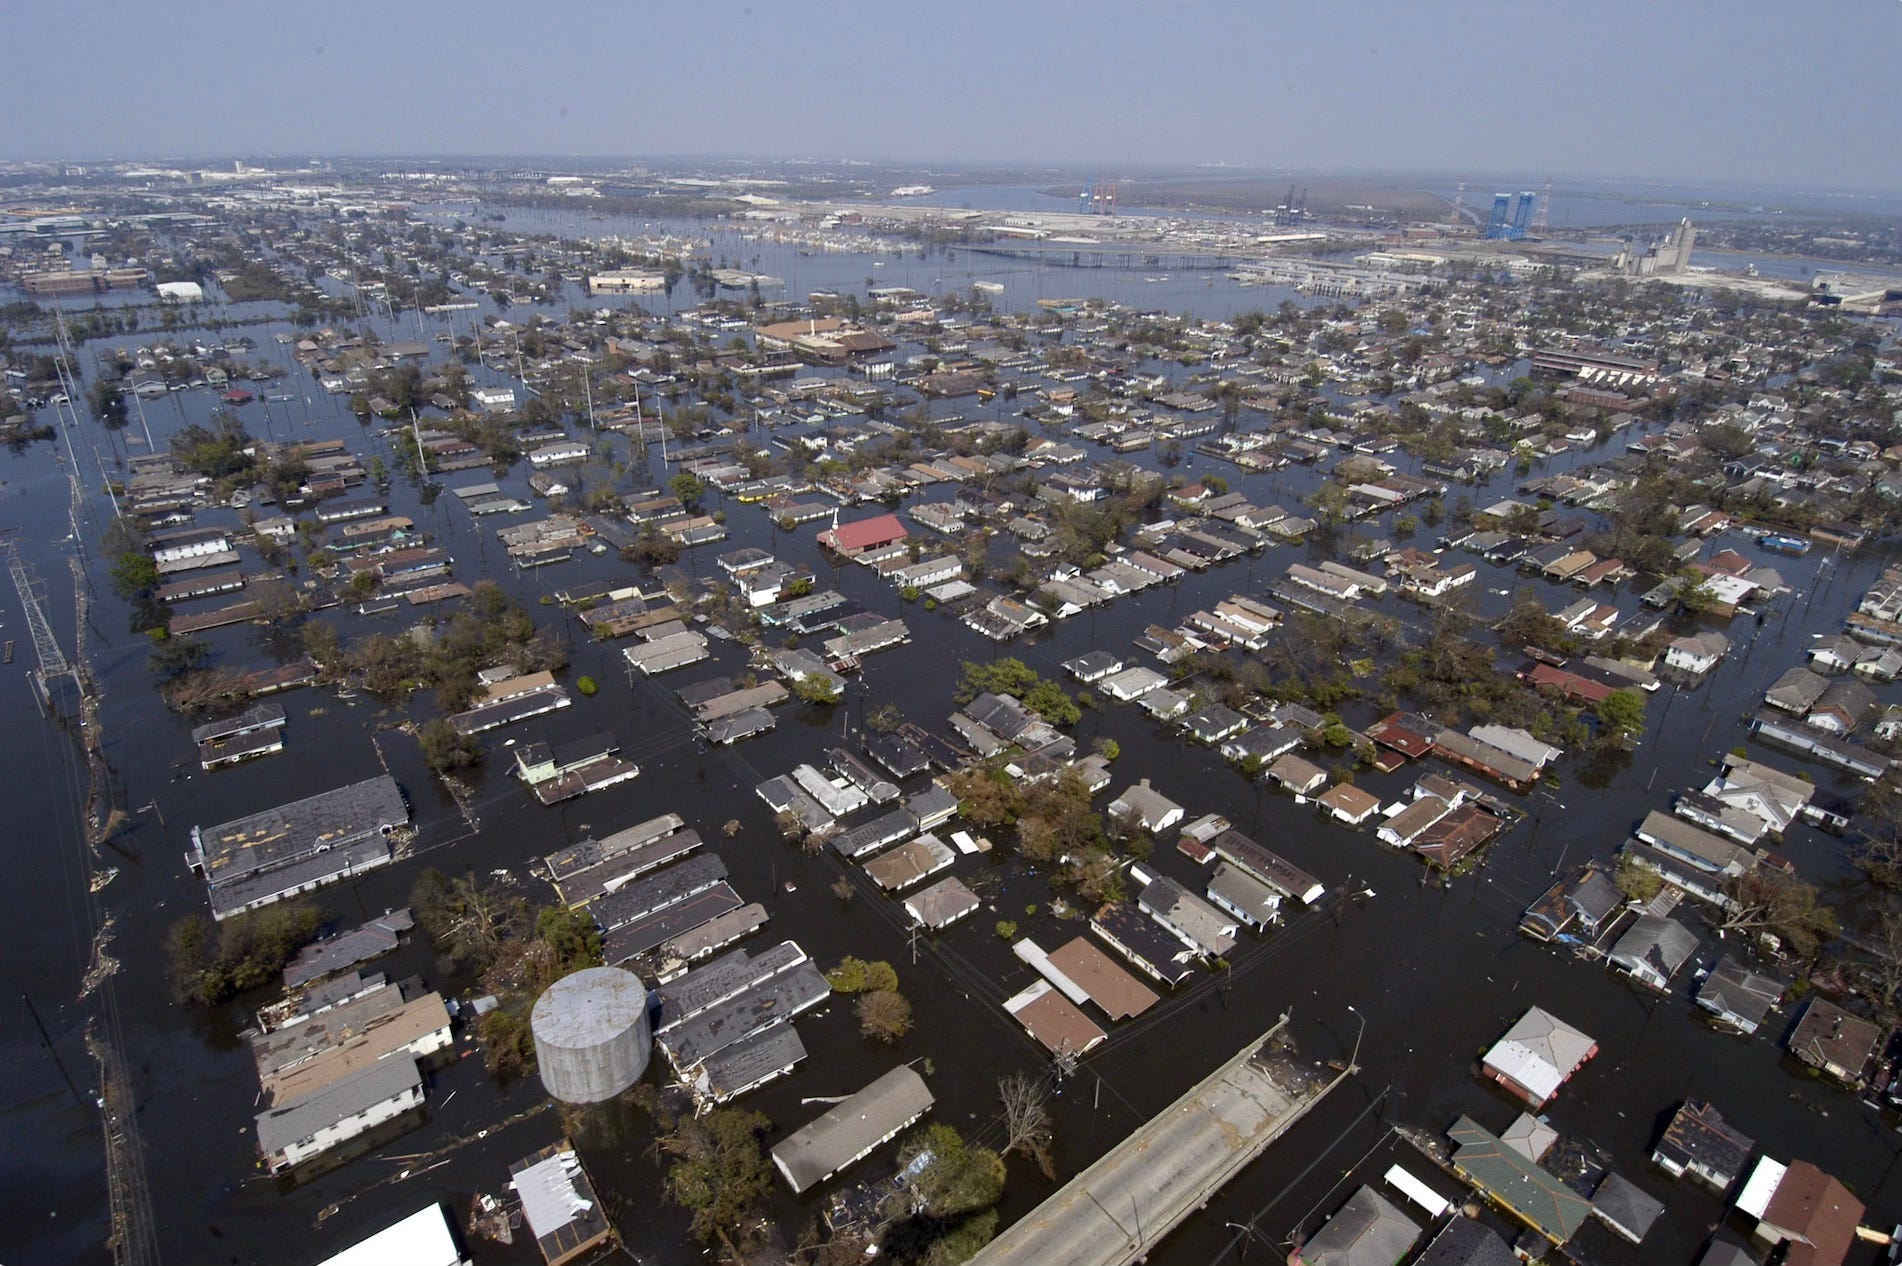
For this article I’m delighted to be joined by Gérard Collin, the Spokesperson for the Collectif Montée Des Eaux in France. The CMDE is campaigning for better coastal protection and planning in France and beyond. I’m honoured to be an International Associate Member of the organisation.
On Saturday 31st January 1953 the first 133 lives were lost to a North Sea storm that would go on to kill over 2,500. The first casualties were from the sinking of the Princess Victoria en route from Scotland to Ireland. The vast majority would die in the devastating floods that swept down the English east coast and on into the Netherlands and Belgium. The funnelling shape of the North Sea, coupled with a high spring tide drove a storm surge which peaked at 3.35m above the average sea level. The wave action caused flooding to reach areas higher than 5m above sea level. In addition to the human lives lost, it is estimated that 75,000 head of livestock was killed, 70,000 properties were damaged and almost 500,000 acres (>200,000 hectares) of farmland was inundated.1
As a result of the storm, protections and warning systems were put into place at huge expense across northern Europe. In the UK the Thames Barrier was built and completed in 1984 along with other coastal protection projects. In the Netherlands the government constructed an ambitious flood defence system beginning in the 1960s. The Delta Works is designed to protect the estuaries of the rivers Rhine, Meuse and Scheldt. The system was completed in 1998, with completion of the storm surge barrier Maeslantkering in the Nieuwe Waterweg, near Rotterdam.
But what if a similar storm were to hit today, with sea levels 25cm (1 foot) higher than in 1953 and with global warming fuelling more extreme weather events? How are countries predicting the future and what preparations are being made for even higher seas later this century? The UK and Netherland defences took over 30 years to build and we haven’t got any faster at these sorts of projects, just look at the UK’s lamentable HS2 project! We should be building now for end of the century threats, so what should that look like?
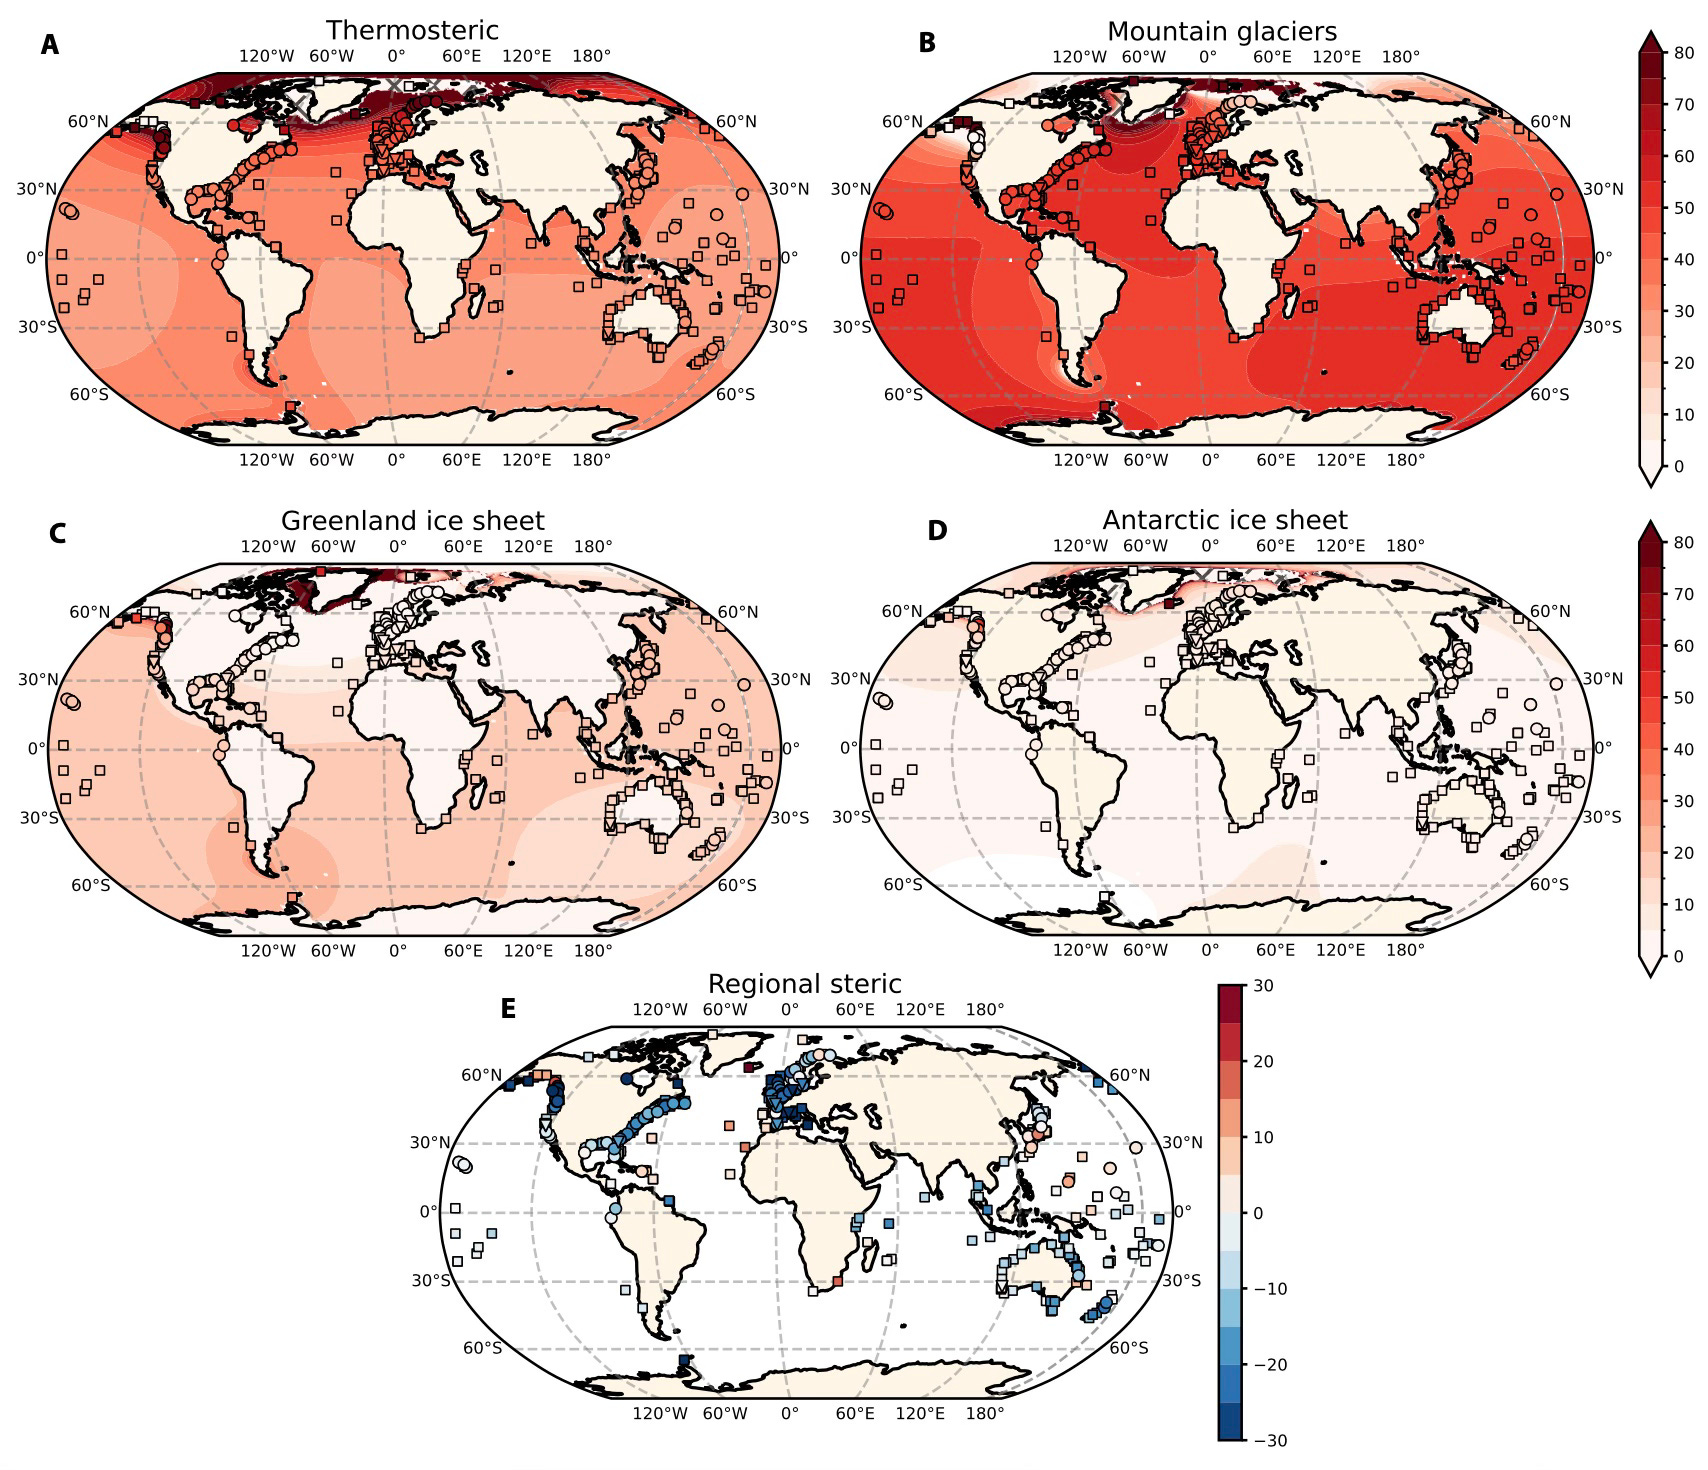
There are three basic constituents of sea level rise as it affects coastal infrastructure. There is the fact that as the climate system warms, the oceans’ heat content is rising at an accelerating rate. Water expands as it warms which raises the global sea level baseline. This thermosteric rise will continue even if net-zero is achieved as the heat distributes and mixes with cooler deeper waters. Land water entering the oceans from both the melting of land ice (including from polar regions) and the draining of aquifers (for agriculture, industrial and societal use) is the second component. The third issue is local or regional changes in land height relative to the sea level as some regions subside. This regional steric rise can be through long term rebound following ice mass removal and though the pumping out of aquifers and oil and gas deposits from deep beneath the surface.2 The rise itself is far from uniform, being affected by regional and local variability due to ocean density and circulation changes, atmospheric pressure variations and due to the gravitational, rotational and deformational effects of water and ice mass redistributions as well as vertical land motions that can affect some areas locally.3
For more on the causes of sea level rise I have another article which you can access here.
There are three main threats to coastal infrastructure linked to sea level rise and climate change; baseline level rise, storm surge height and coastal erosion.
Figure 2 shows the various model predictions for the different IPCC scenarios out to 2150. The dotted and dashed lines are the low likelihood scenarios if ice sheet stability is lower than hoped for. The solid orange and red lines are a good guide for our current trajectory, but the models used don’t account for ice sheet modelled melting, just a linear trend with temperature. Currently thermal expansion is the main contributor but this will change as Greenland and Antarctica melt rates continue to accelerate. We can therefore bank on it being at least as bad but probably worse than the solid lines.
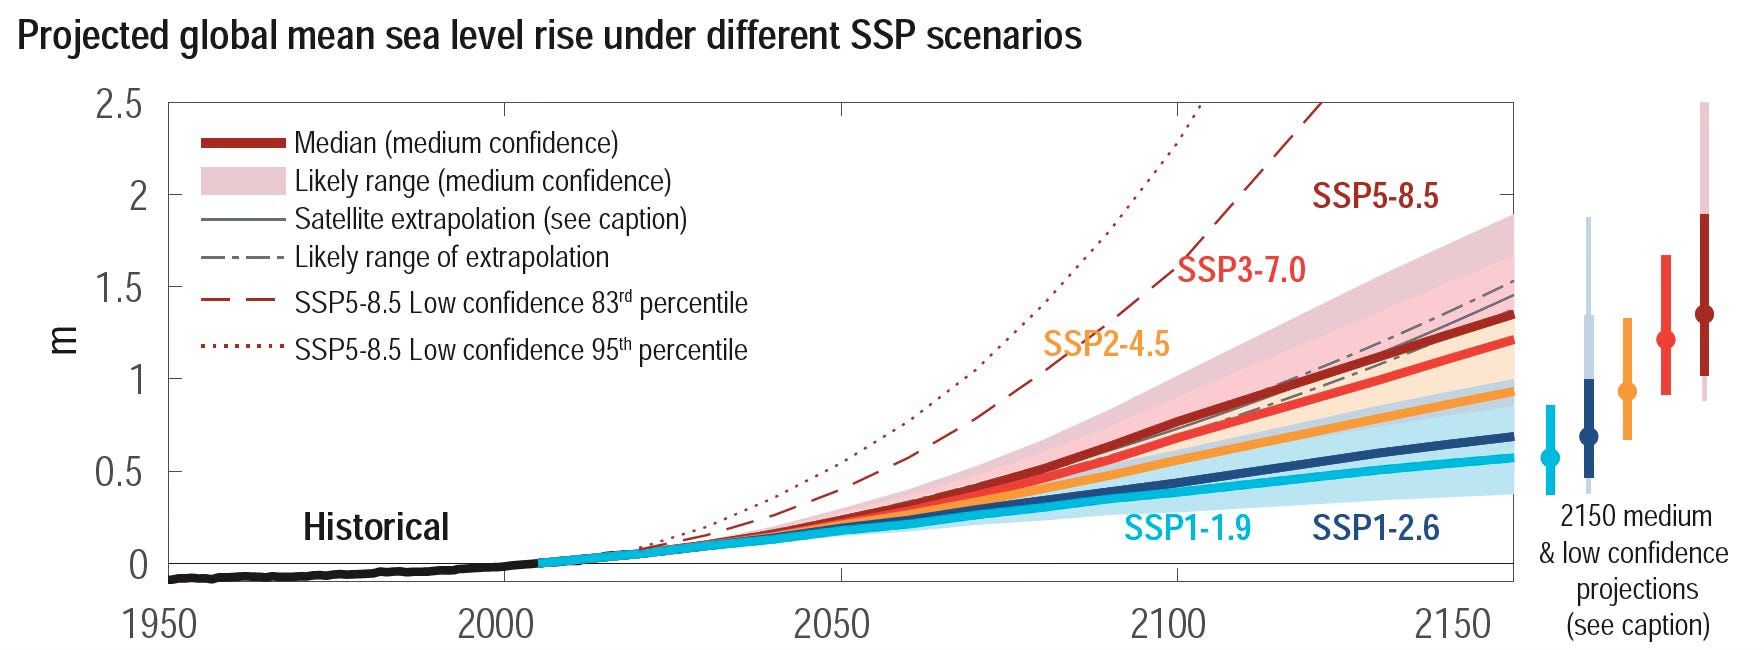
One important property of sea level rise is that it is fundamentally non linear, subject to many feedback and cascade processes, all of which make prediction difficult. The other characteristic, different from atmospheric temperature rises, is that sea level rise cannot ‘overshoot’: there is no lowering again for millennia. They will only drop again when the next glaciation event starts - and we’ve already cancelled the next one as the CO₂ levels are too high to trigger it through the next orbital cycle.
There are obvious ramifications for coastal infrastructure through this gradual, albeit accelerating, average rise. Ports will need to modify loading facilities to account for ships sitting higher against quays. Saline waters will reach further inland at river mouths increasing the corrosion rate of steel structures and the steel reinforcement within concrete piles and foundations. This form of ‘concrete cancer’ is well known for coastal infrastructure even above the waterline, but a 2017 study found that for a standard coastal concrete structure engineered for a 50-year service life, the combined impact of global warming and SLR slashes that operational lifespan immediately by roughly 5%, requiring earlier and more aggressive structural interventions.4
Of course some properties and facilities may need to be abandoned or raised to avoid inundation during spring tides and so on.
The real danger though, just like in 1953, comes from storm surges. There are two factors within a storm system that locally raise sea levels. Wind action literally pushes water ahead of the storm where it piles up, and the low atmospheric pressure of the storm pushes down less on the surface allowing it to rise, drawing in water from the surrounding seas. The effects can be huge. The 1953 storm delivered 3.35m of surge but these more recent events were even higher:
Hurricane Ian (USA) September 2022: Up to 4.6 metres (15 feet)
Cyclone Idai (Mozambique) March 2019: 4.4 metres (14.4 feet)
Cyclone Amphan (India & Bangladesh) May 2020: Up to 5 metres (16 feet)
Hurricane Dorian (The Bahamas) September 2019: 6 to 7.3 metres (20 to 24 feet)
Typhoon Rai / Odette (Philippines) December 2021: Up to 4 metres (13 feet)
One of the most worrying trends is that storms and tropical cyclones are increasingly “stalling” near coastlines (as seen with Hurricanes Dorian and Ian), meaning the surge is sustained over multiple high-tide cycles rather than striking quickly and receding. A 2018 study analysed global historical data from 1949 to 2016 and found that the translation speed (the speed at which the storm moves forward from place to place) decreased globally by 10% in that time. Crucially from a coastal protection perspective, the slowdown was much more severe when storms crossed over land, leading to a 20% slowdown in the North Atlantic and a 30% slowdown in the Western North Pacific.5 The study links this directly to global warming causing a general weakening of summertime tropical atmospheric circulation (the large-scale “steering winds” that push cyclones along). A second recent study has found that the length of the intense tropical cyclone season has also increased.6 They found a global lengthening of season of 10–14 days/decade across all basins, equivalent to a 7.4–22% increase.
Coming on top of baseline sea level rise, the implications for coastal planning and protection are profound. How much longer do flood protection measures such as the Thames Barrier or the Delta Works have before they are breached and effectively worthless?
Storms are also bringing higher levels of rainfall as the warmer climate allows the air to hold more moisture. Flooding events in coastal regions linked to storms add to the danger from rivers beaching their banks or not being able to drain to seas that are already at a high level. The Valencia tragedy of 2024 is a salient example.
Storms have always eroded coastlines. The famous fossil hunter, Mary Anning took advantage of this fact to look for and discover incredible fossils in the early 1800s on the beaches of Lyme Regis, part of the UK’s Jurassic Coast. She would venture out onto the newly eroded cliffs to examine what the fresh rock falls had revealed. A practice still employed today by amateurs and professionals alike.
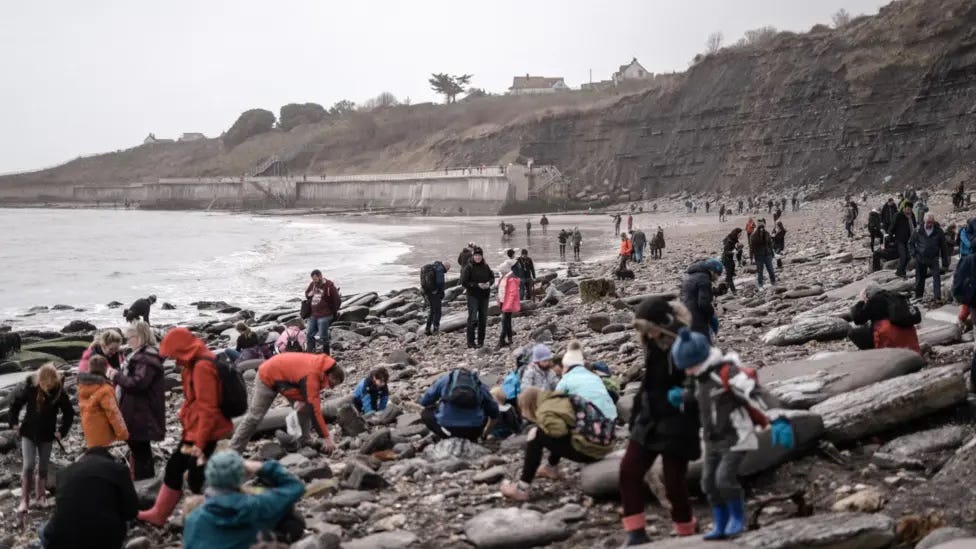
When it comes to property and infrastructure at the top of these cliffs, or even behind sand banks and wetlands, erosion brings serious hazards and in many locations, inevitable losses.
Saline intrusion occurs when the rising seas force salt water into coastal aquifers making the ground water increasingly brackish. A 20 year study of the Bengal delta in Bangladesh found that salination was experienced even 200km from the coastline in the low lying delta.7 This has collapsed local agriculture and resulted in more than 10 million people having to abandon their homes and livelihoods and move to slums outside the major cities. Similar problems are likely in other low lying land masses and deltas such as the Nile in Egypt, Norfolk in the UK, Flanders in Belgium and Holland and southern Florida, to name a few.
There is inevitably a trade off between the costs of building defences and the costs of potential losses, but first the question has to be asked: What level of sea level rise is it pragmatic to plan for? This is no longer down to scientific or IPCC reports, but political decisions: what must we responsibly prepare for? The decisions need to be based on risk apatite and will vary for different situations.
The Hinkley Point C nuclear power plant being constructed in the UK sits on the coast and is sea water cooled. This is being built with a two level storm surge protection system.8 Firstly a sea wall will extend to 13.5m above current average sea level. The main platform is then at 14m above the current average level. The design criteria was based on a 1-in-10,000 year storm on top of predicted sea level rise for the operational and decommissioning lifespan which could create a surge of 11.5m including wave overtopping. There is therefore an additional 2m of safety margin before the station platform could be inundated. A similar approach is followed for next French nuclear EPR’s.
If future climate tracking shows that actual sea-level rise or storm surges are outpacing the initial projections used for the Hinkley C design, the safety case dictates that the operator must implement engineered modifications. The structural foundations of the sea defences are reinforced so that the height of the wall can be physically raised or supplemented with further barriers in the future if a worst-case, non-linear ice sheet collapse scenario begins to manifest.
That’s all very sensible and reassuring for a new-build nuclear reactor, but what level of rise should be anticipated for existing infrastructure, private property and other less critical building projects?
Different countries are adopting different approaches and measures. The new 2026 Code of Practice on Coastal Protection issued in Singapore9 uses a sea level rise of 2.15m by 2150 as the standard for all coastal protection measures. This applies to new and existing structures alike, with building modifications demanded as appropriate.
In the UK, the Environment Agency and maritime authorities structure their flood risk assessments for critical infrastructure through standard UK planning policy operating on an “Adapt for 2°C, plan for 4°C” approach, leaning on the upper percentiles of the high-emissions scenario (RCP 8.5) and exploring extreme contingency scenarios:
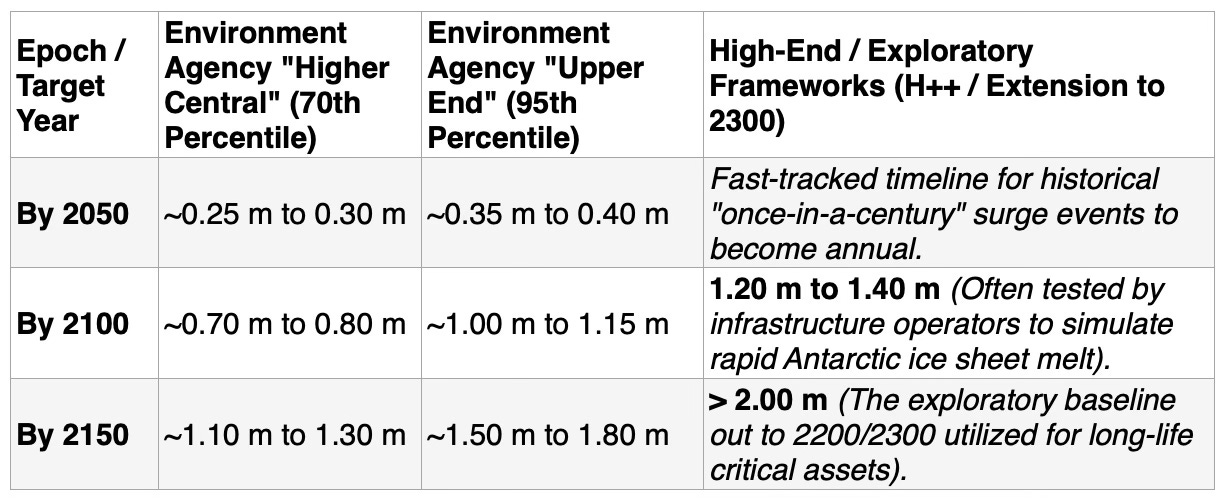
Given the recent acceleration in global warming especially in ocean heat content, this now seems inadequate for a high-end approach. This view is echoed by the Collectif Montée Des Eaux in France who are pressing their government and local authorities to prepare for a sea level rise of 1.20 m by 2100 and 1.50 m by 2125, and 2 m for new private buildings (with reference to pre-industrial ages). Currently French ports are planning for levels well below this pragmatic request. Le Havre is planning for just 0.6m, as is Bordeaux, Cherbourg, Dunkirk and La Rochelle. A new ferry terminal at Brest is only planning for 1m, as is Marseille.
For several years, France has been due to update it’s national reference which currently dates back to 2011 which is still only 0.60 m by 2100. This still applies in particular to new constructions via Plan Local d’ Urbanisme. For planning purposes, most modern countries anticipate over, if not well over, 1 m sea level rise by 2100 and rising after that. 2m is due next century no matter what, so arguing as to when exactly this will occur is a secondary issue. In addition, most modern countries incorporate a multi-layer plan according to the degree of security and to the life span attached to the project. For instance, New Zealand uses a 3-stage plan from + 1,2 m to + 1,7 m by 2130, plus Vertical Land Movement (VLM, subsidence). Similarly, San Francisco is preparing in extremes cases for up to 2.75 m by 2120. Incidentally, VLM is of major concern to many locations as it adds to sea level rise; although for some fortunate regions it can be positive, as is the case of Helsinki and Greenland which ‘surges’ upwards as its glaciers melt. Beyond that, there are differences between oceanic regions, often depending on the source of the water. Melting in Greenland increases levels in the Southern Hemisphere due to a lowering gravitational pull as the ice mass reduces.
Although we’re discussing a global average rise, the rates vary considerably in different parts of the world as the charts in figure 4 show. This is from the official 2025 French Government Sea Level Rise report, based on a 3°C by 2100 trajectory.10 Note the increased rise in the Northwestern Atlantic.
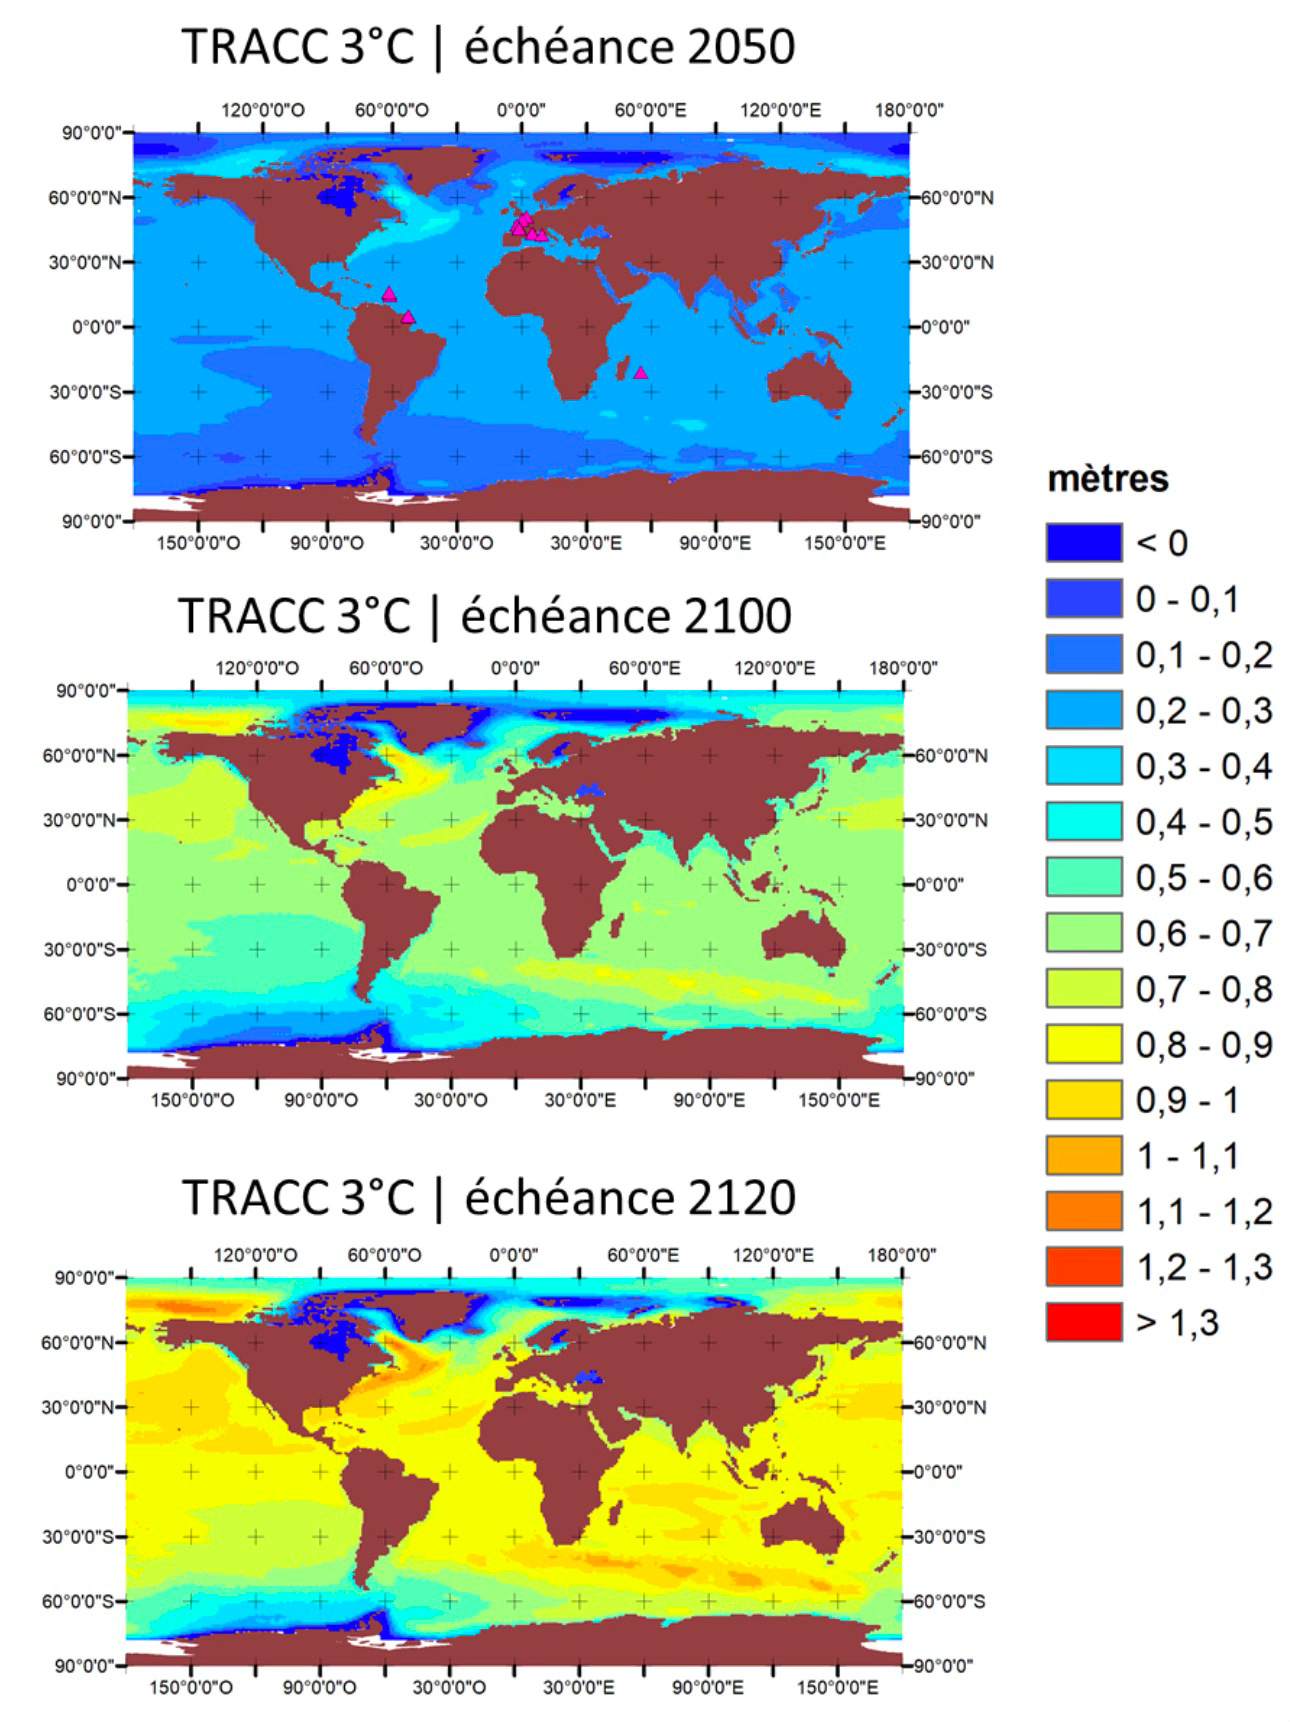
Northern European and east coast US and Canada ports also need to consider the implications of a slowdown of the Atlantic Meridional Overturning Circulation (AMOC), which will increase the rate of rise adding a further 0.5 - 1m of sea level on top of the global average to this regions.11 This won’t be a sudden switch when the current has stopped but a gradual effect as it weakens. Some recent research suggests a 51% reduction in AMOC strength by 2100, so the North Atlantic should be planning for 0.25-0.5m of EXTRA sea level rise this century, on top of the global average. Studies suggest that this will effect the western Atlantic more than the east, but a jump of 40cm could be experienced in the North Sea region following an AMOC collapse.
Practically all of the top 15 global port cities are directly threatened by sea level rise this century. The top port, Shanghai, is perhaps the most notable, including effects on its 27 million inhabitants. In France the three leading ports by annual tonnage, Le Havre, Marseille, and Dunkirk, are all directly threatened.12
In addition to cargo ports, thirteen high traffic global oil ports which take supertankers are also at severe risk at 1m of sea level rise. These are: Houston (US), Ust-Luga (Russia), Rotterdam (Netherlands), Ras Tanura (Saudi Arabia), Khor Fakkan (UAE), Dalian (China), Gwangyang (South Korea), Shanghai (China), Ningbo-Zhoushan (China), Singapore, Galveston (US), Yanbu (Saudi Arabia), Fujairah (UAE).
However well before 2100, the oil industry will have ceased to exist - won’t it?
There are also other chemical and industrial storage and processing facilities close to the 1m line around the world, not to mention fisheries, leisure beaches and marinas. All face the same issues with the same timeline, though with a very wide range of budgets and capabilities.
In terms of domestic property, the UK makes a good case study. By 2100, the scale of exposure across England’s coastal zones expands significantly, covering both direct permanent erosion and frequent tidal inundation.
Coastal Floodplain Exposure: Today, over 540,000 residential and 72,000 non-residential properties sit within England’s coastal floodplain.13 Even with existing defences considered, tens of thousands remain exposed to high-frequency flooding.
Properties Threatened by 2100: Estimates from the UK’s Climate Change Risk Assessment (CCRA3) project that approximately 82,000 properties in England are at risk of complete loss due to coastal erosion by the end of the century.14
The Policy Pressure Point: If global temperatures rise between 2ºC and 4ºC, roughly 1,600 to 1,900 km (around 30%) of England’s shoreline currently designated under a “Hold-the-Line” policy will face unsustainable pressure to realign, directly threatening 120,000 to 160,000 homes and commercial buildings.
Financial Value: The direct capital value of assets at risk runs into tens of billions of pounds, with annual financial damages from coastal erosion alone projected to rise from historical averages of £15 million to upwards of £126 million under worst-case scenarios.
There are three main options to manage sea level rise that are being discussed and implemented:
Hold the Line: Build up sea defences to combat sea level rise. This includes raising the height of sea walls, local gates and coastal defences as an incremental engineering task. This mainly involves asset-level protection rather than an all encompassing wall. The exception to this is where large areas need protection such as in Singapore and Manhattan. Ports like Dover and Southampton in the UK are following this approach. London recently brought forward plans for a new line of defence on the Thames by 15 years. Many ports believe they are following this policy, but some are dangerously underestimated rates and levels of rise, as mentioned above.
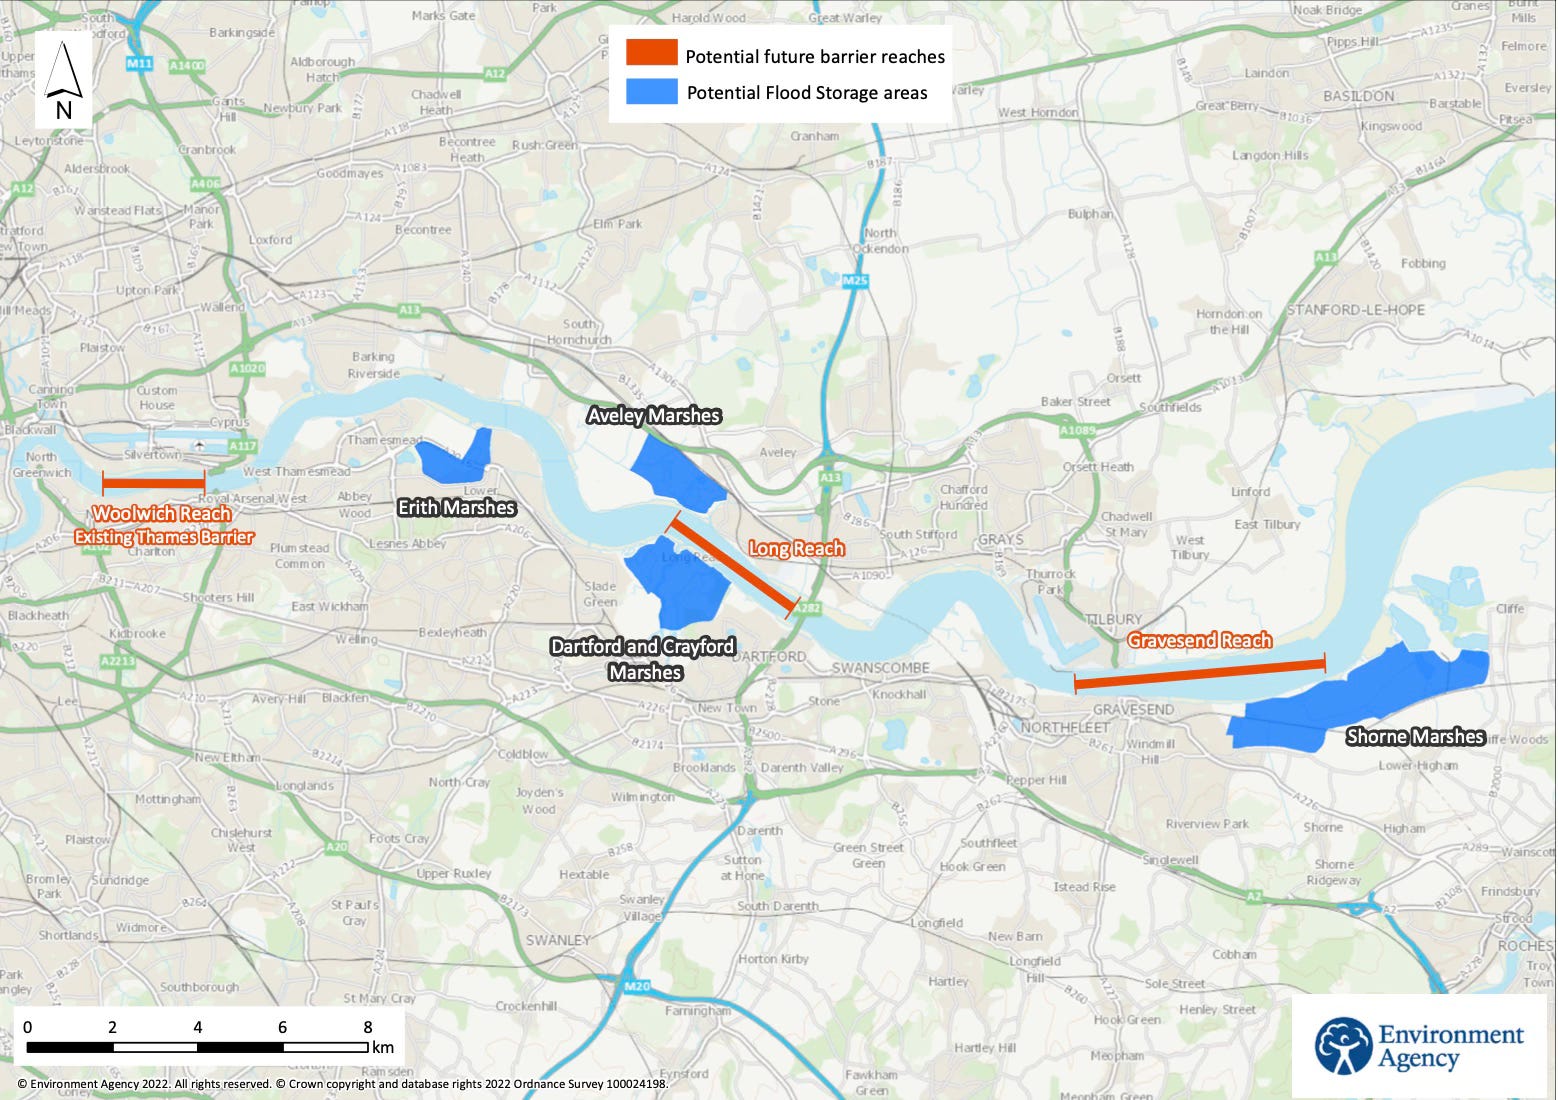
Managed Realignment: Under this strategy, defences are moved further inland creating natural barriers and buffers that can absorb both wave energy and water level. This has the advantage of creating ecologically rich areas that support wildlife in addition to protecting human infrastructure. These can vary from wetlands to sandbanks and mangrove swamps. Often structures on the old coastline will have to be removed, but they were highly likely to become unusable in the short term anyway.
Retreat (no active intervention): Simply let nature take its course. This is often the case where the assets under threat simply do not warrant the cost of taking any serious action.
Like many aspects of the climate crisis the economic impact is likely to hit the insurance sector first. The inability to secure affordable insurance then has a knock-on effect on property prices, asset purchases and the ability of companies and families to secure loans and mortgages.
In the UK, for coastal flooding, the UK insurance industry and government established Flood Re in 2016.15 Flood Re is a public-benefit reinsurance scheme funded by a statutory levy on all UK home insurance policies. It allows insurers to pass the high-risk flood portion of a policy to Flood Re at a capped, subsidised rate, keeping home insurance widely available and affordable for flood-prone households. The scheme is due to run to 2039 and a transition plan is being developed. Interestingly it can’t be used for properties built after 2009 (as they should have known better), but this does not seam to have put off developers who continue to build on flood plains.
In the UK, there is no compensation scheme for property lost through coastal erosion and it is practically impossible to get insurance against it. The best private property owners can hope for is up to £6,000 to cover safe demolition and planning easements for building further inland. There is also no statutory right to compensation for property loss caused by natural coastal erosion or flooding. Landowners are legally considered to bear the historical risk of changing environments.
By contrast, so far France has indemnified owners whose properties had to be moved (e.g. Saint-Pierre-et-Miquelon) or destroyed (Soulac, Treffignac); but the expected longevity of this policy is in doubt. Insurance companies show an increasing reluctance to cover damages which once were assumed to be rare but are now become more and more frequent. As an example, reports indicate that extreme events (storms coinciding with spring tides) will increase by 100 times by the end of the century in the Mont-Saint-Michel Bay; i.e. a centennial event will become annual. Such events threaten both sides of the Channel!
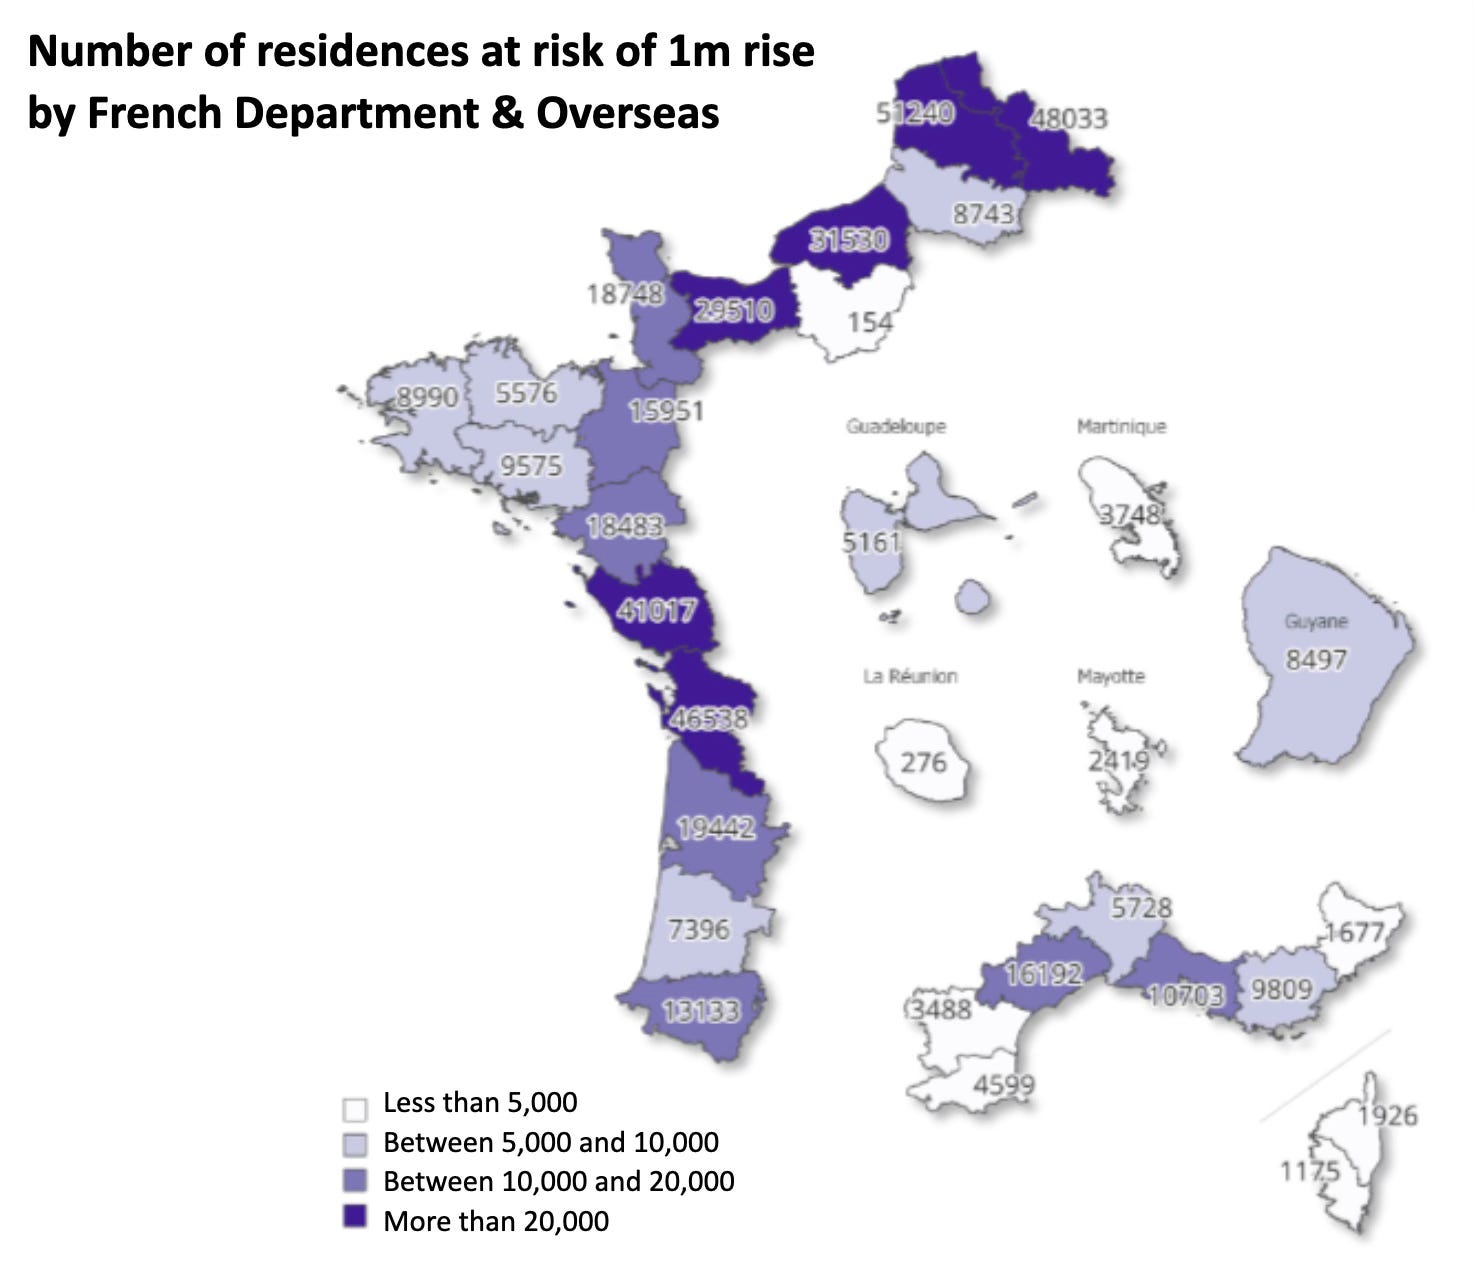
According to CEREMA, the cost of sea level rise in mainland France alone will approach €100 billion by 2100, with nearly 500,000 homes affected. This is without even factoring in private businesses or the costs borne by local authorities: roads, railways, ports and airports, hospitals, schools, etc. And all of this is based on a +1m rise by 2100, which is far from being the worst-case scenario.
In this article we’ve focussed mainly on our home areas of France and the UK. But what plans are in place for your areas of the world? Do you live near the coast, or rely on infrastructure that is within 5m of the current sea level? Have you noticed flood frequency or extent increasing over the time you have lived there? Have you experienced difficulty getting affordable insurance and are their schemes similar to the UK’s Flood Re that lower the costs?
How do you think your coastline will change in the coming decades, and how will your community adapt?
We’d love to hear your thoughts in the comments. If you are based in France and would like to know more about the CMDE, please visit their website and signup for the newsletter.
If you found this article interesting or useful, please tick the ❤️ button as it helps the algorithm point more people in this direction and gives us feedback on what subjects are most useful. Thank you!
For more on the causes of sea level rise, you might like this recent article:
Rising Concerns - Sea Level Rise and its Causes
·
Jun 3
A new study has been published which reduces the uncertainty of the various contributors to sea level rise since 1960. The analysis breaks down the contributions of thermal expansion, ice melt and land water storage. The findings, when linked to other recent studies, suggest the rises we should be planning for are, at best, on the high side of previous …
Gao, X.-J.; Wang, X.-Y. Impacts of Global Warming and Sea Level Rise on Service Life of Chloride-Exposed Concrete Structures. Sustainability 2017, 9, 460. https://www.mdpi.com/2071-1050/9/3/460
Sean E. Feist, Mohammad A. Hoque, Md. Atikul Islam, Ashraf Dewan, Mike Fowler, Sea-level rise drives changes in salinisation patterns in low-lying Bangladesh, Ecological Indicators, Volume 176, 2025, 113543, ISSN 1470-160X, https://doi.org/10.1016/j.ecolind.2025.113543
EDF Energy (2011). Hinkley Point C Development Consent Order (DCO) Application: Environmental Statement - Volume 2, Chapter 18: Marine Ecology and Flood Risk. (Infrastructure Planning Inspectorate Reference: EN010001).
van Westen, R. M., Katsman, C. A., and Le Bars, D.: Dynamic and Steric Sea-level Changes due to a Collapsing AMOC in the Community Earth System Model, EGUsphere [preprint], https://doi.org/10.5194/egusphere-2025-5102, 2025.
French language video:
Comments
Nothing yet. Say the first thing.
Sign in to join the conversation.