

Most engineers learn system design the hard way.
They read long articles about individual components, watch videos about specific technologies, and accumulate knowledge that never quite assembles into a coherent picture.
They know what a load balancer is and what a cache does, but when they sit down to design a real system, the pieces do not connect naturally.
The fastest way to build a coherent mental model of system design is through diagrams.
A good diagram shows not just what a component is but how it connects to others, which direction data flows, and what the system looks like when multiple components work together.
Forty of them, organized in a logical sequence, give you the full field in one sitting rather than scattered across months of reading.
This post is that one sitting. Forty diagrams, each explained concisely with what to draw, when it applies, and the trade-off behind it.
Read it straight through once to build the complete picture. Return to specific diagrams when you need to use them.
By the end, you will have a visual vocabulary for system design that makes every future component you encounter easier to place and understand.
What it shows: The foundational three-tier structure that underlies almost every web application.
Draw a client on the left connected by an arrow to a load balancer.
From the load balancer, draw arrows to three application servers arranged vertically, each labeled stateless.
From each server draw an arrow to a single database on the right labeled primary.
This is the starting point for every system design answer. Every other diagram in this post adds to or modifies this base.
The load balancer distributes traffic, the stateless servers handle requests independently, and the database persists data. Nothing about this design is optimized. Everything is a single point of failure waiting to be addressed.
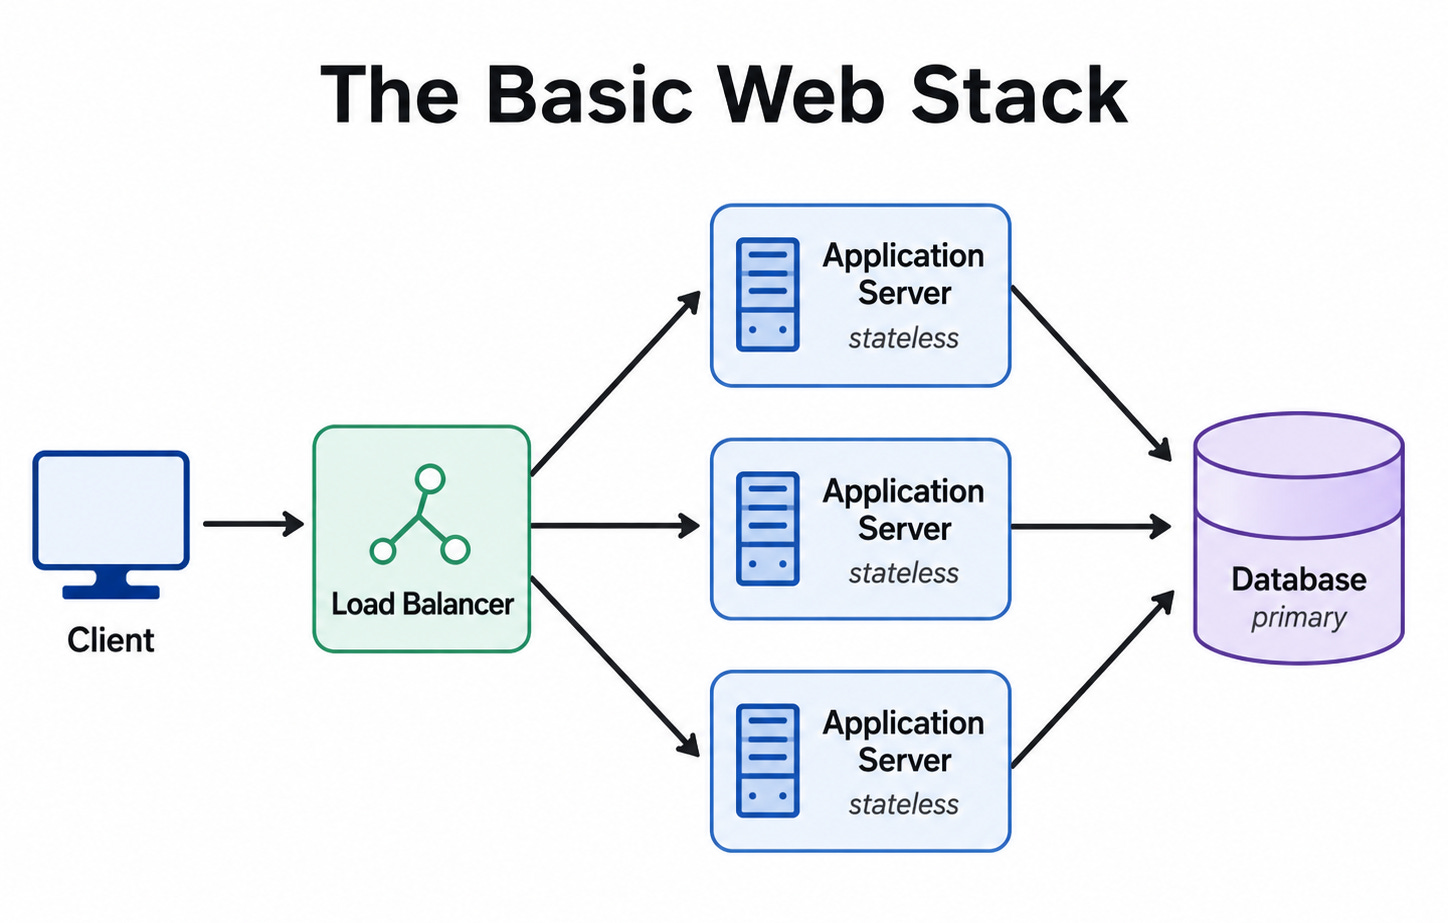
Trade-off: The database is a write and read bottleneck. The load balancer is a single point of failure. Both must be addressed as the system grows.
What it shows: Why statelessness is the prerequisite for horizontal scaling.
Draw a load balancer on the left.
Draw five servers behind it.
Draw a shared session store (Redis) connected to all servers. Label the servers stateless with a note that session data lives in the shared store.
Draw arrows from any server to any other server to show that any server can handle any request.
Without statelessness, the load balancer must route each user to the same server that holds their session, destroying the flexibility that makes scaling work. Moving session state to a shared external store makes every server identical and interchangeable.
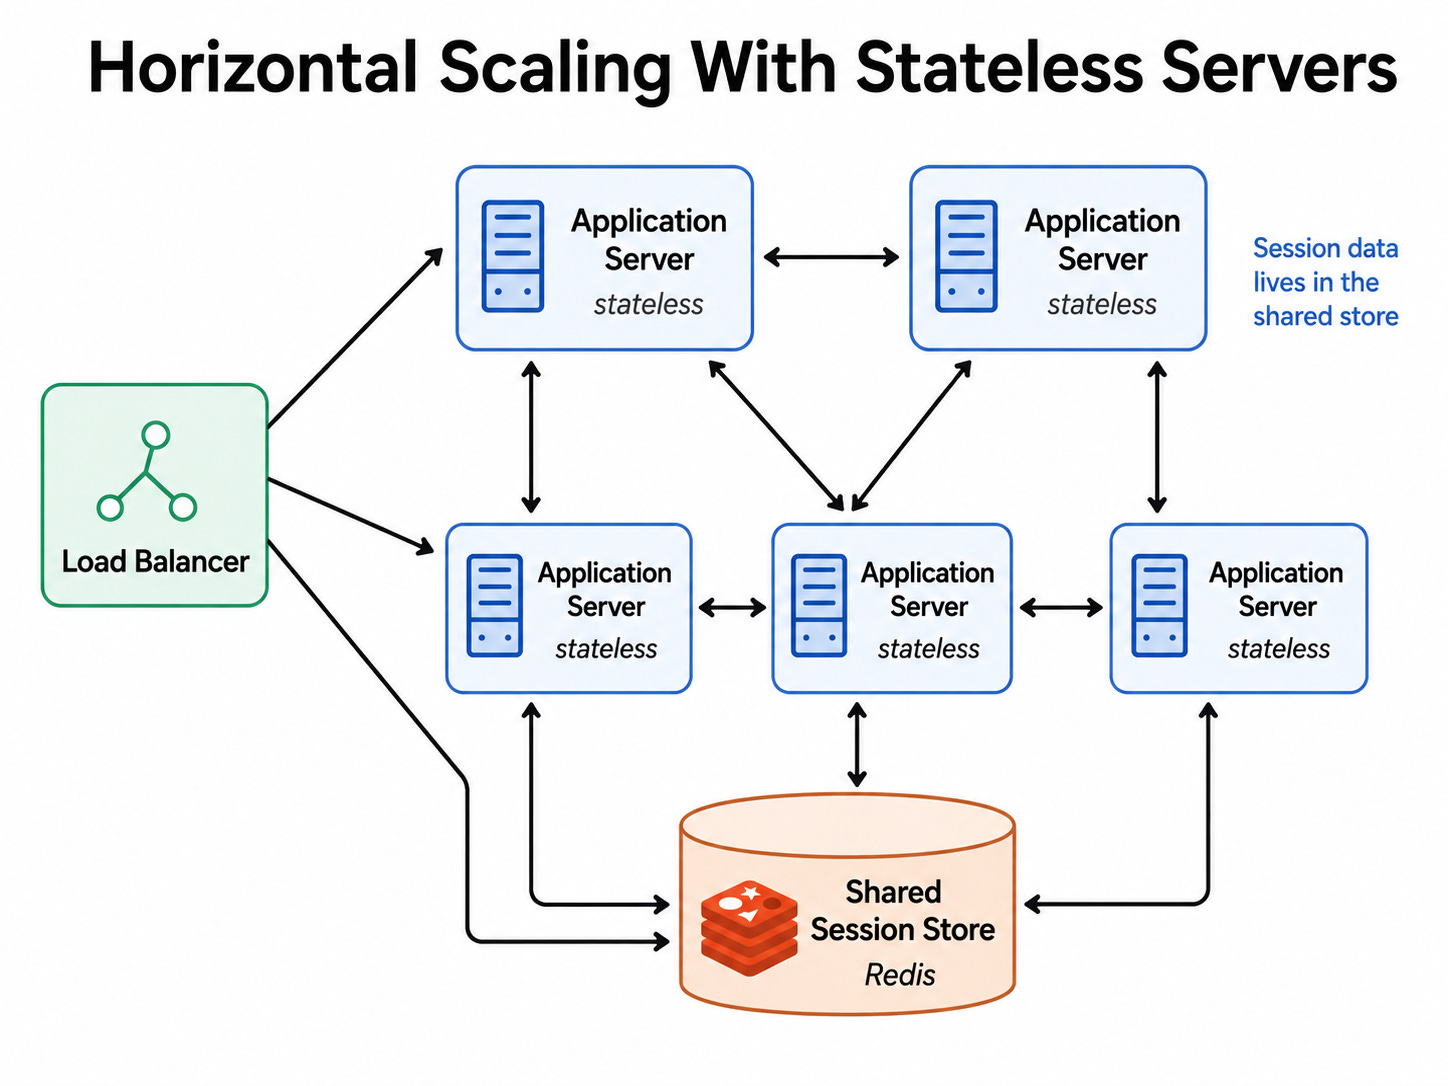
Trade-off: The shared session store becomes a dependency. If it fails, all servers lose access to session data. The store must itself be highly available.
What it shows: How a system survives the failure of its primary instance.
Draw a primary server on the left labeled active, handling all traffic.
Draw a standby server on the right labeled passive, receiving replication from the primary but handling no traffic.
Draw a health monitor above both.
Draw a failover arrow from the passive server with a label promoted when primary fails. Show traffic redirecting to the formerly passive server after promotion.
Active-passive is the simplest form of high availability. One machine runs and another waits. The cost is wasted capacity in the passive instance. The benefit is a simple failure recovery path.
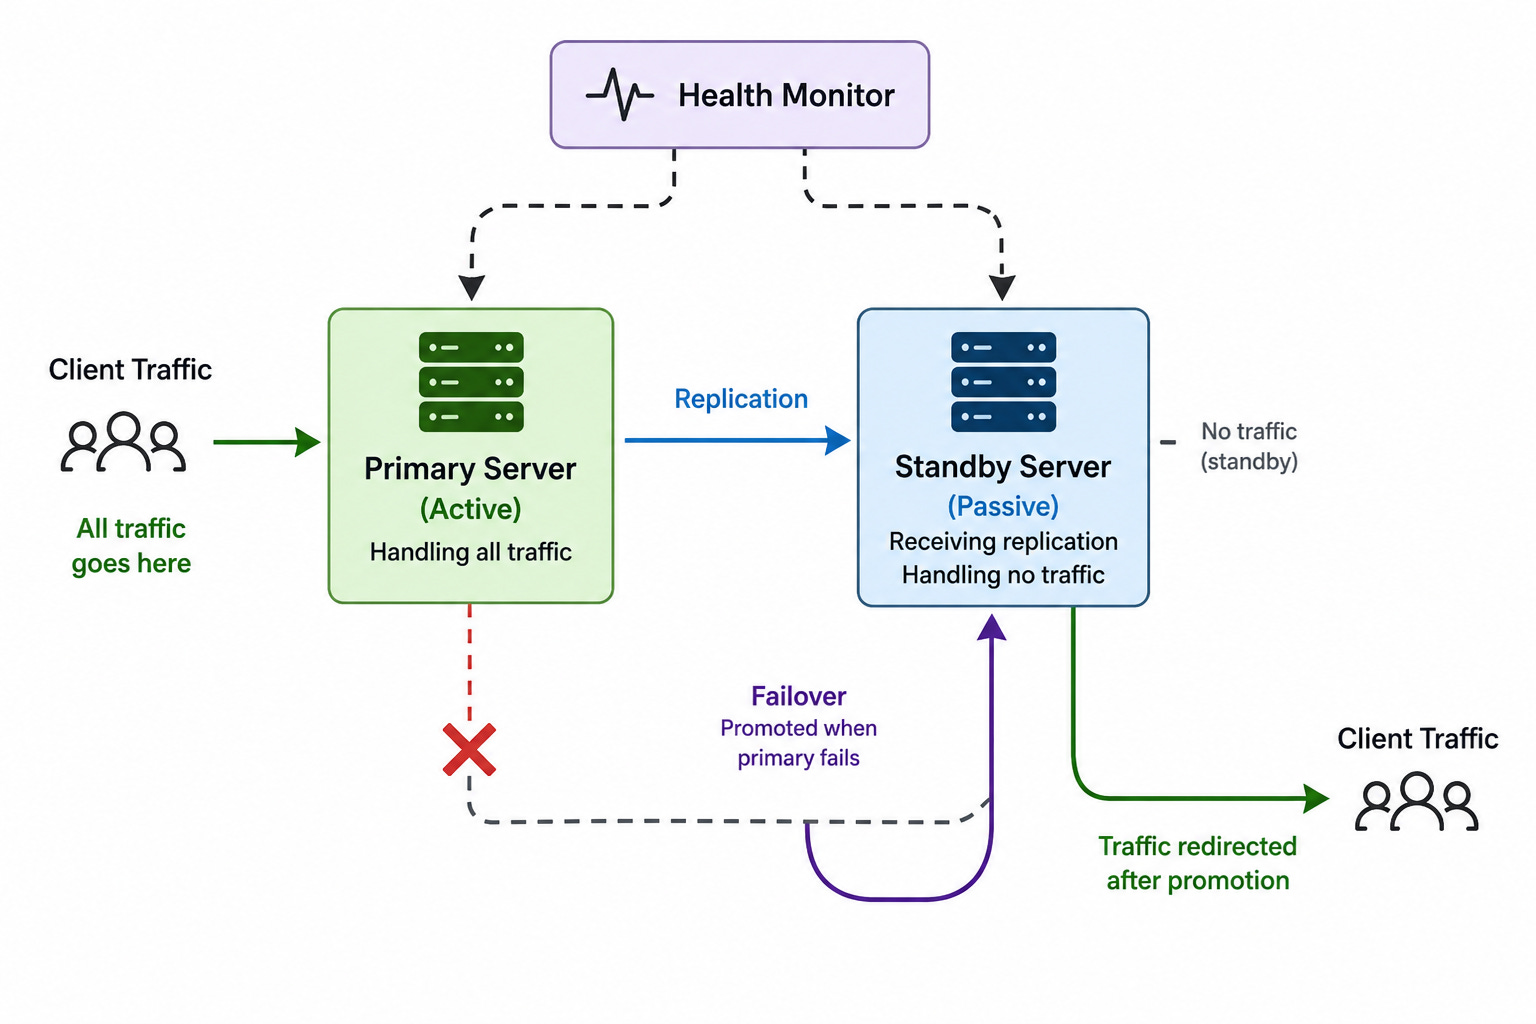
Trade-off: The passive instance pays for capacity it does not use under normal conditions. Failover is not instant and the window during promotion is a period of reduced availability.
What it shows: How multiple identical instances share traffic simultaneously for both capacity and redundancy.
Draw a load balancer at the top.
Draw four server instances behind it all labeled active.
Draw arrows from the load balancer to all four with a round-robin or least-connections label. Show one instance failing with an X and the load balancer automatically redistributing traffic to the remaining three with no failover step required.
Active-active uses all instances productively rather than holding one in reserve. When one fails, traffic redistributes automatically without a promotion step.
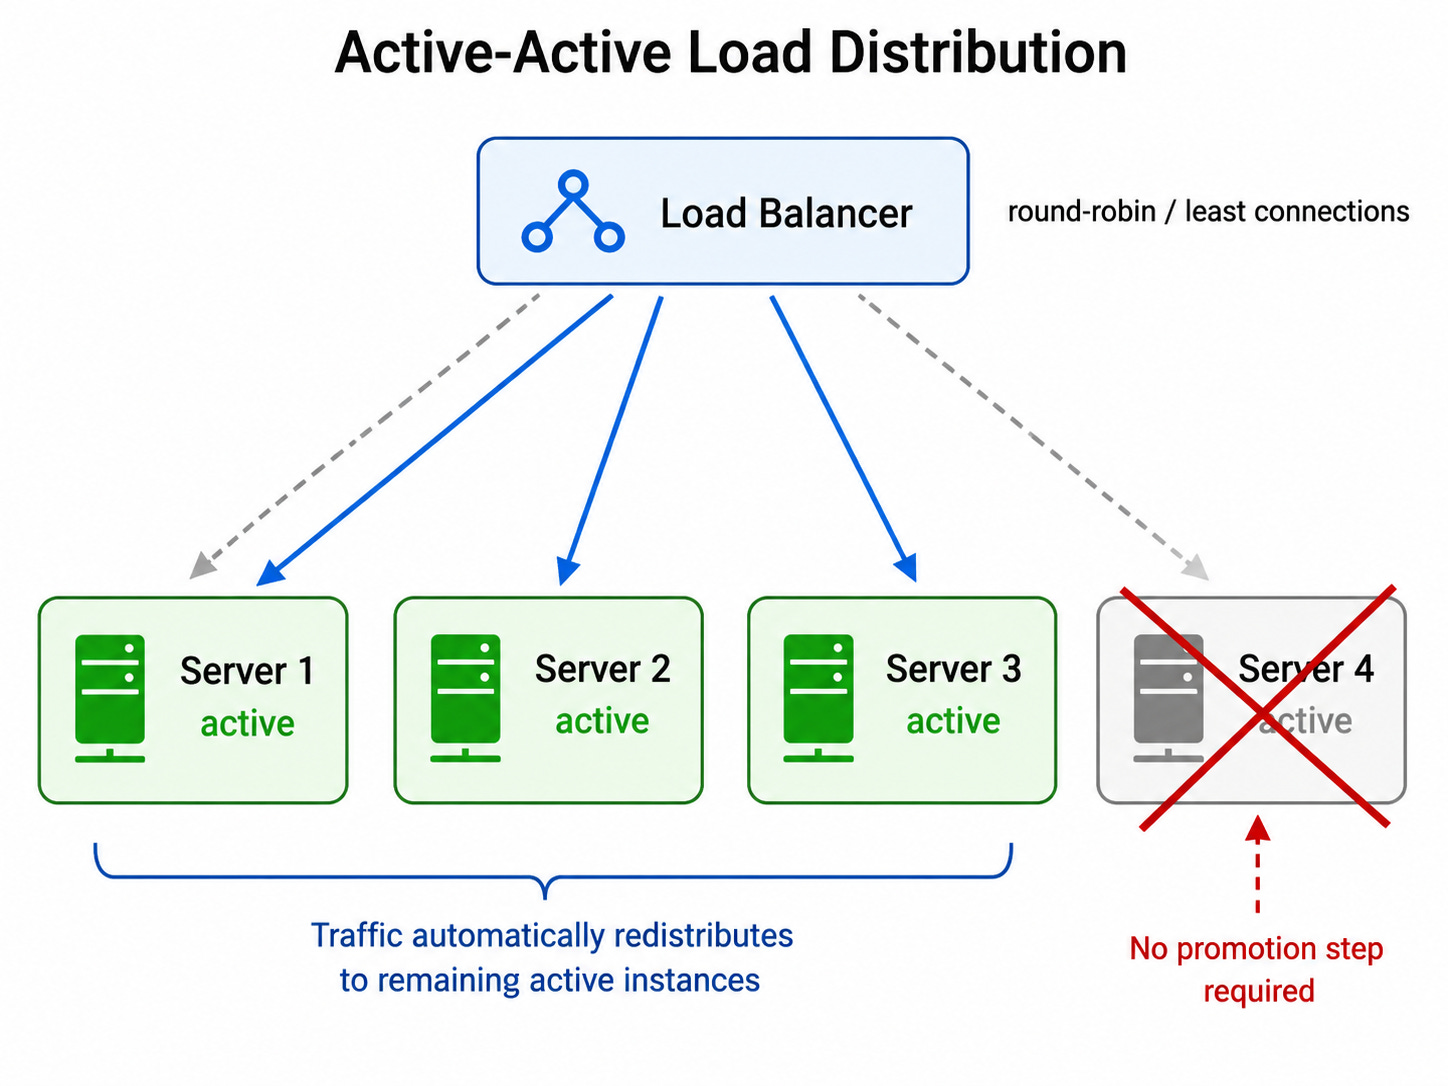
Trade-off: Active-active requires stateless services or shared state. It provides no spare capacity headroom because all instances are already serving traffic.
What it shows: How static content reaches global users with low latency.
Draw users in three geographic regions (Americas, Europe, Asia) on the left.
Draw CDN edge nodes near each region.
Draw arrows from users to their nearest edge node labeled static content, served from cache.
Draw a longer arrow from the edge nodes to a central origin server labeled cache miss, fetch from origin. Separate the path for dynamic requests with a direct arrow to the application server bypassing the CDN.
The CDN serves the same content to many users without hitting the origin. Geographic proximity is the key mechanism reducing latency.
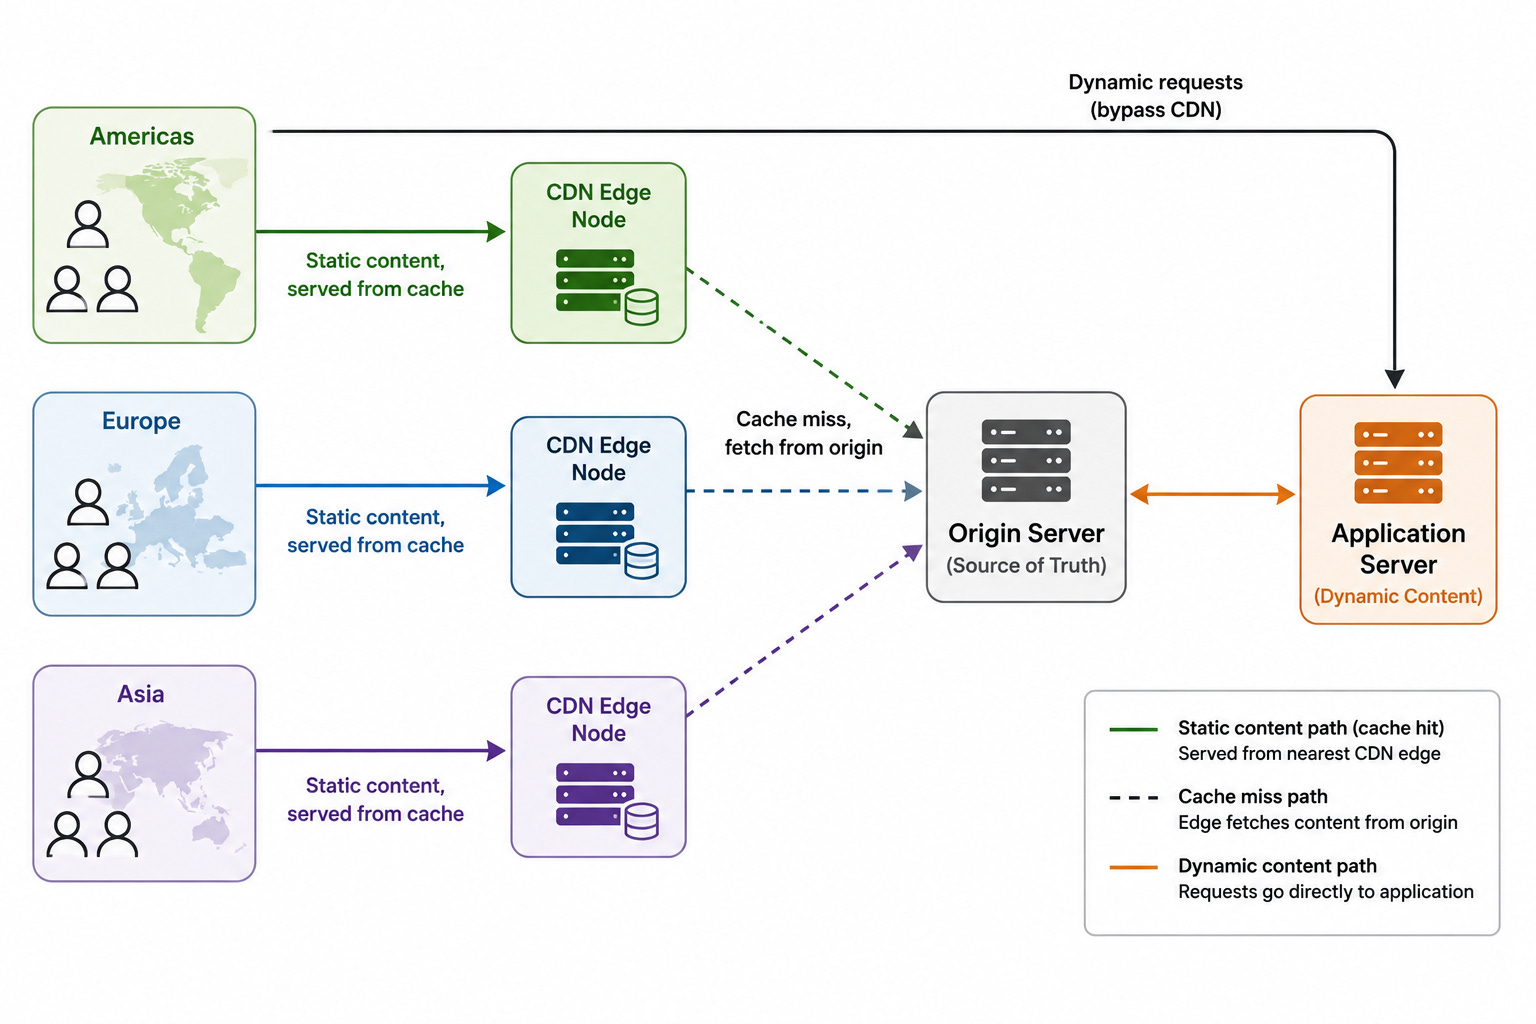
Trade-off: The CDN only helps for content that is the same for all users. Dynamic, personalized, or real-time content cannot be cached at the edge.
What it shows: How a single entry point handles cross-cutting concerns for multiple backend services.
Draw clients on the left (web, mobile, third-party).
Draw an API gateway in the center handling authentication, rate limiting, SSL termination, and request routing.
Draw arrows from the gateway to four backend services: user service, order service, payment service, product service. Label the gateway as the single external-facing entry point.
The gateway centralizes concerns that would otherwise be implemented redundantly in every service. Every client talks to one address. The gateway handles the rest.
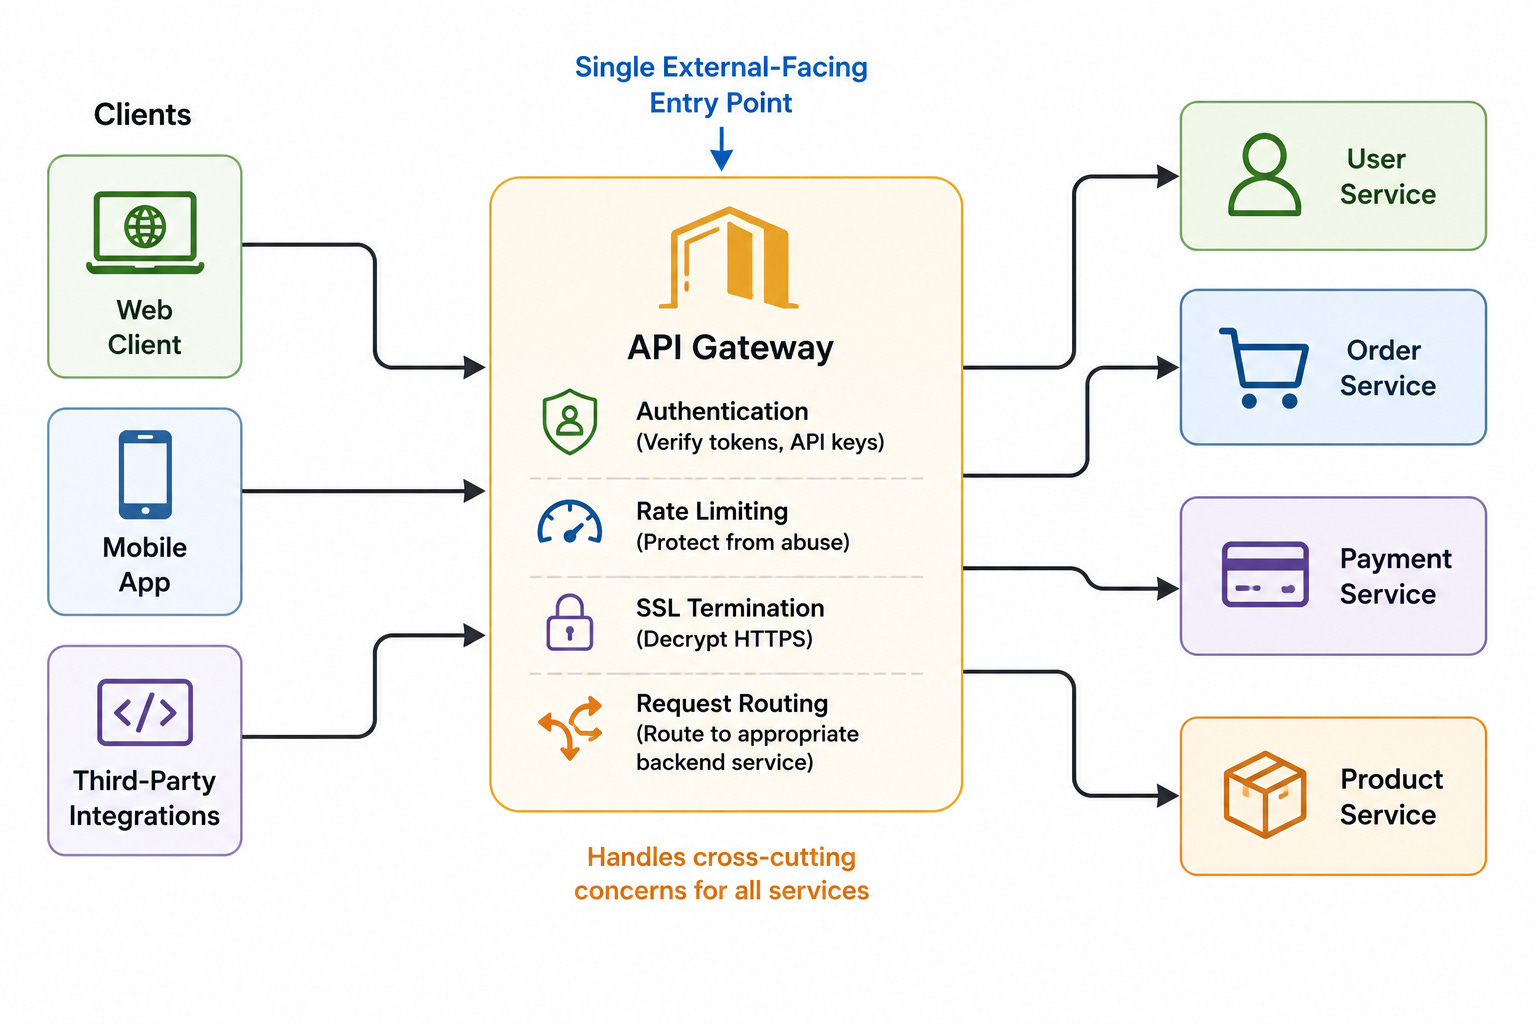
Trade-off: The gateway becomes a critical component that must be highly available. If it fails, all services become unreachable. It can also become a bottleneck if not scaled appropriately.
What it shows: How a reverse proxy sits between clients and servers to handle caching, compression, and routing.
Draw clients on the left sending requests to a reverse proxy in the center (Nginx or HAProxy).
Draw the proxy performing three operations: checking its cache, compressing responses, and routing to the correct upstream server.
Draw multiple upstream servers on the right handling different paths, slash API to the API servers and slash static to the file servers.
A reverse proxy adds capabilities to the request path without changing the clients or the servers. It is the invisible layer that makes many optimizations possible.
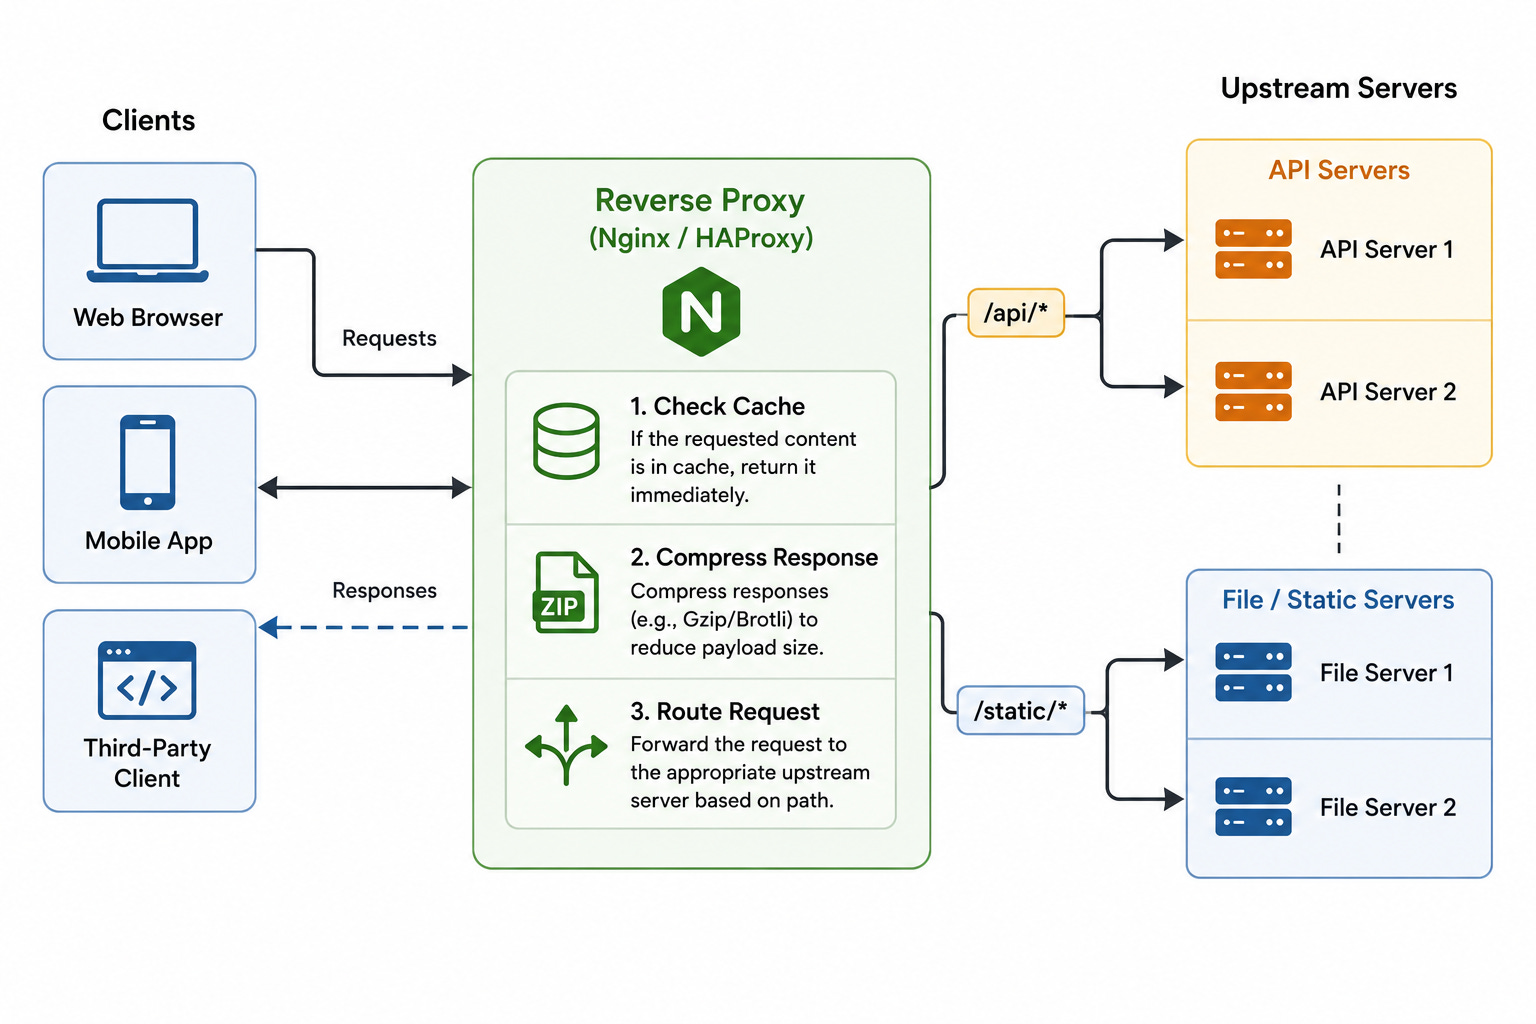
Trade-off: The reverse proxy adds a network hop to every request. It must be configured correctly for each upstream and can be a single point of failure without redundancy.
What it shows: How a system serves global users while surviving regional failures.
Draw three geographic regions side by side each containing a complete stack of load balancer, application servers, and database.
Draw a global load balancer or DNS-based routing above all three routing each user to the nearest region.
Draw cross-region database replication arrows between the primary databases with a label showing the replication direction and consistency model.
Multi-region architecture reduces latency for global users and survives the complete failure of one region.
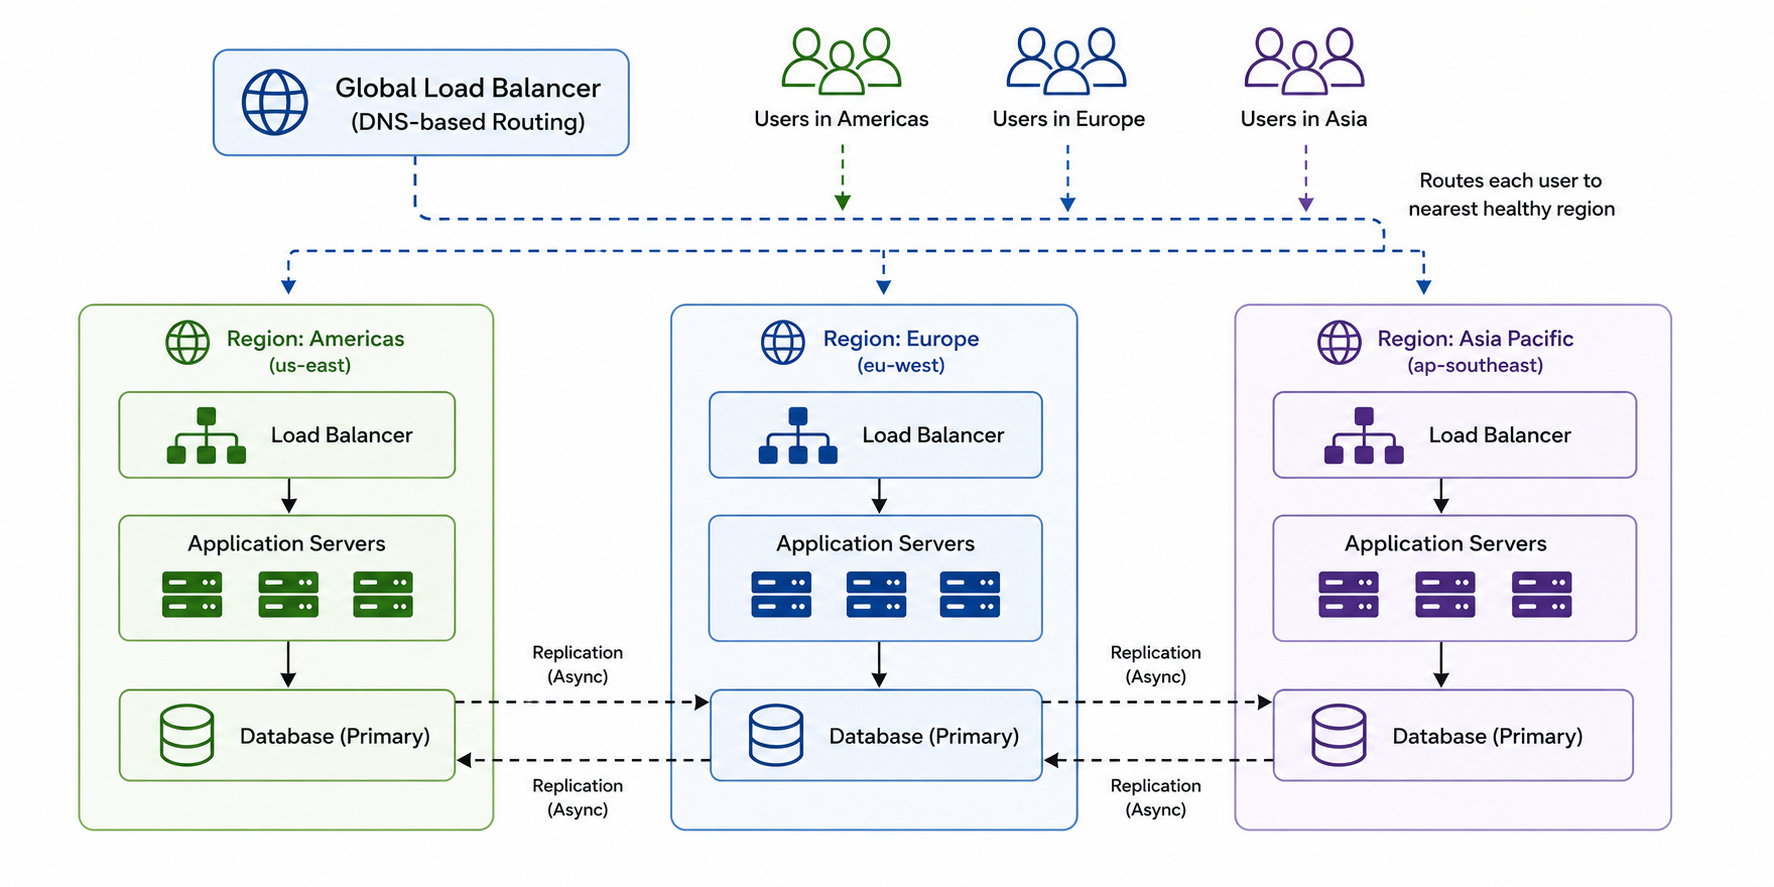
Trade-off: Cross-region replication introduces consistency challenges. Active-active regions can produce write conflicts. Active-passive regions waste the secondary region’s capacity.
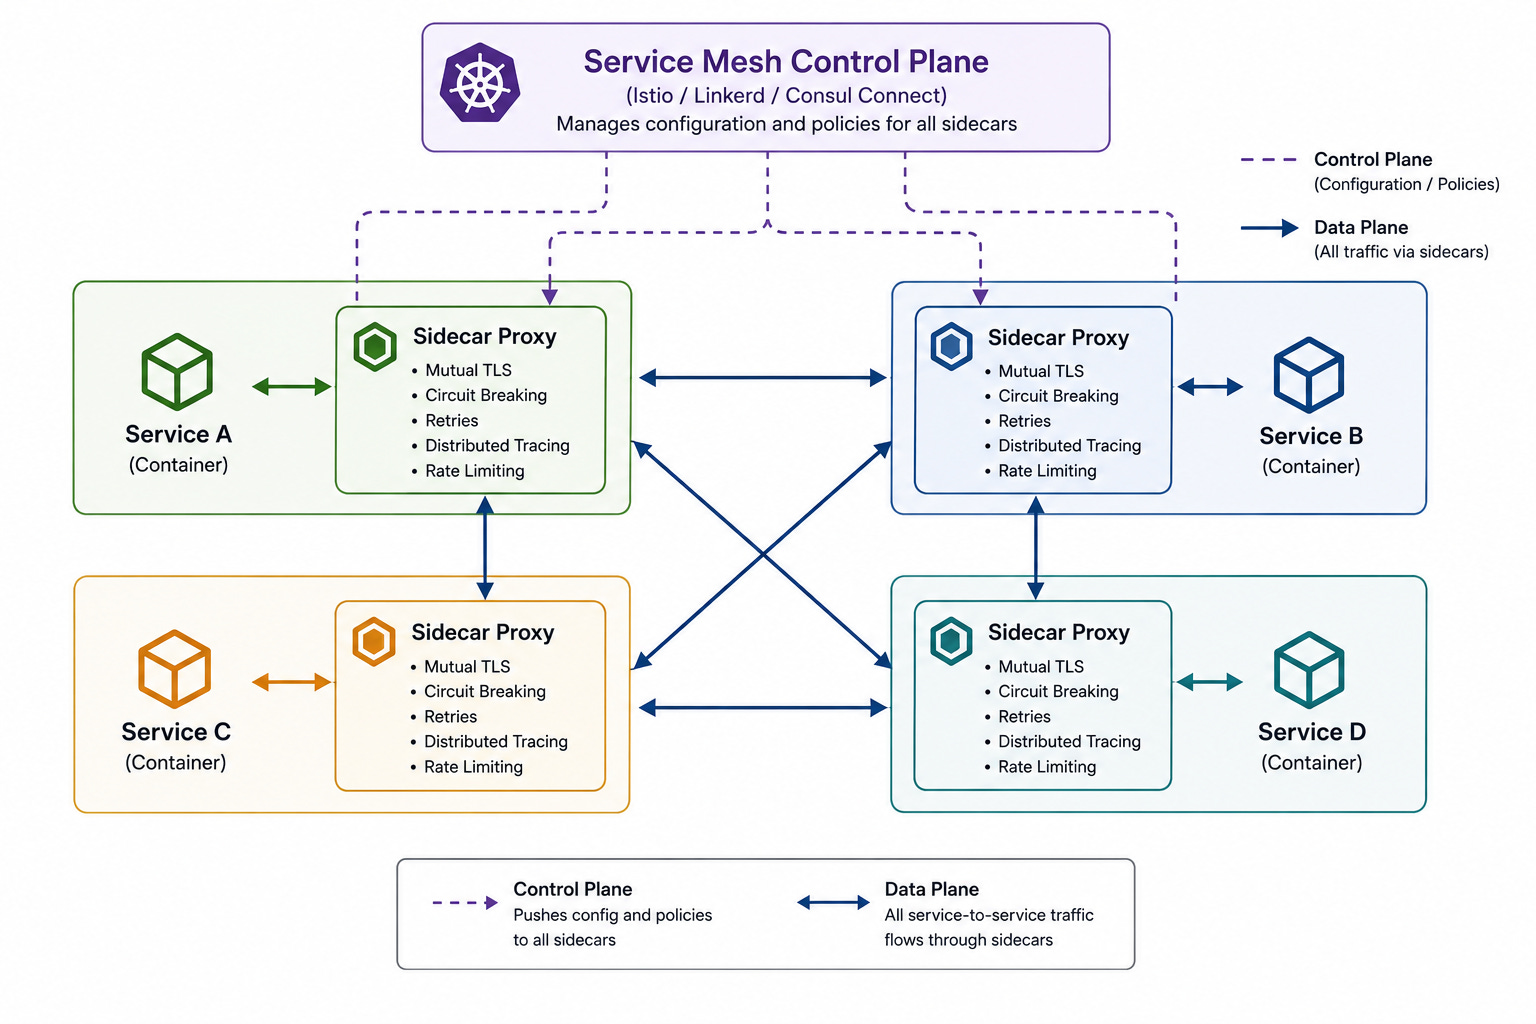
What it shows: How a sidecar proxy pattern handles cross-cutting concerns in a microservices fleet.
Draw four services each with a sidecar proxy container alongside it.
Draw all traffic between services going through the sidecars rather than directly. Label the sidecars with the functions they provide: mutual TLS, circuit breaking, retries, distributed tracing, and rate limiting.
Draw a control plane above the fleet managing the configuration of all sidecars.
The service mesh moves infrastructure concerns out of application code and into the sidecar layer, allowing consistent policy enforcement across all services without requiring each service to implement it.
Trade-off: Every sidecar adds memory and CPU overhead. Every inter-service call traverses two sidecars, adding latency.
At small scale, the overhead is not worth it.
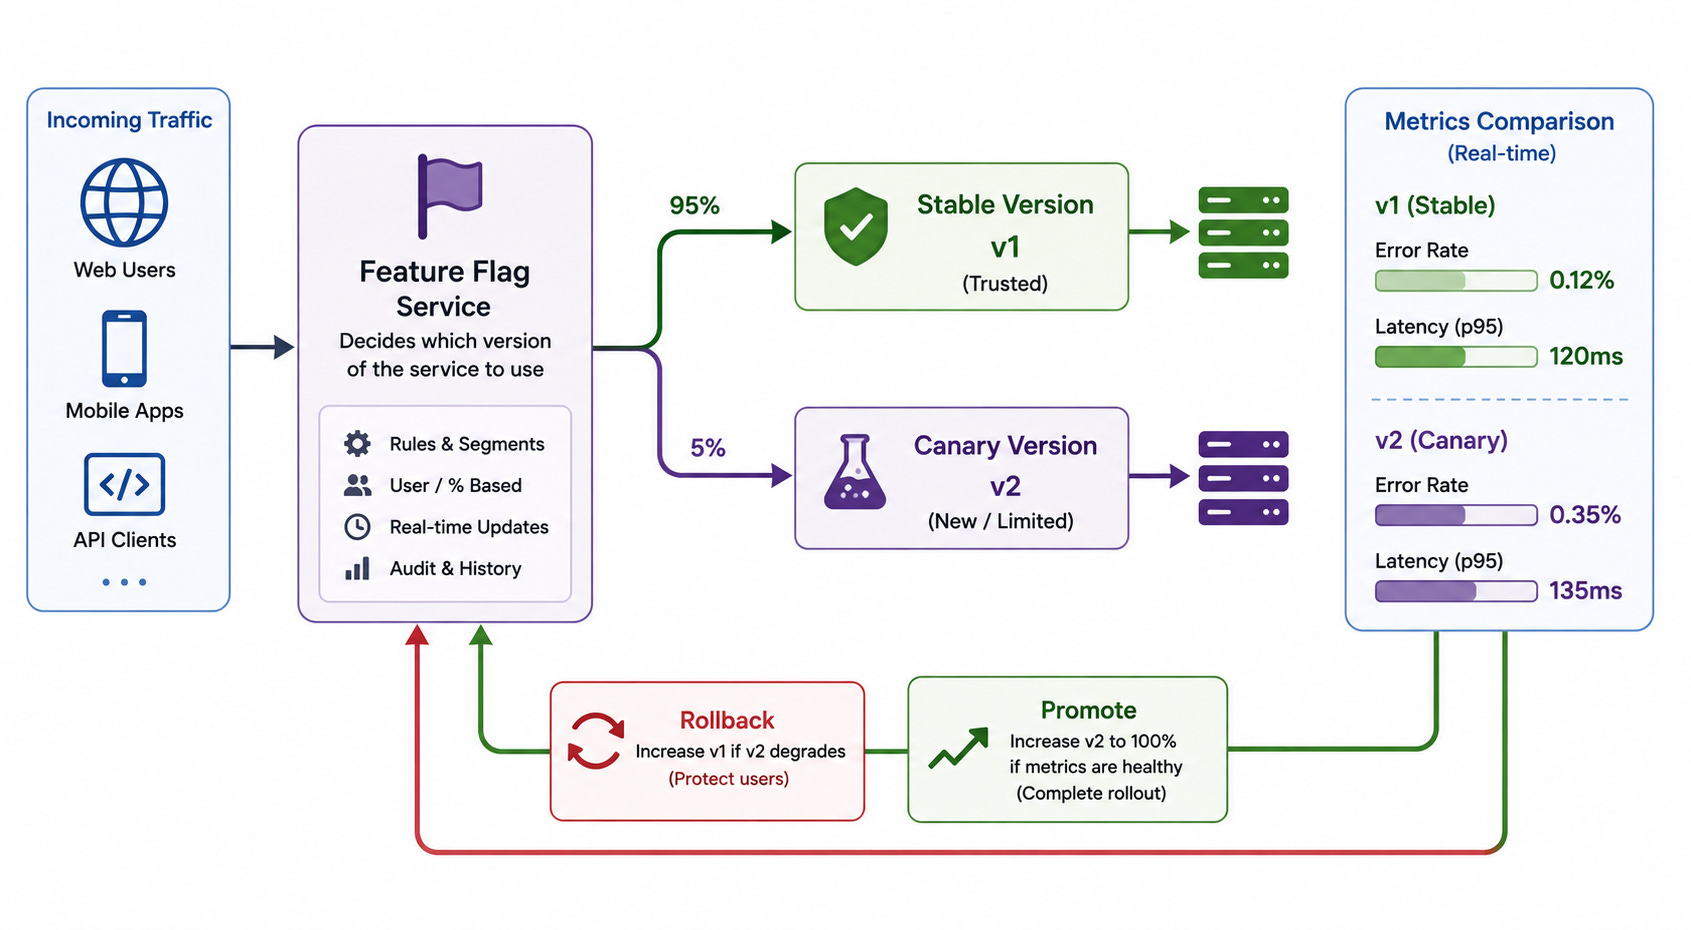
What it shows: How traffic is gradually shifted to a new version to validate changes safely.
Draw incoming traffic on the left hitting a feature flag service.
Draw two paths: ninety-five percent going to the stable version labeled v1 and five percent going to the canary version labeled v2.
Draw a metrics comparison panel showing error rate and latency for both versions.
Draw a rollback arrow from the metrics panel back to the flag service labeled increase v1 if v2 degrades, and a promotion arrow labeled increase v2 to one hundred percent if metrics are healthy.
Canary deployments catch problems before they affect all users by exposing only a fraction of traffic to the new version.
Trade-off: Running two versions simultaneously requires backward compatibility in APIs and database schemas. Any migration must work for both versions concurrently.
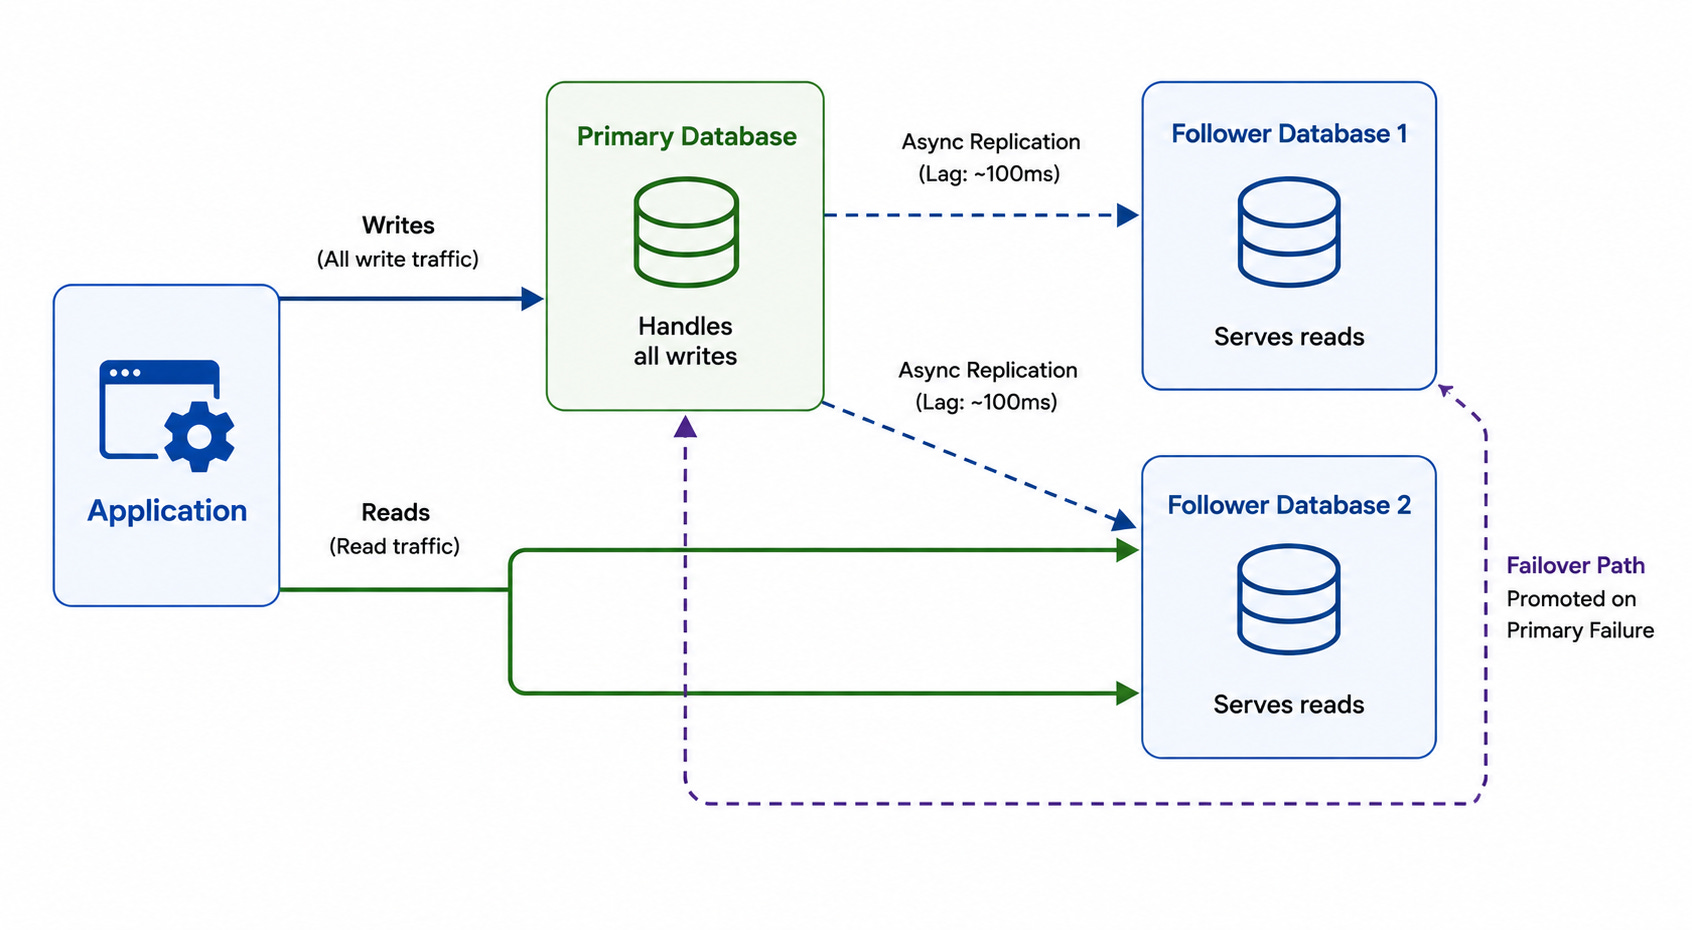
What it shows: How one database node handles writes while others serve reads.
Draw one primary database on the left labeled handles all writes.
Draw two follower databases on the right labeled serve reads connected to the primary with arrows labeled async replication with a lag annotation.
Draw write arrows from the application to the primary only.
Draw read arrows from the application to the followers.
Draw a failover path from one follower labeled promoted on primary failure.
Replication scales reads and provides redundancy but does not scale writes. All writes still funnel through one machine.
Trade-off: Asynchronous replication introduces lag. Reads from followers may return stale data. A read immediately after a write may not see the written value.
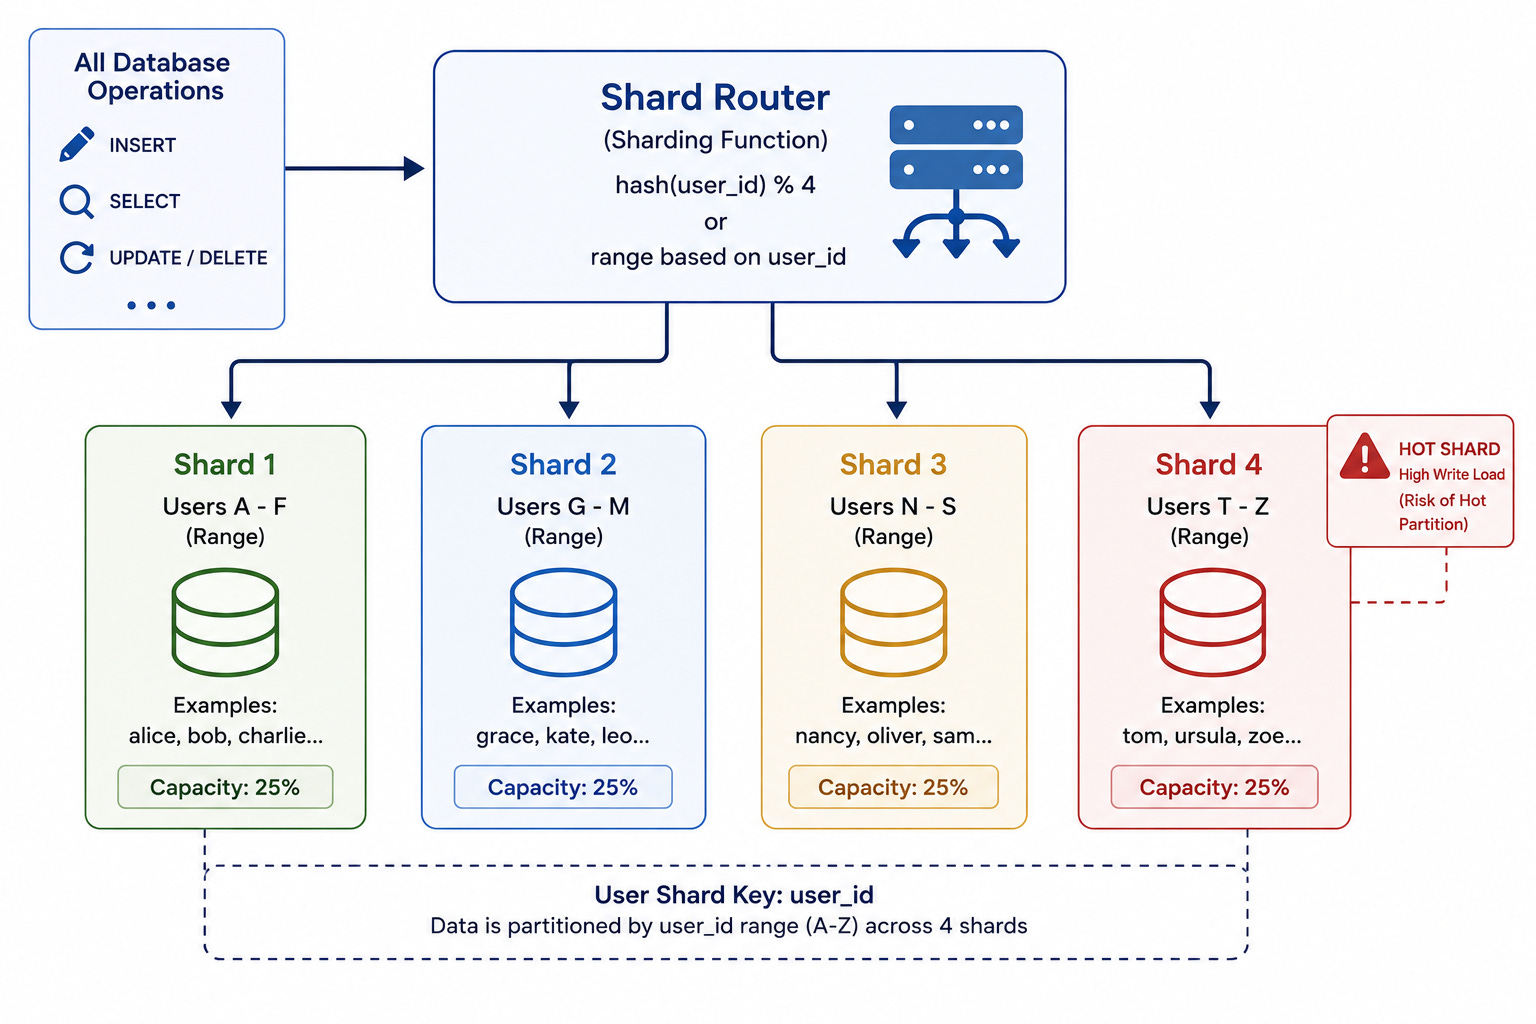
What it shows: How data is partitioned across multiple databases to scale writes and storage.
Draw a shard router at the top receiving all database operations.
Draw four shards below it each labeled with its data range (users A-F, G-M, N-S, T-Z for a user shard key).
Draw arrows from the router to each shard. Annotate the router with the sharding function. Mark one shard with a hot warning to illustrate the hot partition risk.
Sharding is the solution to write and storage scale that replication alone cannot address.
Trade-off: Cross-shard queries require contacting multiple shards and merging results. The shard key must distribute traffic evenly or hot shards form.
What it shows: How the application manages a cache explicitly with a read-through fallback.
Draw a numbered sequence: the application checks the cache (step 1), the cache returns the value on a hit (step 2a) or a miss flows to the database (step 2b), the database returns the value (step 3), the application populates the cache with the result (step 4), and the value is returned to the caller (step 5).
Draw the write path separately showing the application writing to the database and then either invalidating or updating the cache key.
Cache-aside is the default caching pattern because it is simple and degrades gracefully when the cache is unavailable.
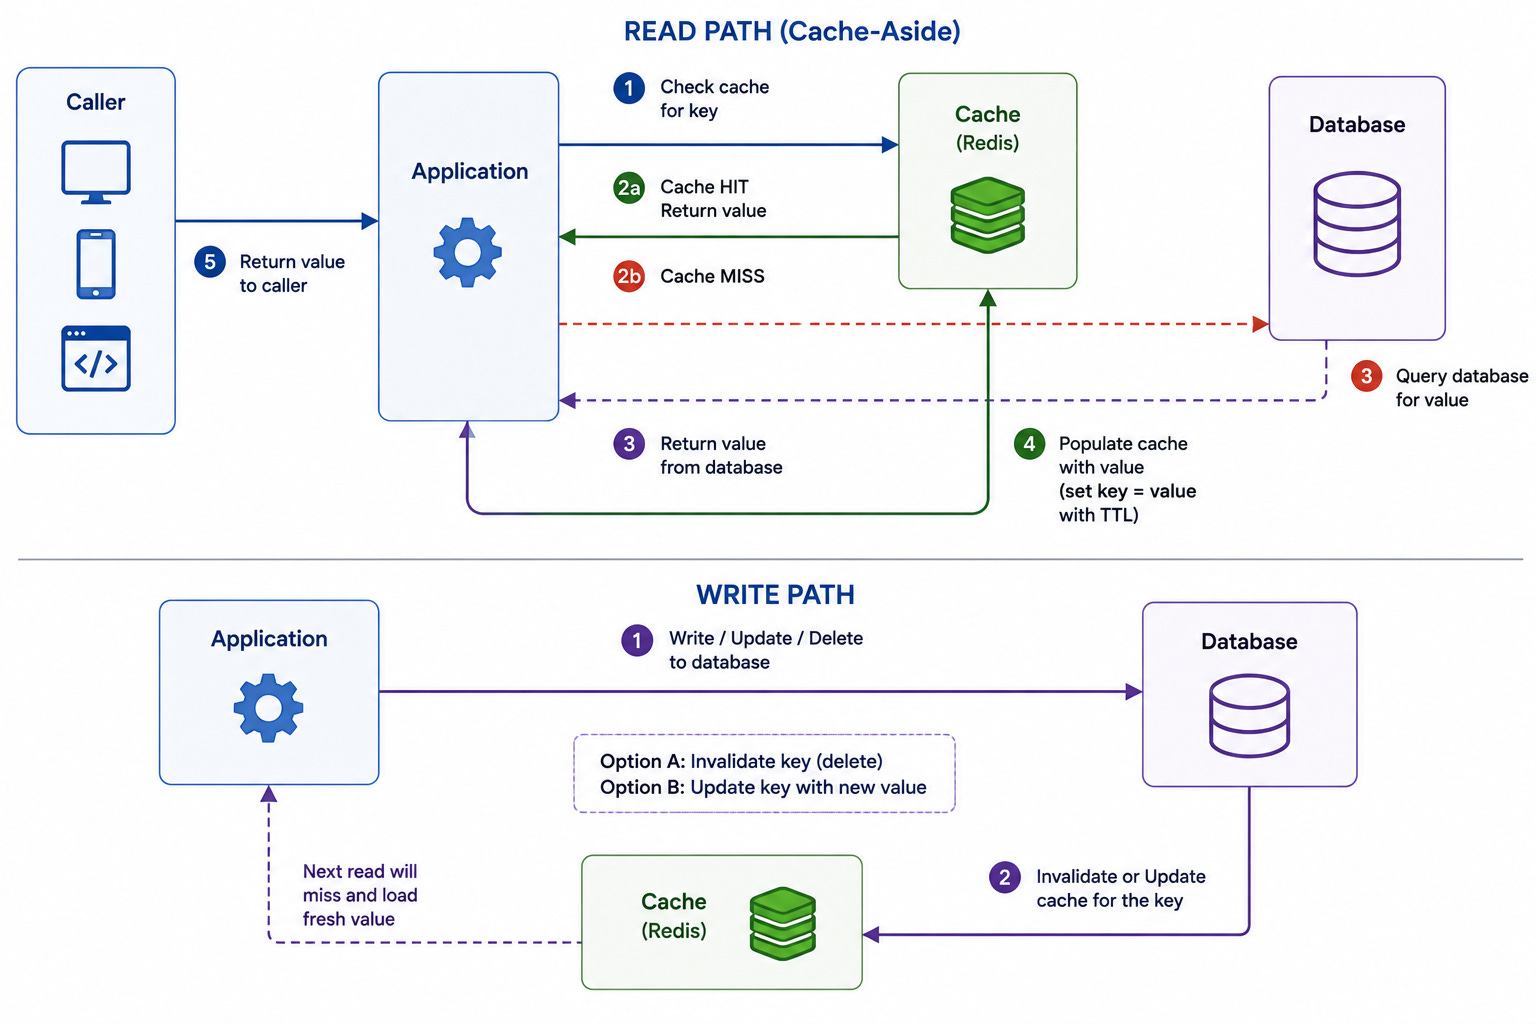
Trade-off: The cache may serve stale data between writes and invalidation. The cold start period after a cache restart floods the database with misses until the cache warms.
What it shows: Two alternative caching patterns and their consistency-latency trade-offs.
Draw two side-by-side sequences.
Write-through: application writes to cache and database simultaneously, both must succeed before returning.
Write-behind: application writes to cache only and returns immediately, a background process asynchronously flushes to the database with a buffer shown between them.
Annotate write-through with consistent but slower writes and write-behind with fast writes but risk of data loss on crash.
The choice between these patterns determines whether write latency or write safety is the priority.
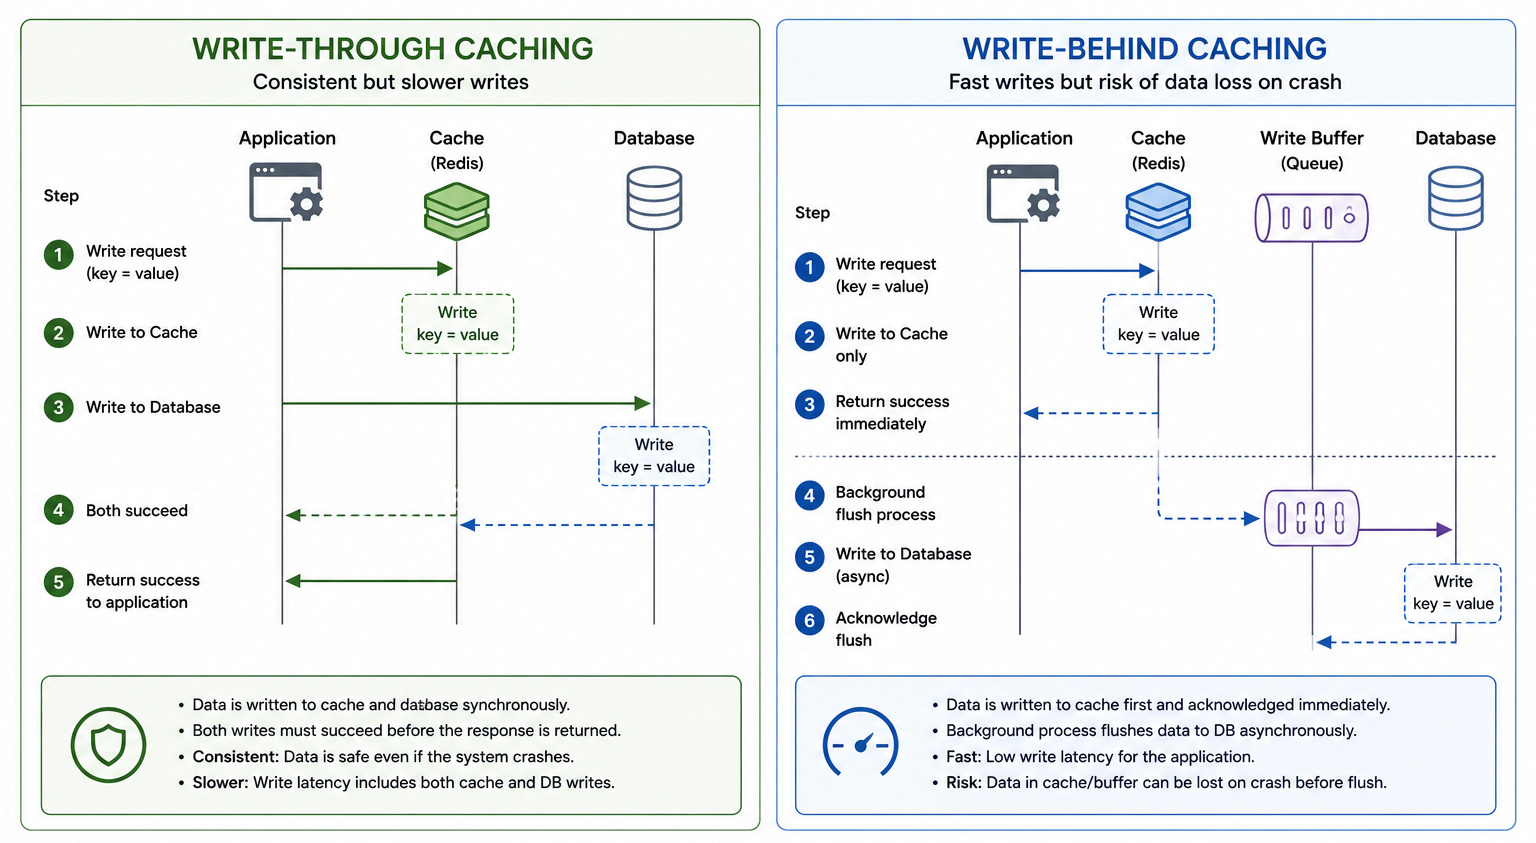
Trade-off: Write-through adds database latency to every write. Write-behind risks losing buffered writes if the cache crashes before flushing.
What it shows: How data is distributed across nodes with minimal redistribution when membership changes.
Draw a circle with hash values from zero to three hundred and sixty degrees.
Place four node markers at positions around the ring labeled A, B, C, D.
Place six key markers at various positions each with a clockwise arrow pointing to the responsible node.
Show a fifth node added between C and D with only the keys between C and the new node moving. Add multiple positions per physical node labeled virtual nodes showing improved distribution.
Consistent hashing minimizes the data movement required when nodes join or leave a cluster.
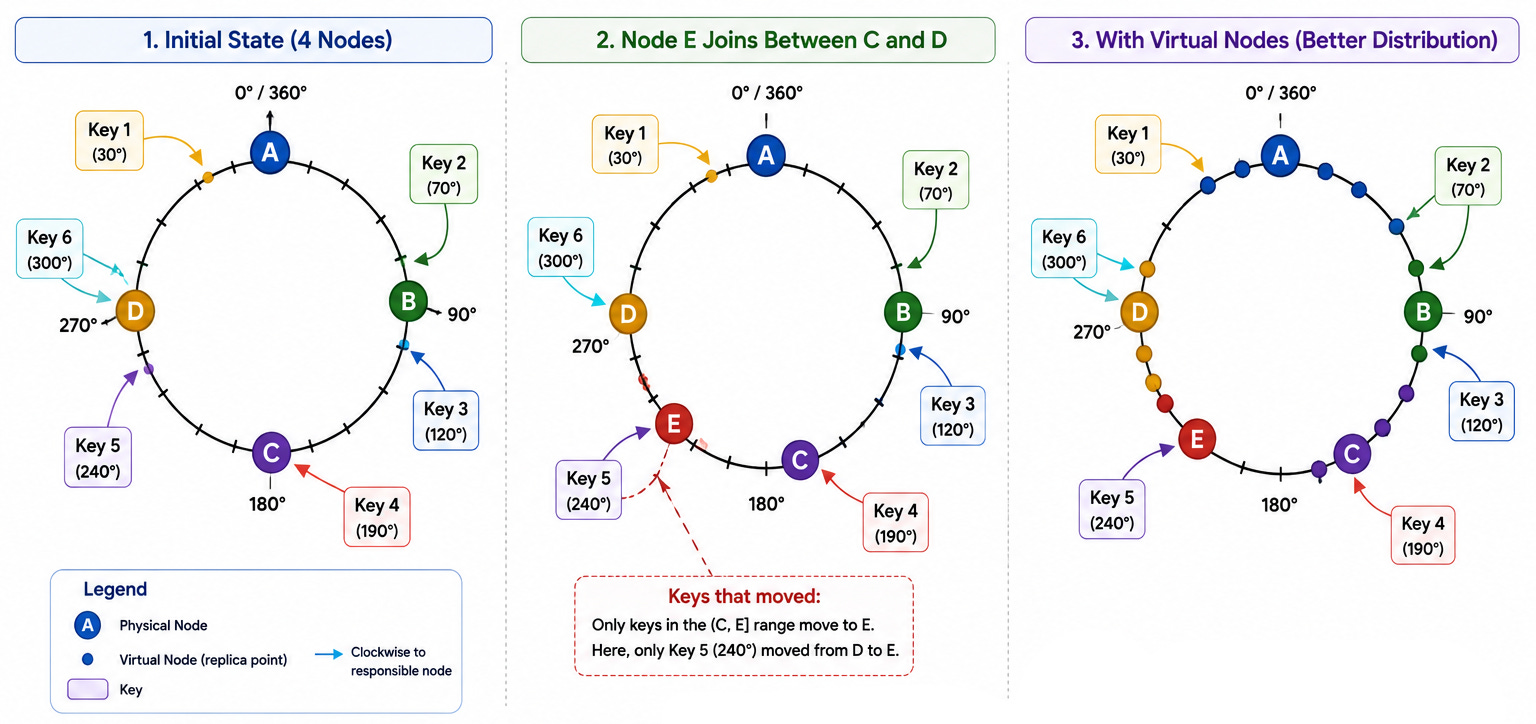
Trade-off: Without virtual nodes, the distribution is uneven. Virtual nodes improve distribution but increase the metadata required to track ring positions.
What it shows: How databases guarantee durability and power replication through an append-only log.
Draw an application writing to a database. Inside the database box draw two components: the WAL as a vertical log on the left receiving every write first, and the data files on the right updated after the WAL entry is recorded.
Draw a crash and recovery scenario showing the WAL being replayed to restore uncommitted writes.
Draw an arrow from the WAL to a replica database labeled WAL streaming for replication.
The WAL is the foundation of both database durability and replication. It explains why committed writes survive crashes and why replicas can stay in sync.
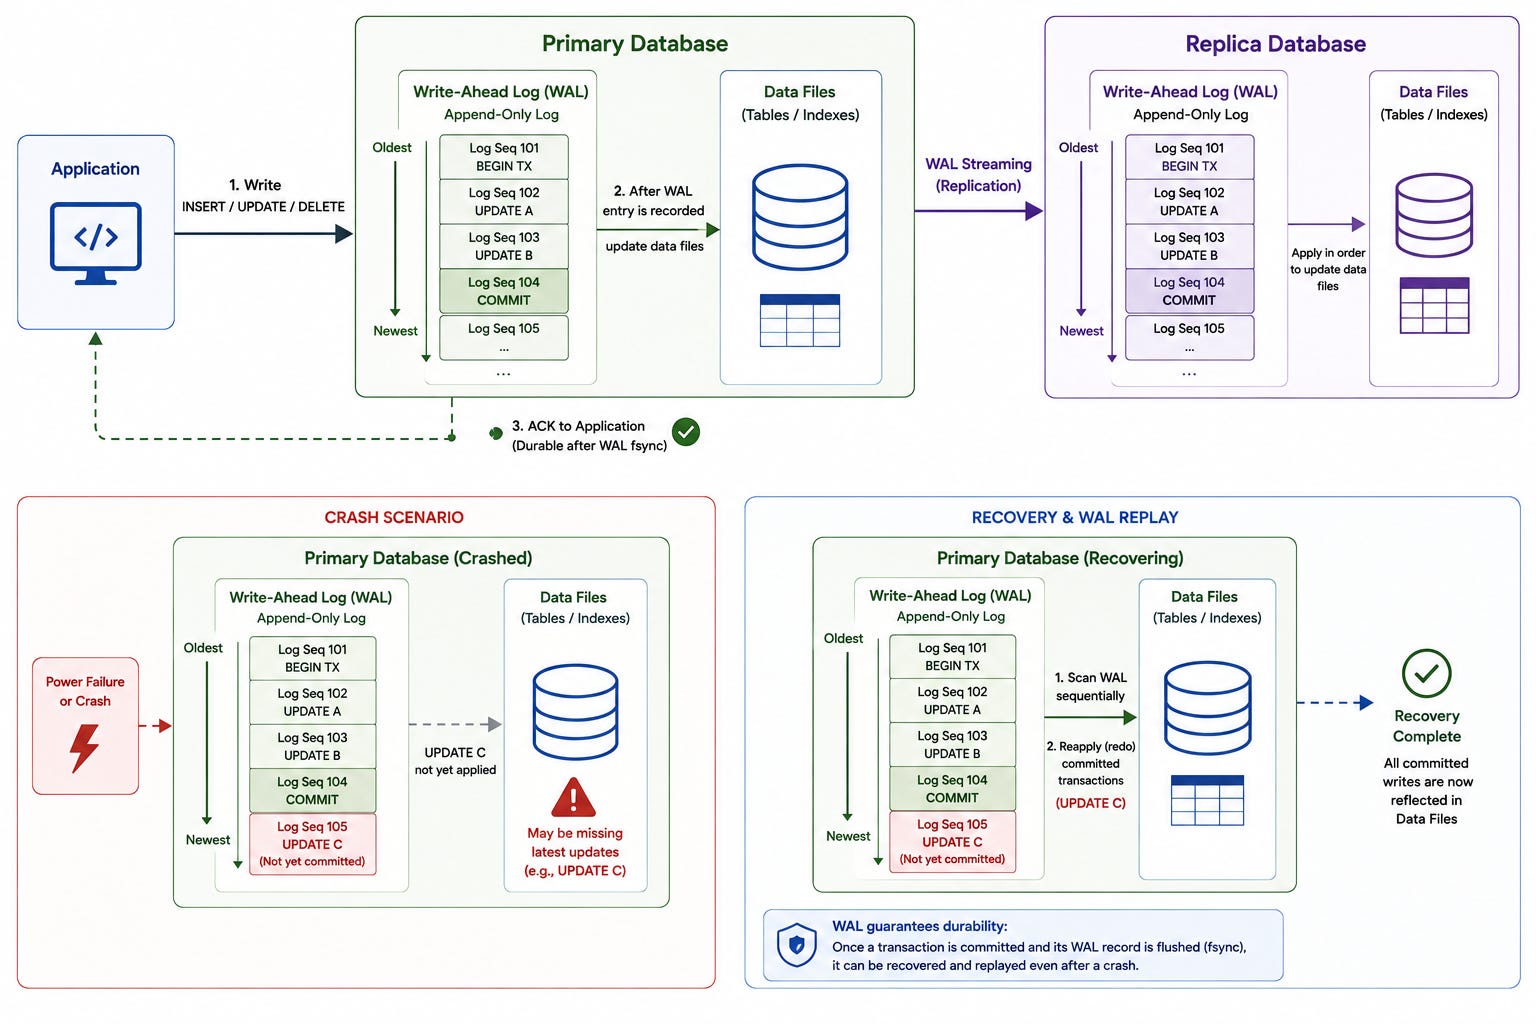
Trade-off: Synchronous WAL flushing guarantees durability at the cost of write latency. The WAL must be periodically compacted to reclaim disk space.
What it shows: How a service atomically updates its database and publishes an event to a message queue.
Draw a service writing to two destinations in a single database transaction: the business data table and an outbox table.
Draw a separate relay process reading new rows from the outbox table and publishing them to a message queue.
Draw the relay marking rows as published after successful delivery. Annotate the database transaction boundary to show both writes are atomic and the relay providing at-least-once delivery.
The outbox pattern solves the dual-write problem where database and queue can fall out of sync if either write fails independently.
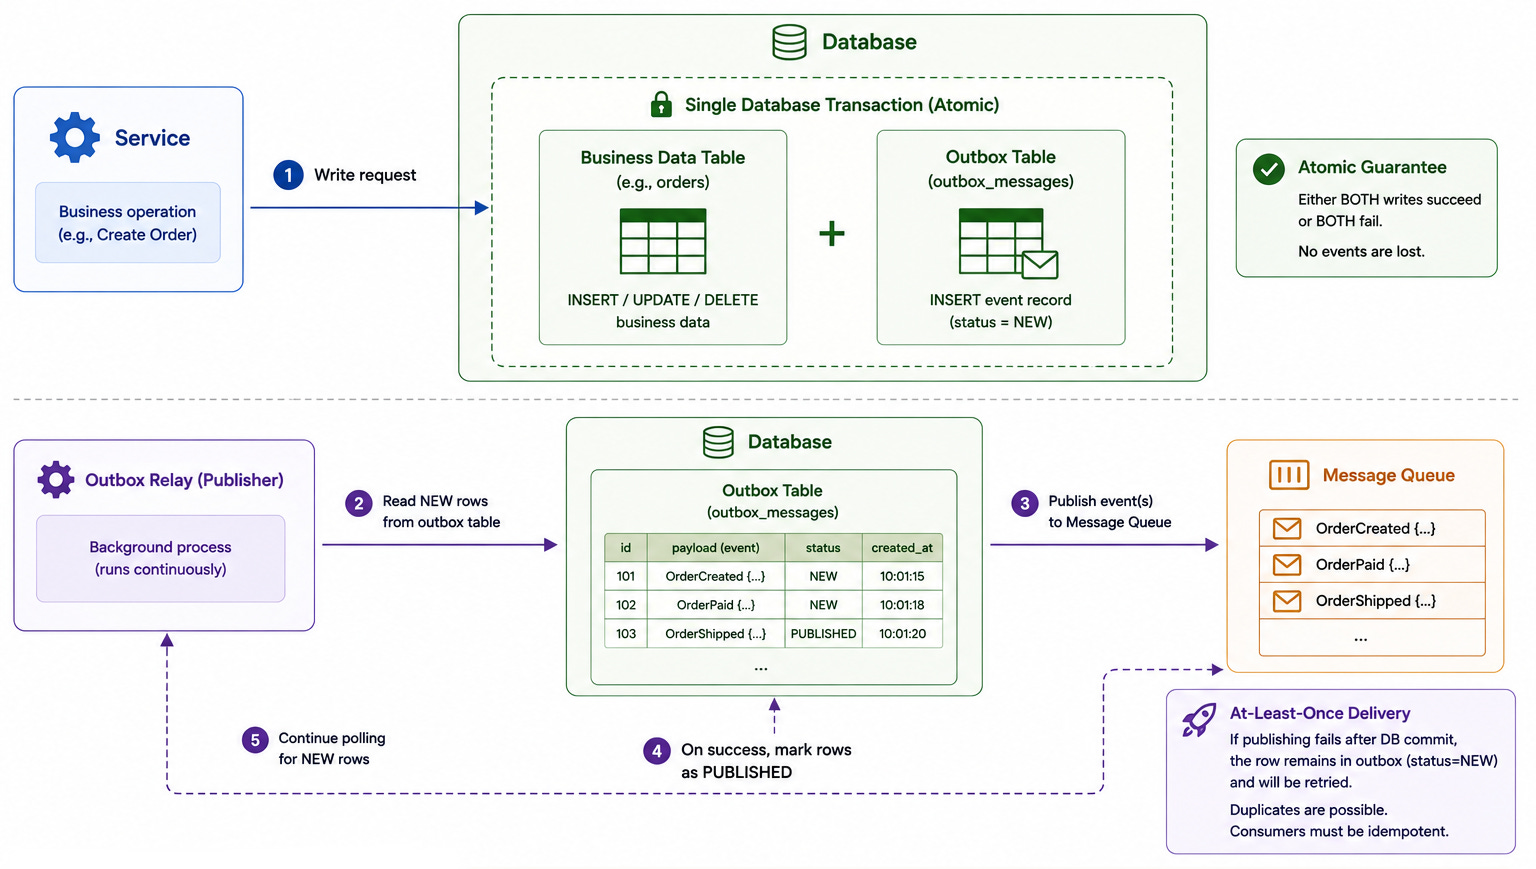
Trade-off: The relay process adds operational complexity and introduces a delay between the database write and the event appearing on the queue.
What it shows: How high-volume append-only data is ingested, buffered, and stored efficiently.
Draw many producers (servers, IoT devices, user actions) on the left publishing events.
Draw a Kafka cluster in the center receiving all events with multiple partitions shown as horizontal rows within the cluster.
Draw consumer workers on the right pulling from partitions and writing to a wide-column store or time-series database. Annotate the database schema with partition key on entity ID and clustering key on timestamp.
This pipeline handles enormous write volume by buffering in Kafka and writing to a database optimized for time-ordered sequential writes.
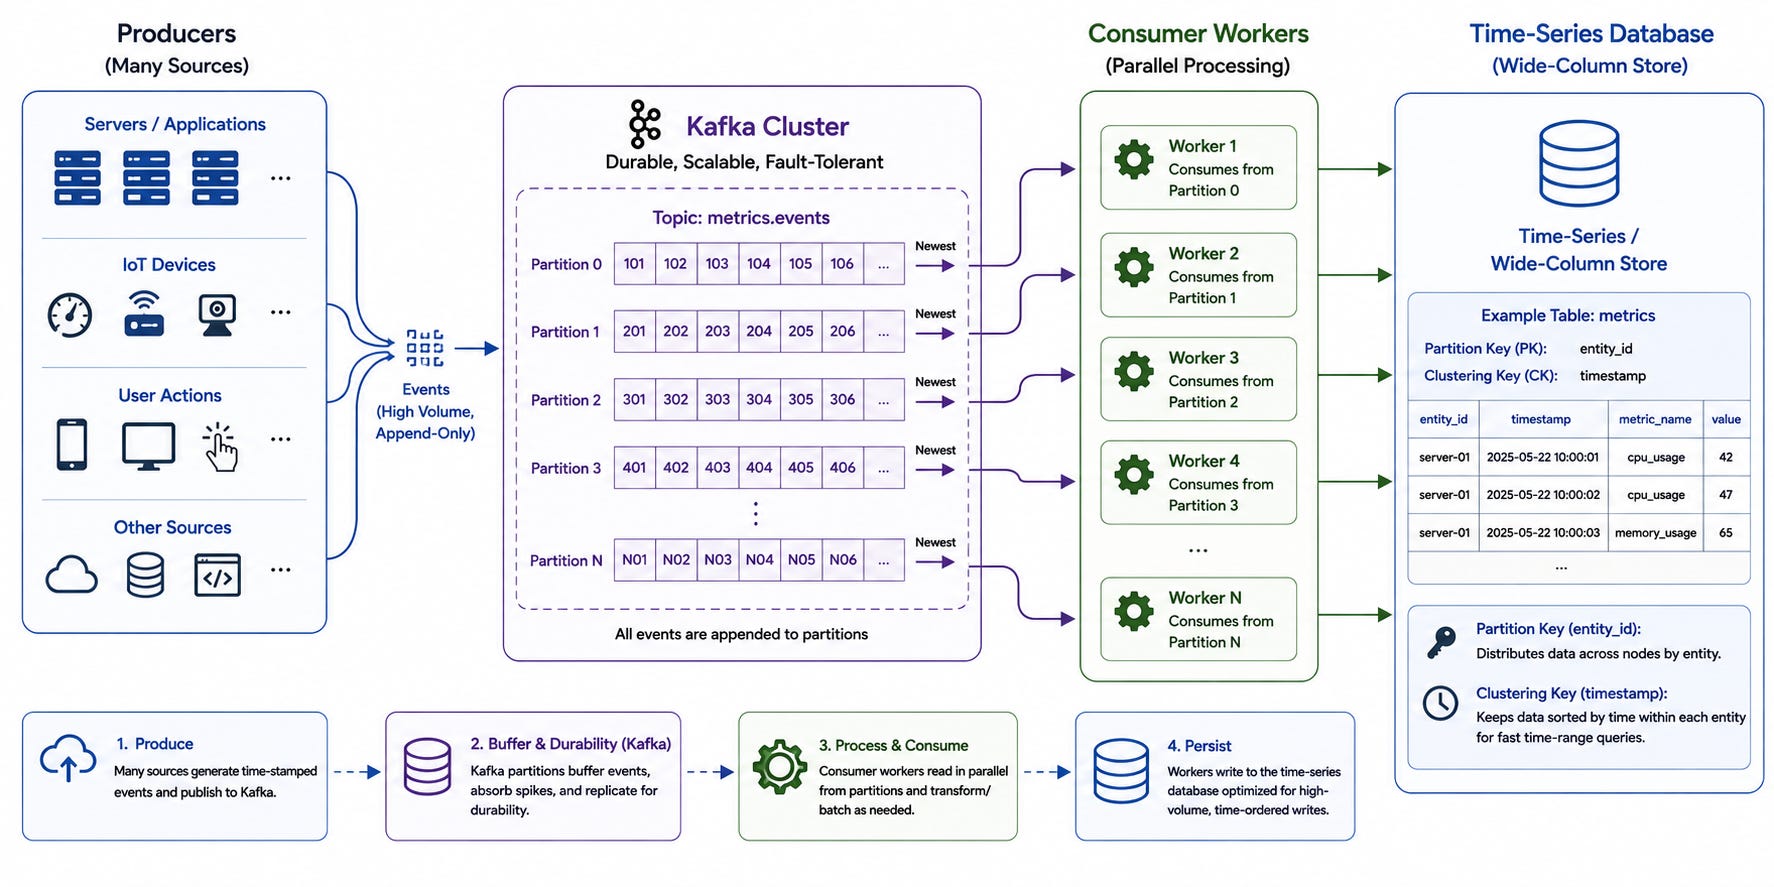
Trade-off: Queries only work efficiently along the partition and clustering key dimensions. Ad-hoc queries across entities require a separate analytics system.
What it shows: How a searchable index is built from source data and kept fresh as data changes.
Draw a primary database on the left.
Draw a change data capture (CDC) layer detecting changes in the database.
Draw an indexing pipeline processing the changes and updating an Elasticsearch index.
Draw a search service in the center receiving user queries, translating them to Elasticsearch queries, and returning ranked results. Annotate the index with the inverted structure mapping terms to document IDs.
The search index is a derived read model optimized for text search that could not be served efficiently from the primary database.
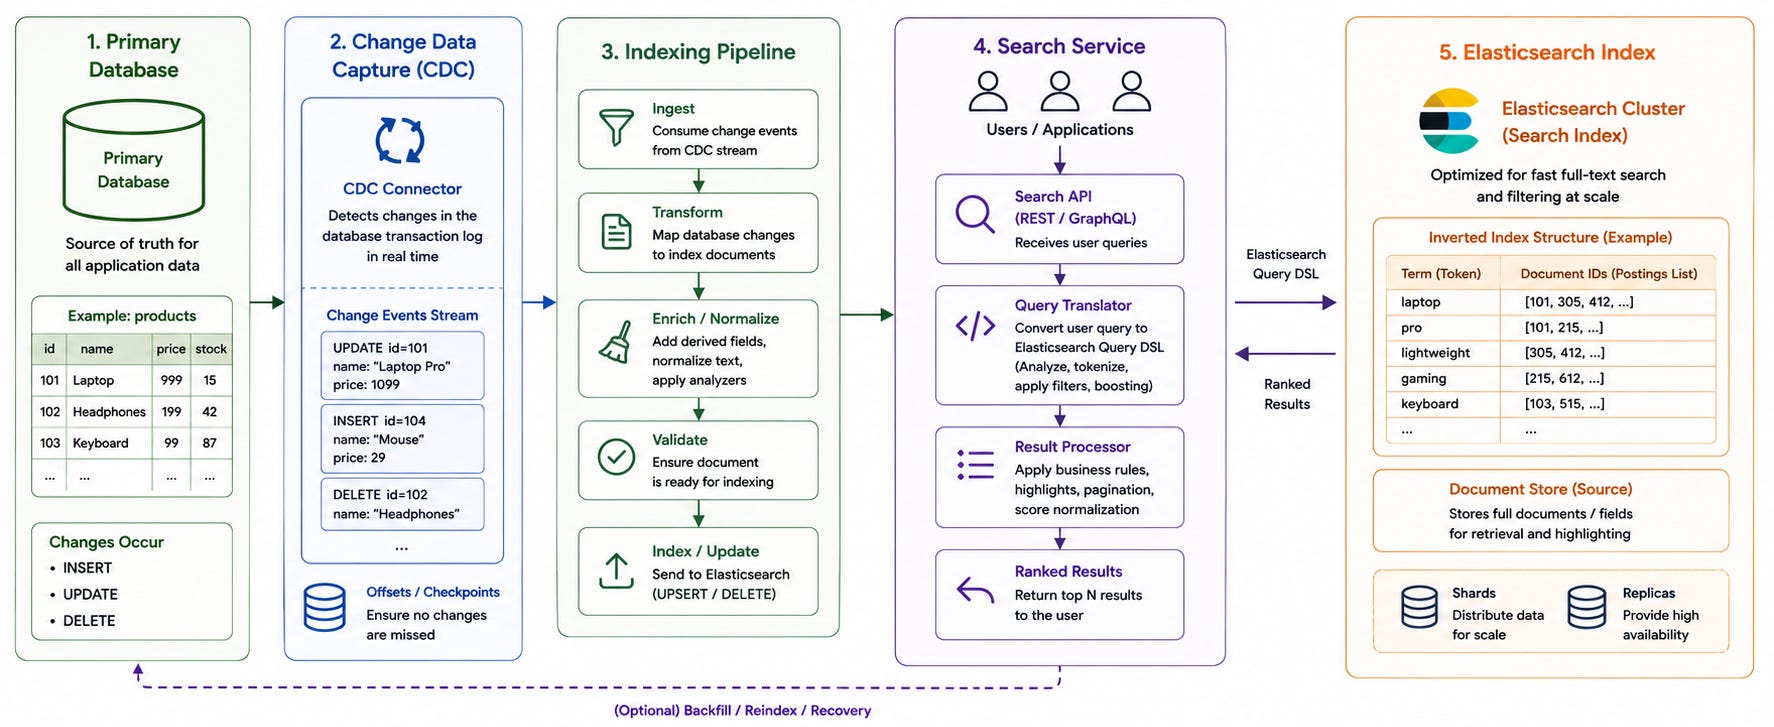
Trade-off: The index is eventually consistent with the source database. Changes take time to propagate. The index may not reflect writes that are seconds or minutes old.
What it shows: How different parts of a system use different databases optimized for each workload.
Draw a central application tier.
Draw five storage systems connected to it: PostgreSQL for relational user and order data, Redis for sessions and hot cache data, Cassandra for time-series activity logs, Elasticsearch for full-text search, and S3 for large file storage. Label each arrow with the specific workload it handles and why that database fits.
No single database is optimal for all workloads. Polyglot persistence assigns each data type to the most appropriate store.
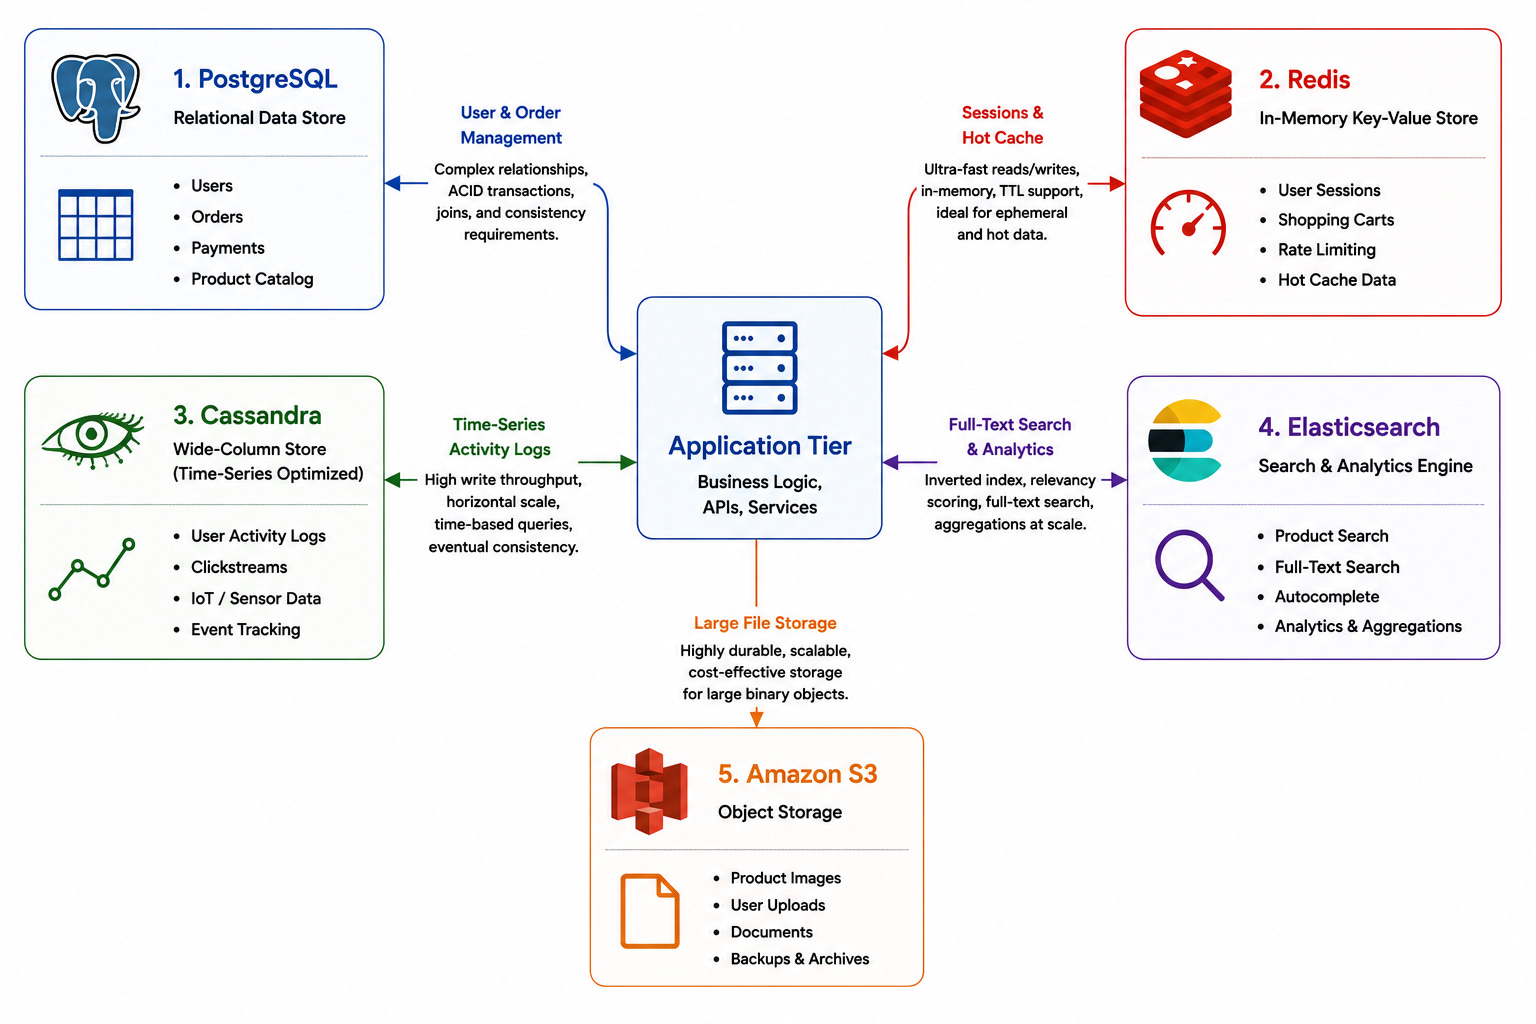
Trade-off: Multiple databases require more operational expertise and make cross-store queries impossible without application-level joins.
What it shows: How network partitions force a choice between consistency and availability.
Draw two nodes on the left and right connected by a network link. Show the link broken with a partition symbol.
Draw two outcome paths: the left node rejecting requests to preserve consistency (CP behavior) and the left node serving potentially stale data to preserve availability (AP behavior).
Annotate that partition tolerance is mandatory and the choice is only between the remaining two during a partition.
The CAP theorem is a statement about partition-time behavior, not a permanent label. Systems make different choices for different operations.
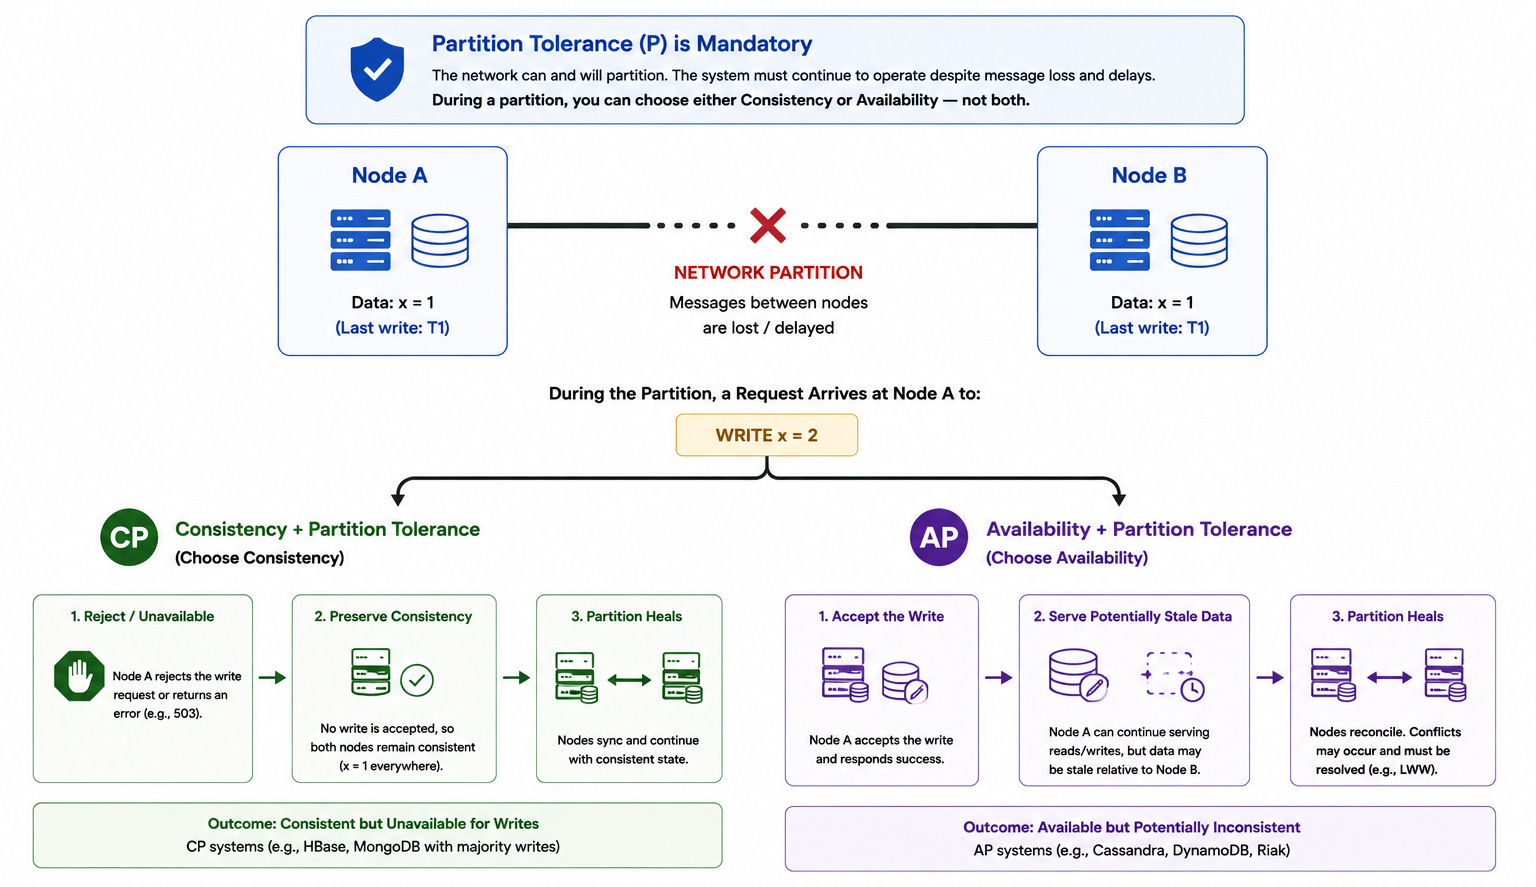
Trade-off: CP systems sacrifice availability during partitions. AP systems sacrifice consistency. Most real systems tune this per operation rather than making a global choice.
What it shows: How a cluster of nodes elects a leader and replicates a log safely despite failures.
Draw five nodes arranged in a cluster. Highlight one as the current leader.
Draw arrows from the leader to all followers labeled AppendEntries (heartbeat/replication). Draw a leader failure with the leader node marked with an X.
Draw one follower incrementing its term number and sending RequestVote messages to the other three.
Draw two followers responding with votes and the candidate becoming the new leader. Annotate that a majority (three of five) is required to elect a leader or commit an entry.
Raft is the readable alternative to Paxos that explains how most modern distributed systems achieve consensus.
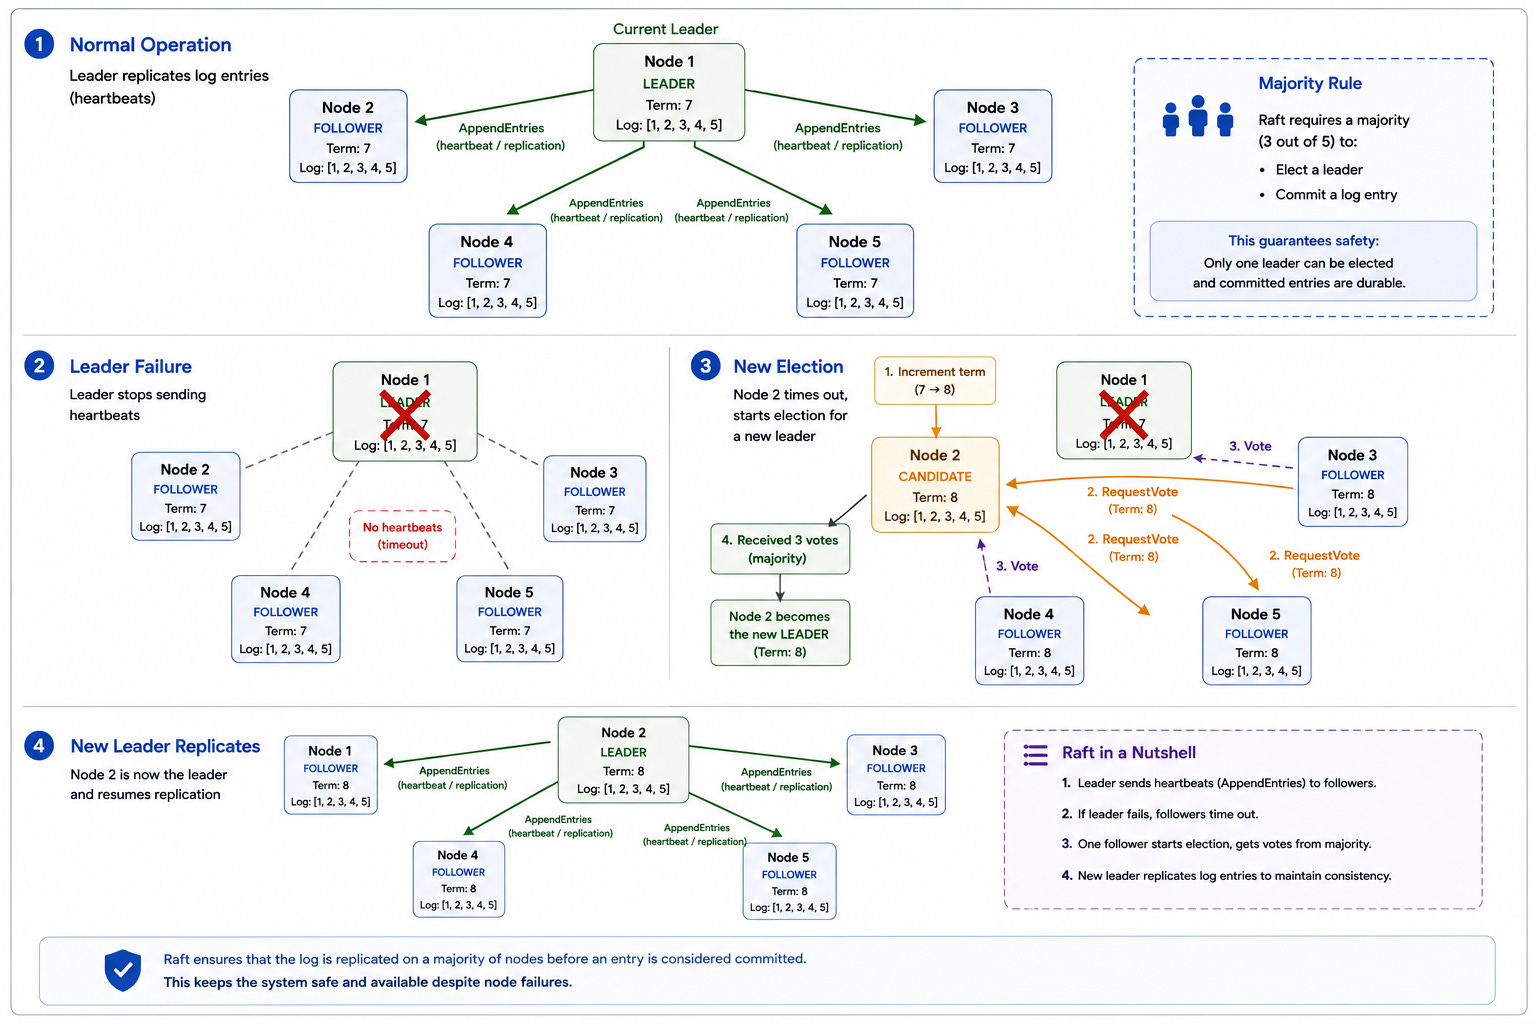
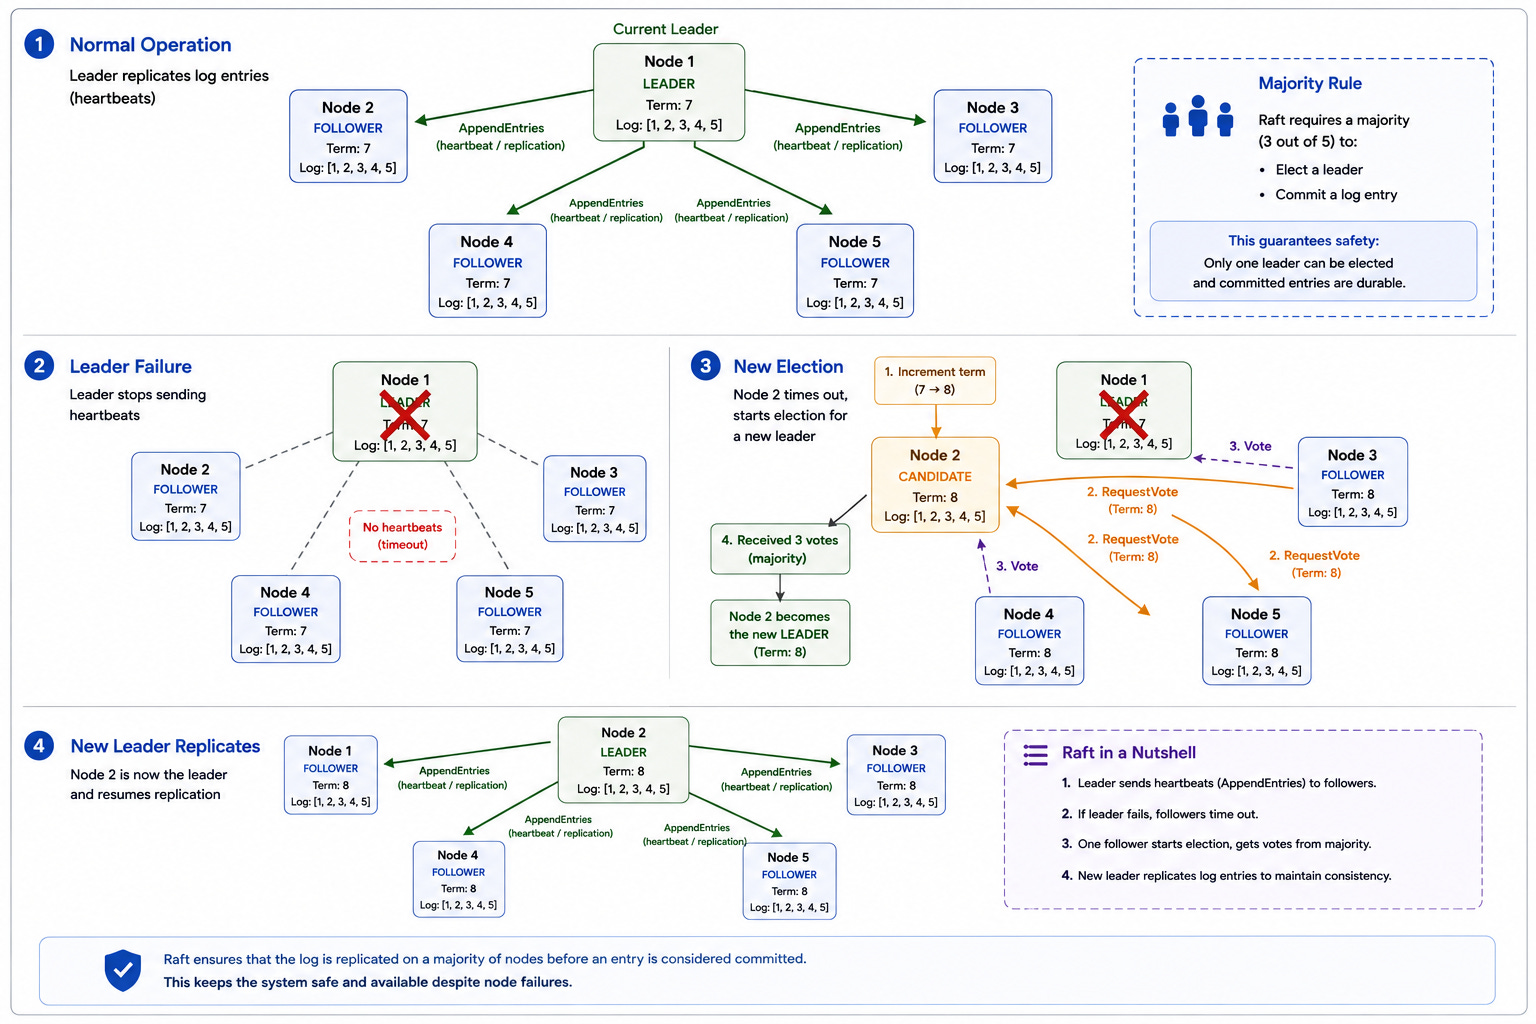
Trade-off: Consensus requires a majority to be reachable. With five nodes, two can fail and the cluster continues. Three failures block progress.
What it shows: How a service protects itself from a failing dependency by failing fast.
Draw three states in a triangle: Closed at the top labeled normal operation, Open at the lower left labeled failing fast, Half-Open at the lower right labeled testing recovery.
Draw transition arrows: Closed to Open when failure rate exceeds threshold, Open to Half-Open after cooldown expires, Half-Open to Closed on trial request success, Half-Open to Open on trial request failure.
Draw a calling service and a dependency with the circuit breaker between them.
The circuit breaker prevents cascading failures by stopping calls to a failing dependency before they exhaust the caller’s resources.
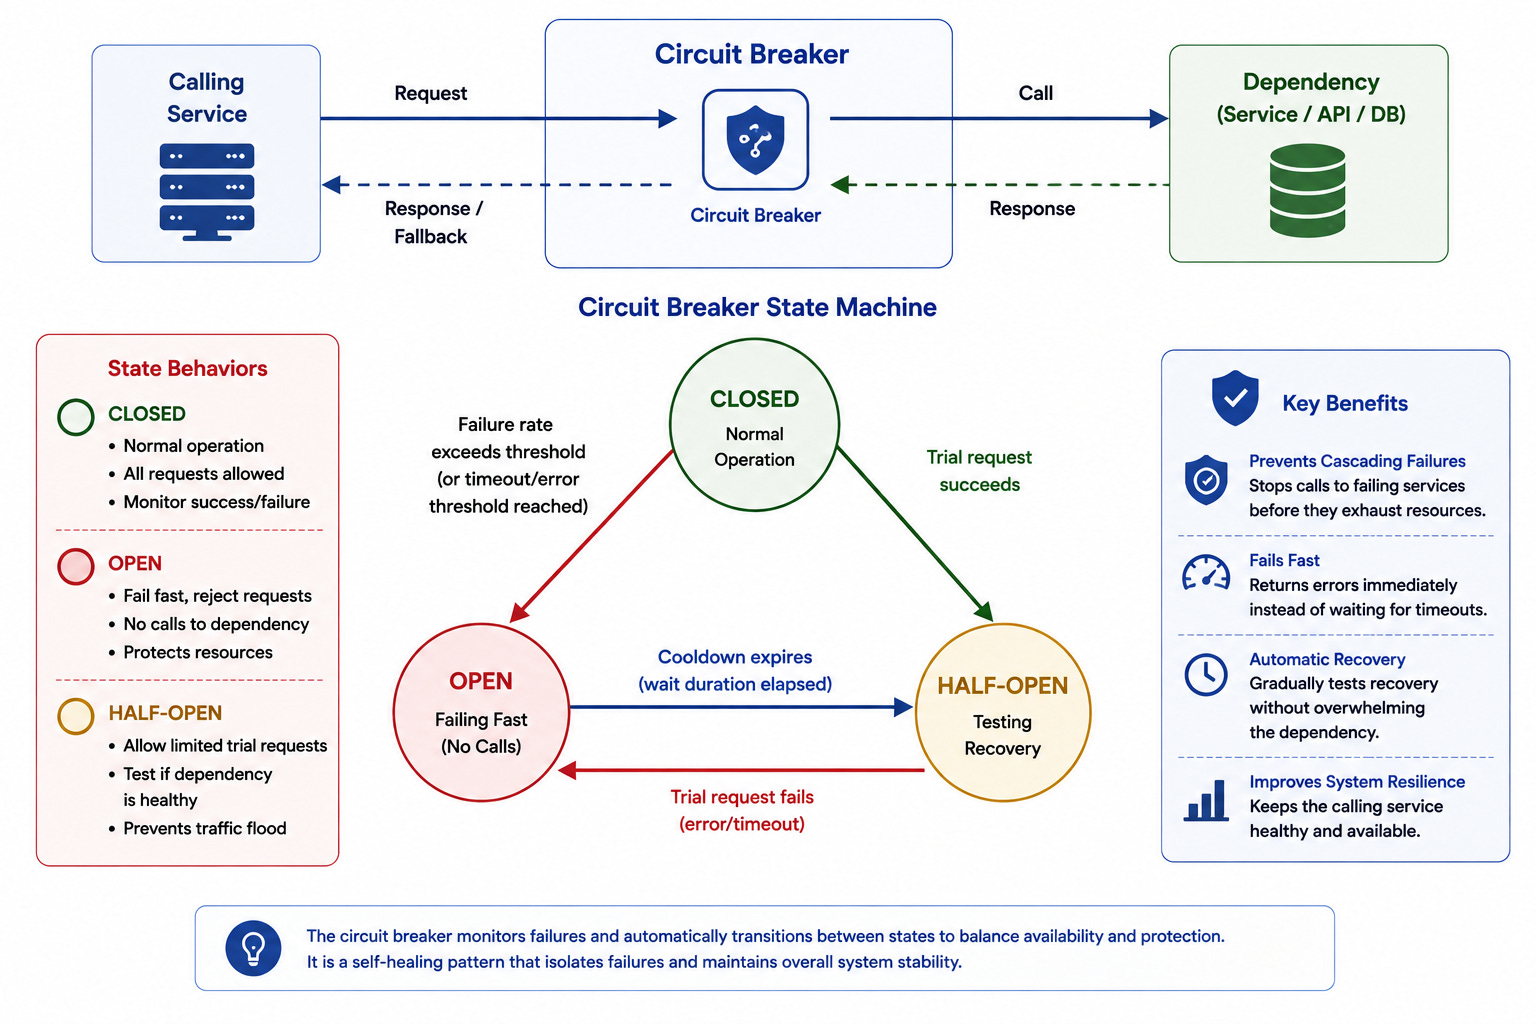
Trade-off: The breaker adds latency to the detection of recovery. The half-open state is the mechanism for detecting recovery without overwhelming a fragile dependency.
What it shows: How a multi-step distributed transaction maintains consistency through compensating actions.
Draw a saga orchestrator in the center.
Draw three services below: payment, inventory, shipping.
Draw numbered forward arrows (1, 2, 3) for the happy path.
Draw compensating action boxes below each service (refund, release, cancel).
Draw a failure arrow from step three back to the orchestrator with backward arrows triggering compensations for steps two and one in reverse order.
The saga pattern achieves eventual consistency across services without distributed locking by undoing completed steps when later steps fail.
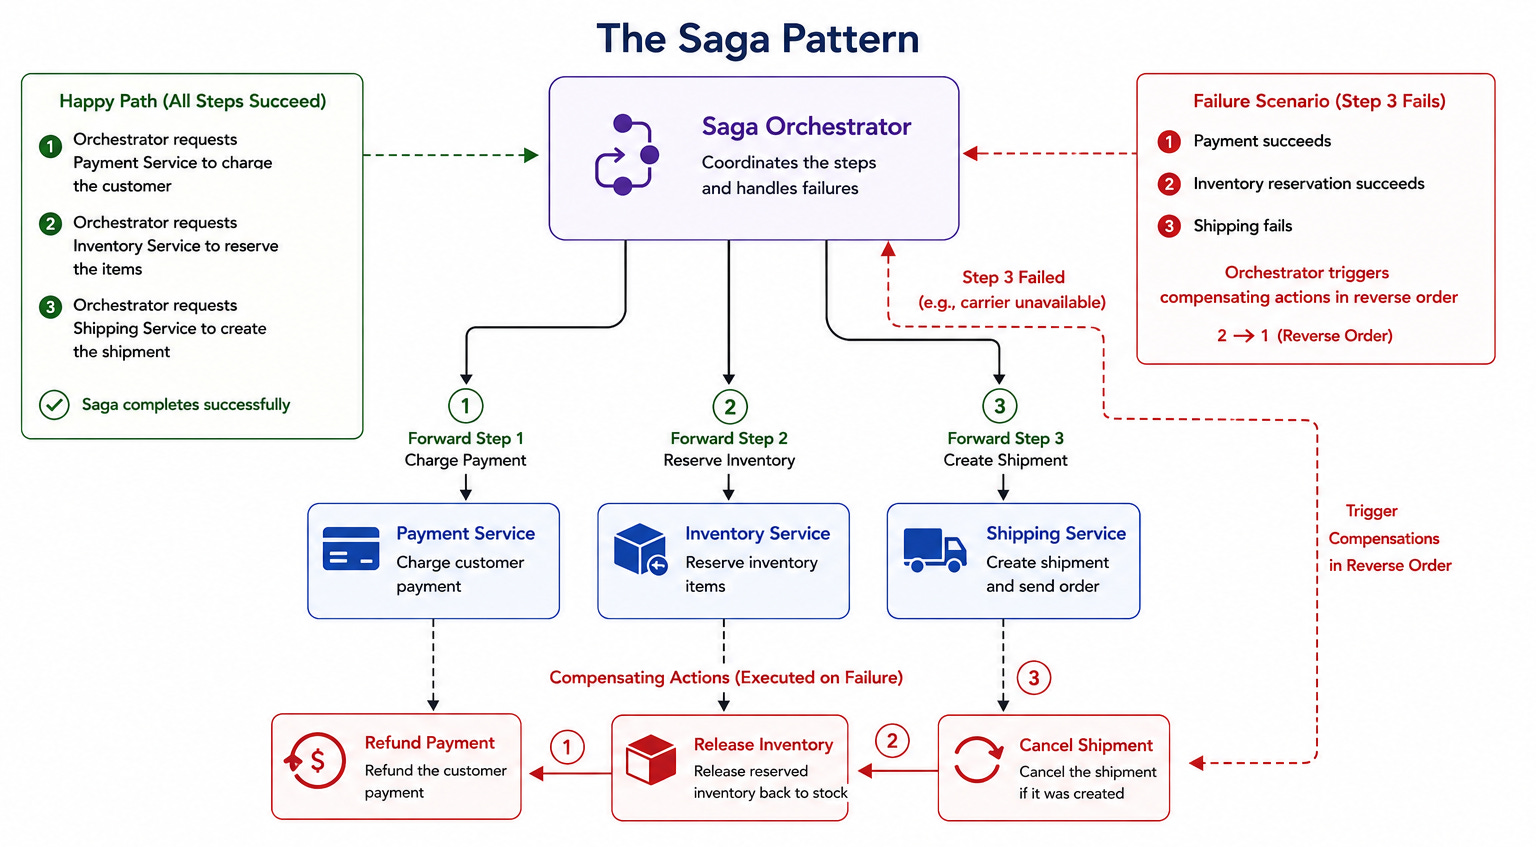
Trade-off: The system passes through visible intermediate states. Compensating actions must themselves be idempotent. Some actions like sent emails cannot be truly undone.
What it shows: How state is derived from an ordered sequence of immutable events rather than stored directly.
Draw an event log on the left as a vertical sequence of immutable events: AccountCreated, MoneyDeposited 100, MoneyWithdrawn 30, MoneyDeposited 50.
Draw an arrow from the log to a current state projection on the right showing the derived balance of 120.
Draw a snapshot box showing the state periodically saved to avoid replaying the full log.
Draw a second projection showing a different view derived from the same events.
Event sourcing makes the full history of a system’s state queryable and enables multiple derived views from the same event stream.
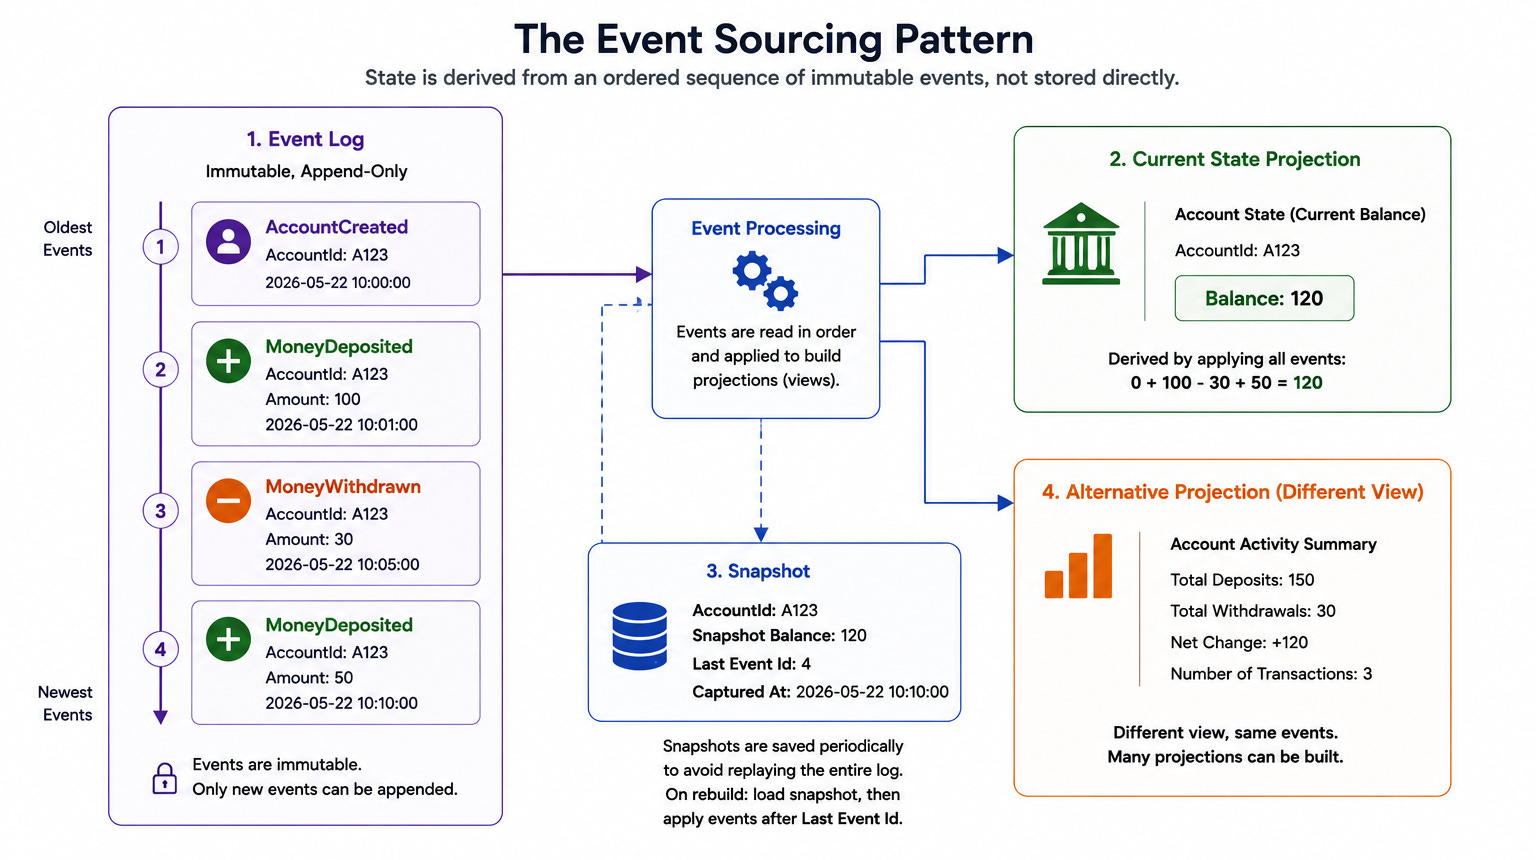
Trade-off: Querying current state requires replaying events unless a snapshot is maintained. Event schemas must be carefully versioned because old events cannot be changed.
What it shows: How read and write models are separated to optimize each independently.
Draw a command side on the left receiving write commands: PlaceOrder, UpdateInventory.
Draw the commands flowing to a domain model that validates and processes them, producing events that are written to an event store.
Draw an event handler on the right consuming events and updating a read model database optimized for queries.
Draw query requests going directly to the read model and returning denormalized responses shaped for the UI.
CQRS allows the write model to optimize for consistency and the read model to optimize for query performance independently.
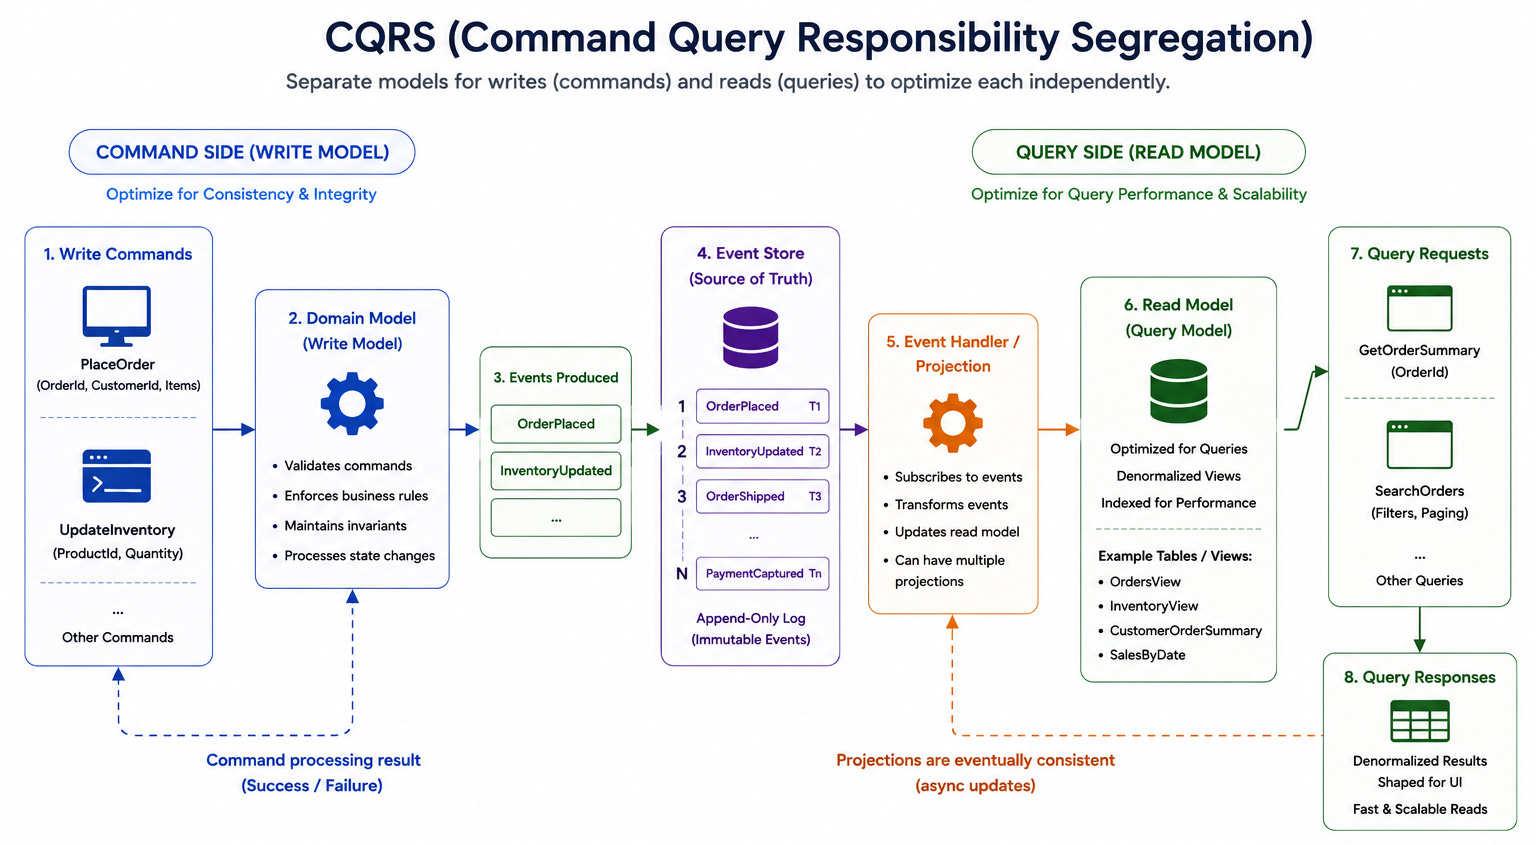
Trade-off: The read model is eventually consistent with the write model. Queries may not reflect the very latest writes.
The pattern adds complexity that is only justified for complex domains with very different read and write requirements.
What it shows: How a distributed transaction achieves atomicity across multiple participants.
Draw a coordinator in the center.
Draw three participant databases arranged below it.
Draw phase one with the coordinator sending prepare to all participants and each responding with yes or no.
Draw phase two branching: if all yes then coordinator sends commit to all, if any no then coordinator sends abort to all. Annotate the blocking window between phase one and phase two where participants hold locks waiting for the coordinator’s decision.
Two-phase commit provides strict atomicity across participants but blocks if the coordinator fails between phases.
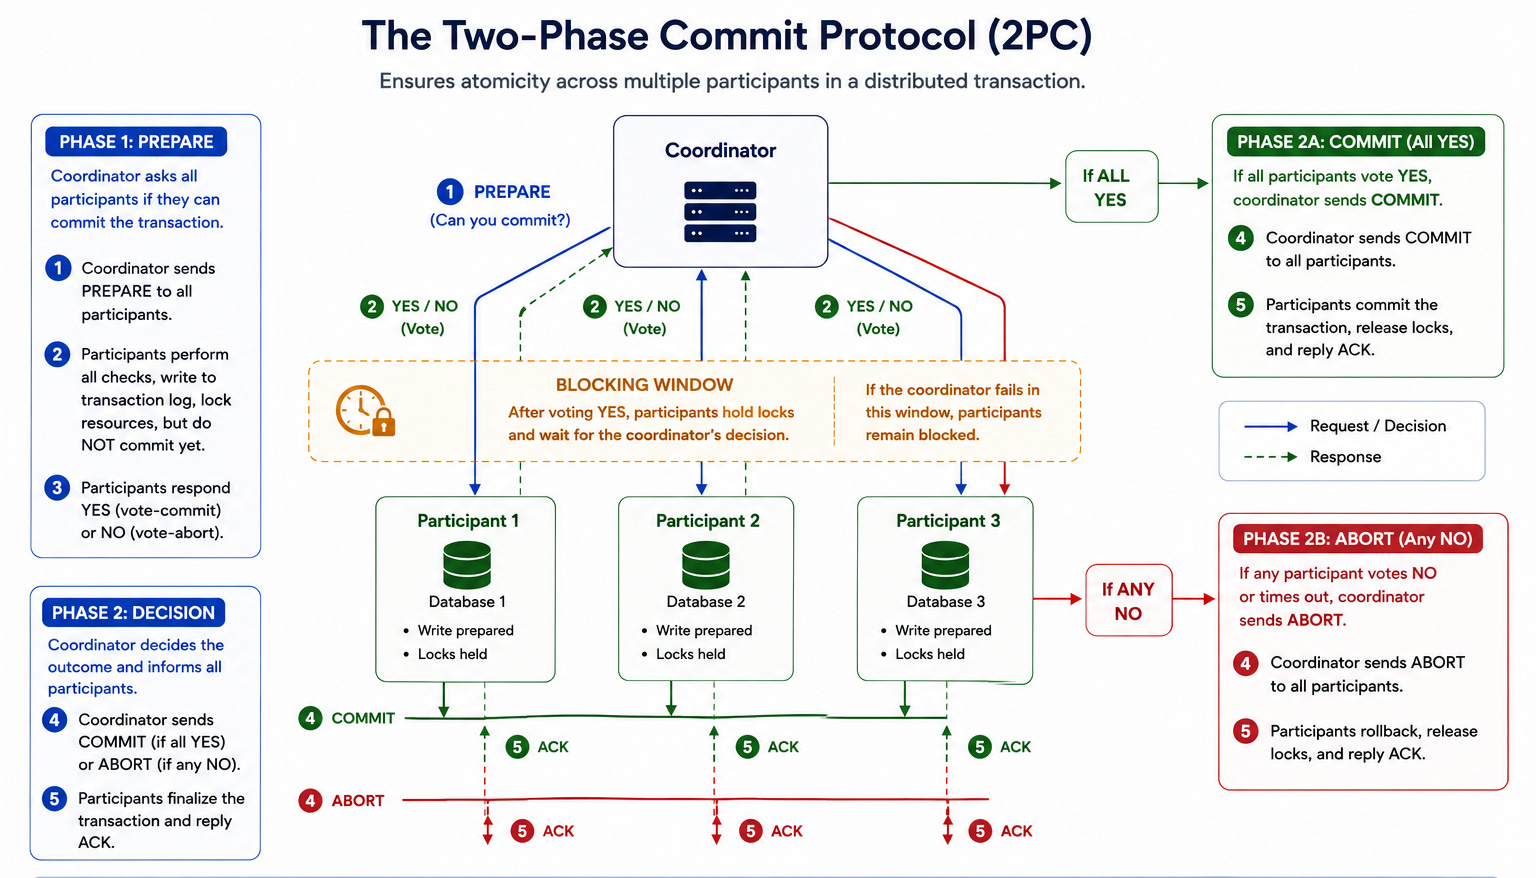
Trade-off: If the coordinator crashes after participants have voted yes but before sending commit, participants hold locks indefinitely. This blocking makes 2PC fragile at scale.
What it shows: How information propagates across a distributed cluster without a central coordinator.
Draw twelve nodes arranged in a cluster. Highlight one node that has new information (a new membership record).
Draw it selecting three random peers and sending the information.
Draw those three nodes in the next round each selecting three random peers and propagating further.
After three rounds, show most nodes having received the information. Annotate the exponential spread with a note about log(N) rounds to reach all N nodes.
Gossip provides eventually consistent information dissemination that is resilient to node failures because no single path exists for information to travel.
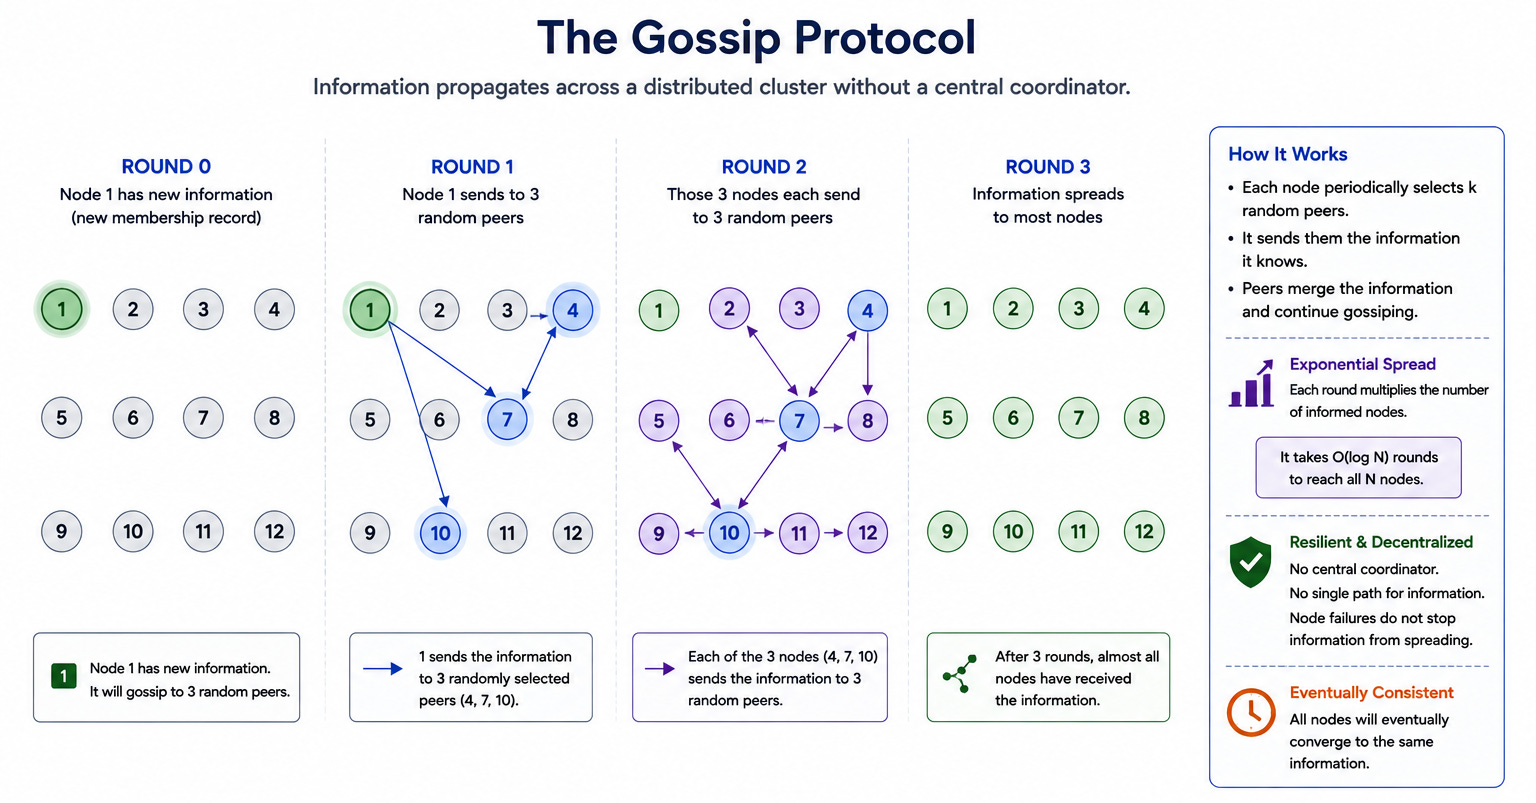
Trade-off: Gossip is eventually consistent. Information takes a bounded but non-zero time to propagate. Network overhead scales with gossip frequency and cluster size.
What it shows: How causal ordering is tracked across distributed nodes without synchronized clocks.
Draw three nodes A, B, C each with a vector clock initialized to [0,0,0].
Show node A sending a message to B after incrementing its clock to [1,0,0].
Show B receiving the message and updating to [1,1,0].
Show B sending to C which becomes [1,1,1].
Show A and C each performing independent operations making A=[2,0,0] and C=[1,1,2].
Draw a comparison showing that [1,0,0] causally precedes [1,1,0] because all positions are less than or equal, and that [2,0,0] and [1,1,2] are concurrent because neither dominates.
Vector clocks capture which events could have caused other events without relying on synchronized wall-clock time.
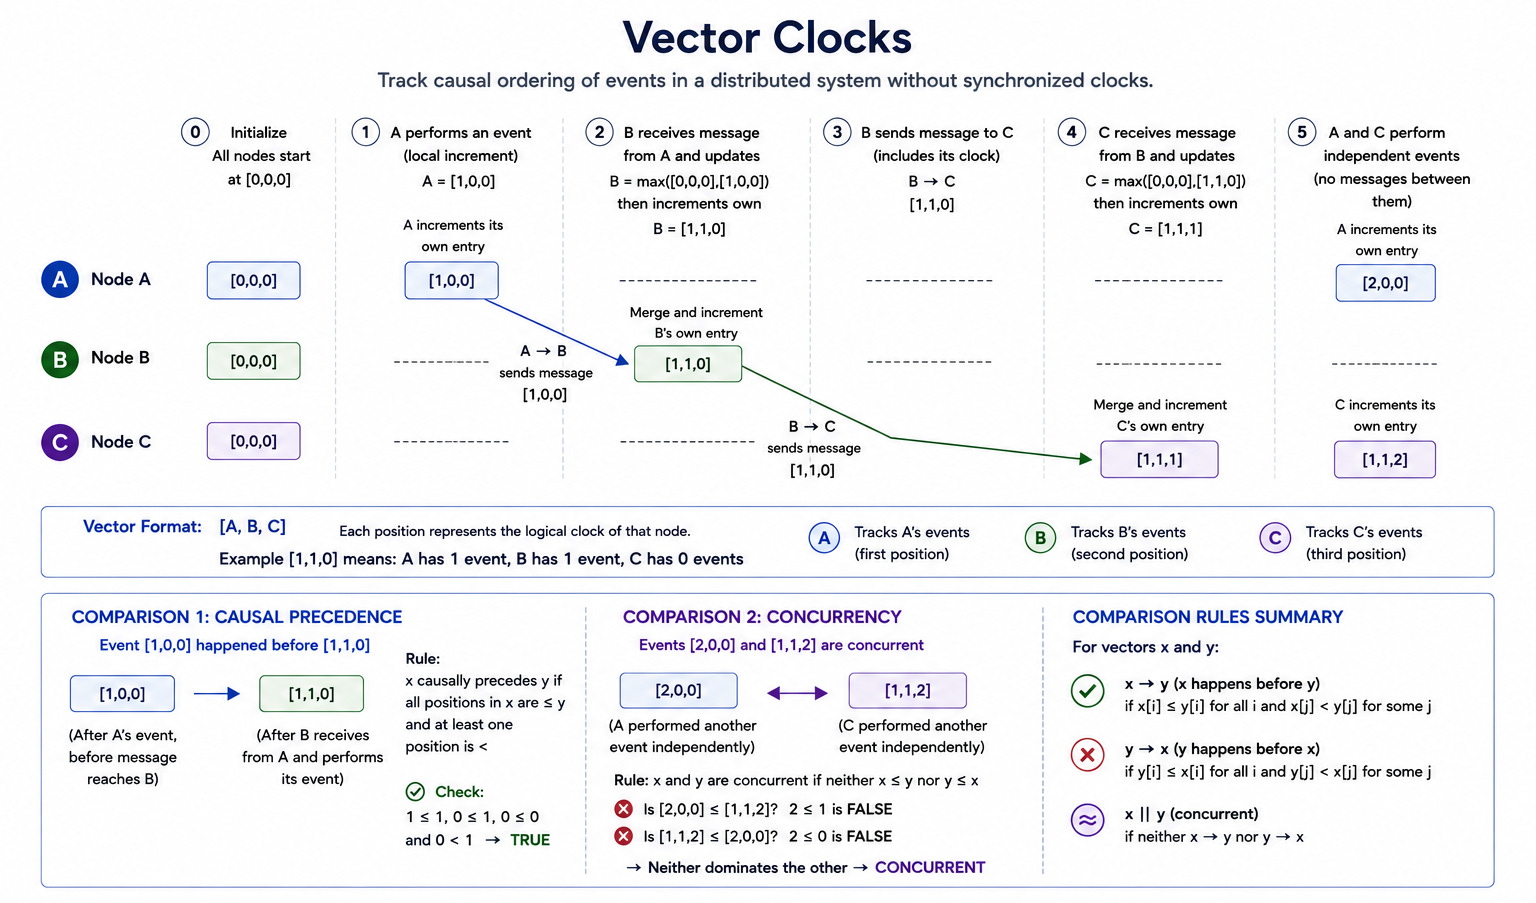
Trade-off: Vector clocks grow proportionally to the number of nodes. At large scale the storage and transmission cost becomes significant.
What it shows: How a distributed lock prevents concurrent access while handling slow or crashed holders safely.
Draw three workers competing to acquire a lock from a coordination service. Show one acquiring the lock and receiving fencing token 33.
Show the worker pausing (GC or slow I/O) and the lock TTL expiring.
Show a second worker acquiring the lock and receiving token 34.
Show the second worker writing to the protected resource with token 34.
Show the first worker resuming and attempting to write with token 33. Show the protected resource rejecting the write because 33 is less than the highest seen token 34.
Fencing tokens prevent stale lock holders from causing damage after their lock has expired.
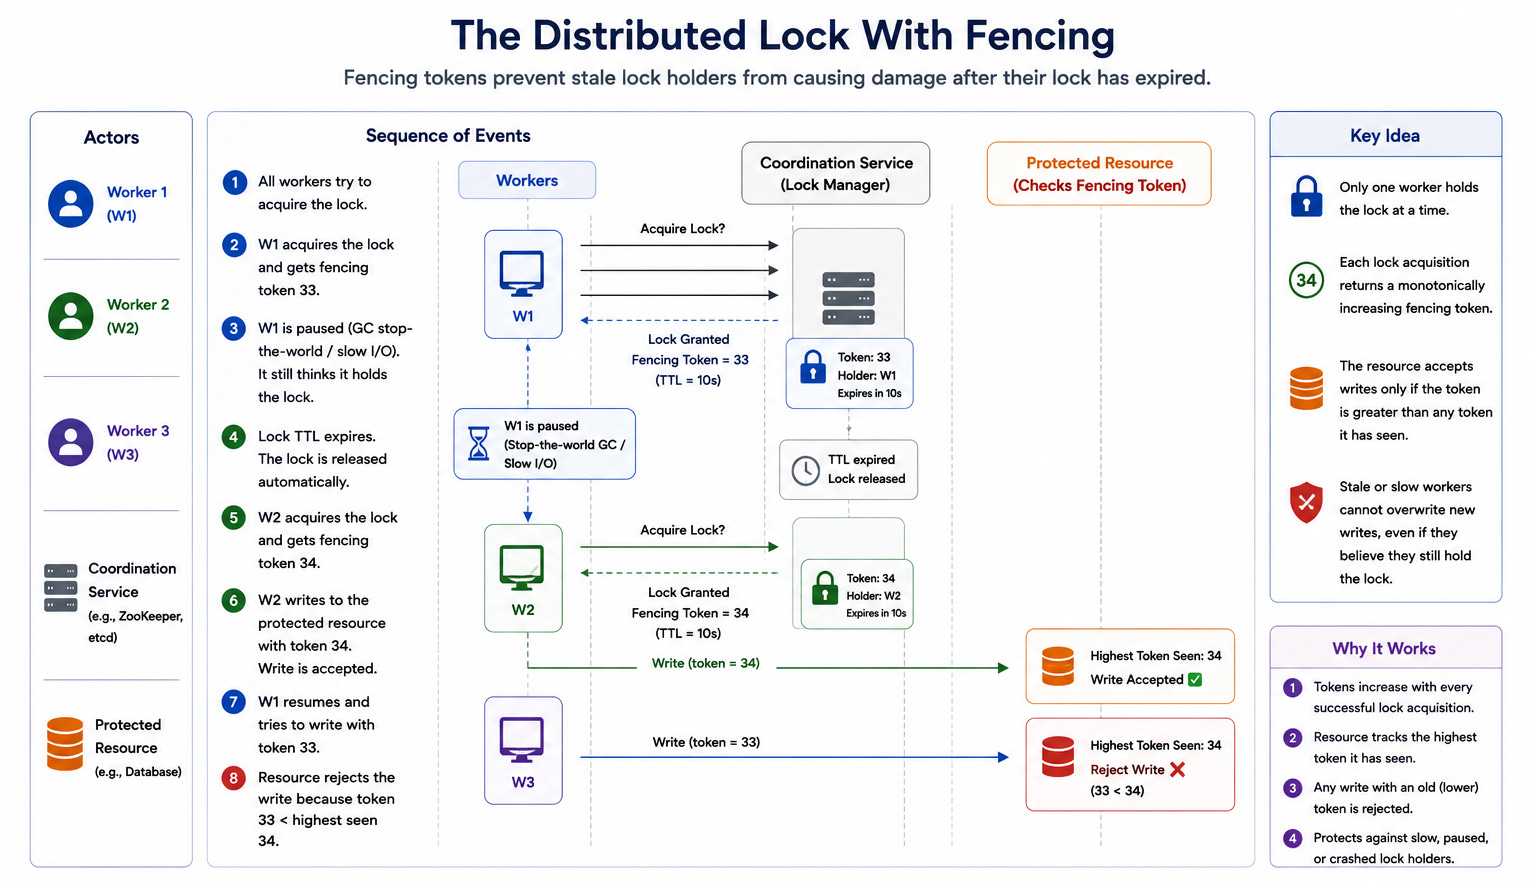
Trade-off: The protected resource must track the highest seen token and reject older ones, adding state that must be managed and persisted.
What it shows: How persistent bidirectional connections scale across multiple servers.
Draw many clients connected to multiple WebSocket servers with solid persistent connection lines.
Draw a Redis pub-sub bus connecting all WebSocket servers.
Draw a connection registry (Redis) mapping user IDs to server IDs.
Draw a backend service publishing a message to the pub-sub bus.
Draw the bus routing the message to the specific WebSocket server holding the target user’s connection, which then pushes it to the client.
The connection registry and pub-sub backplane are the components that allow WebSocket delivery to scale beyond a single server.
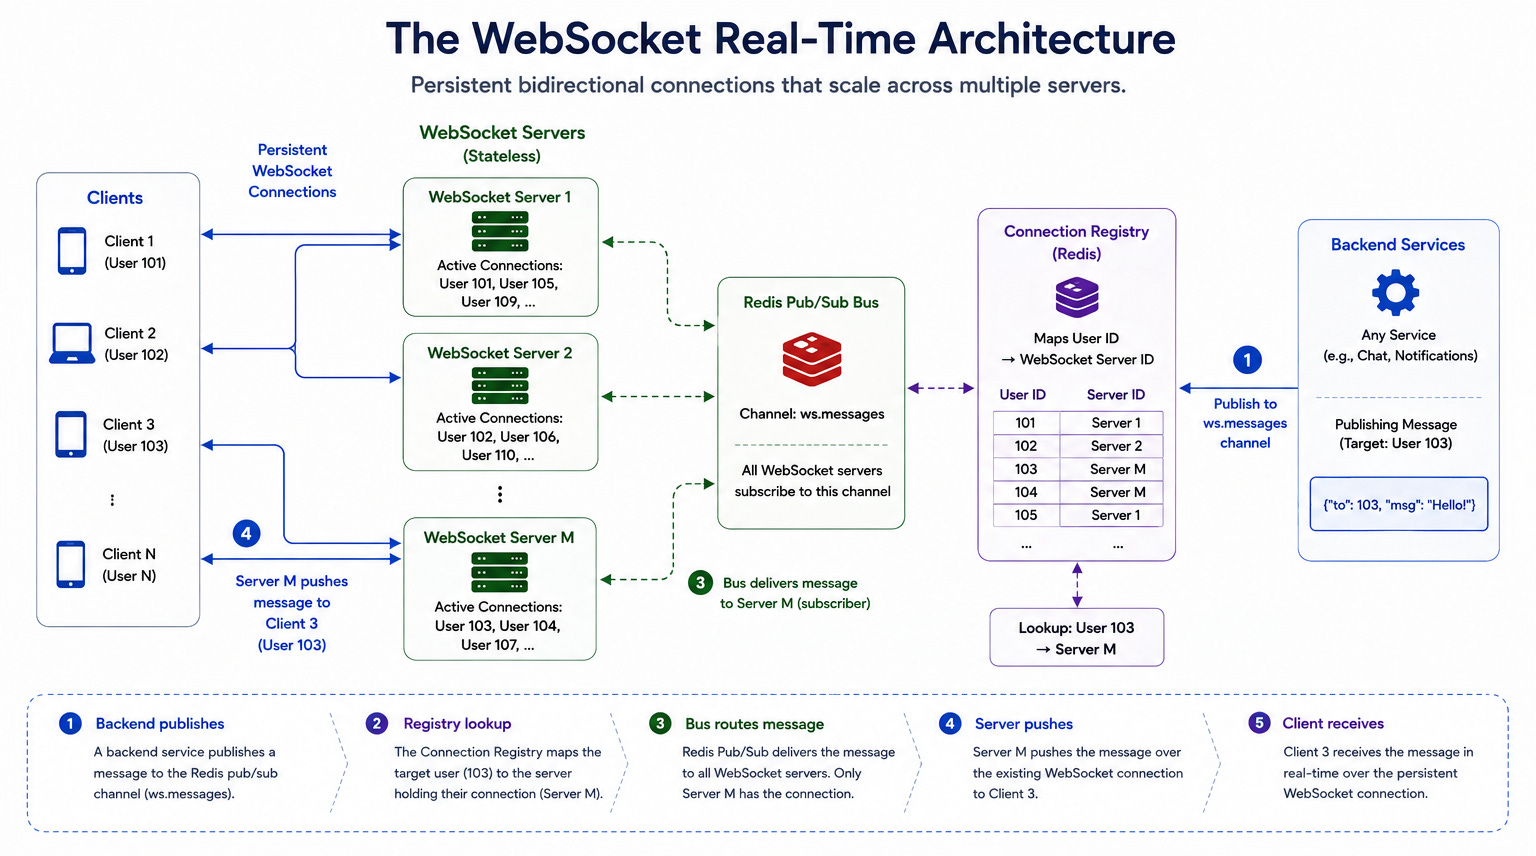
Trade-off: The connection registry must be updated reliably as users connect and disconnect. A stale registry causes missed message deliveries.
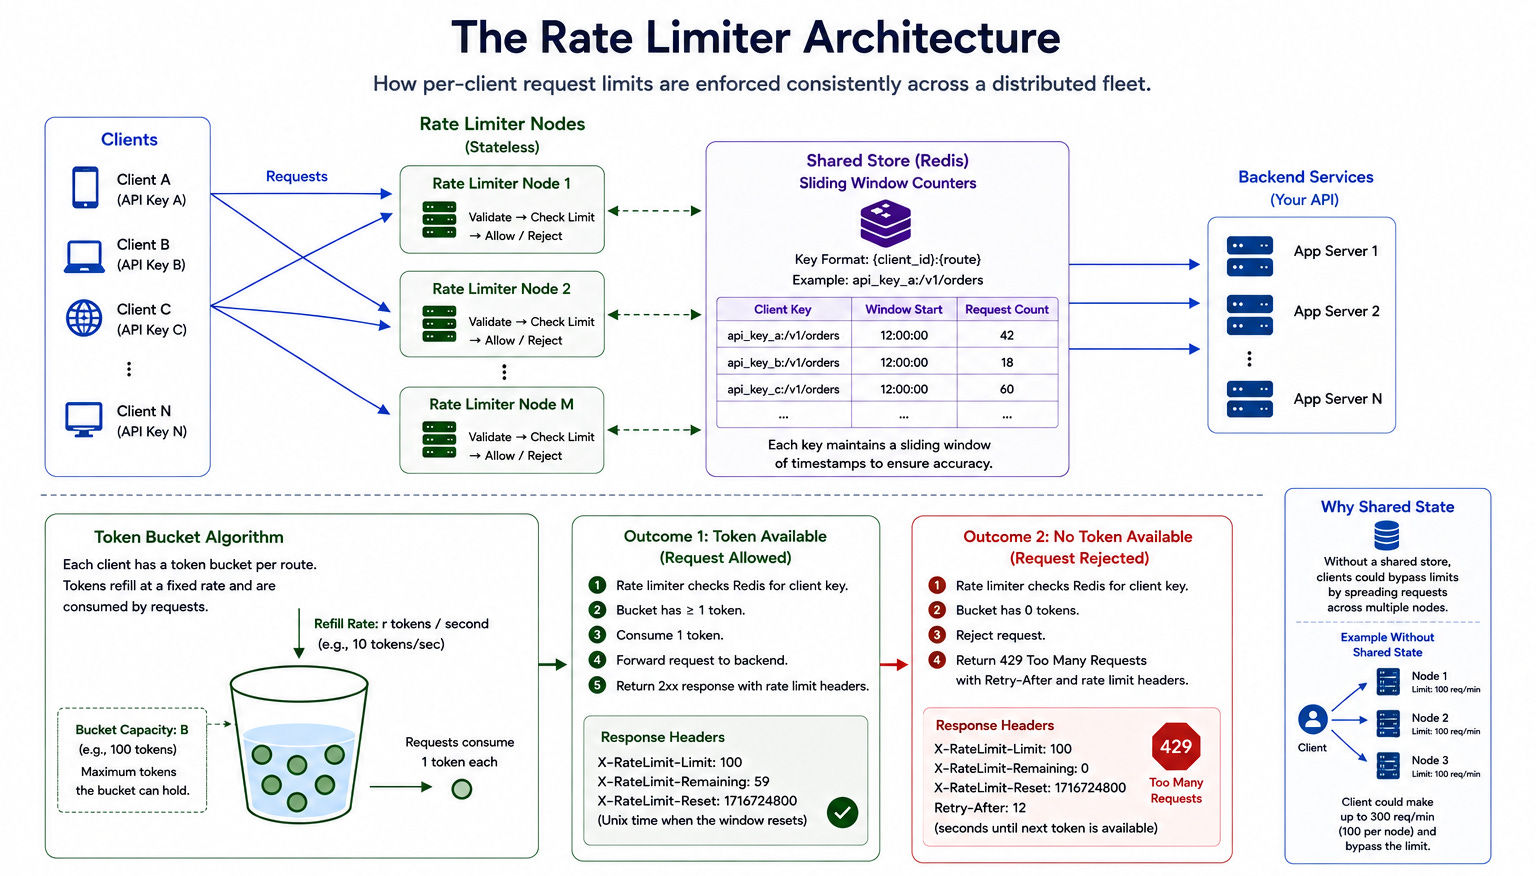
What it shows: How per-client request limits are enforced consistently across a distributed fleet.
Draw clients sending requests to multiple rate limiter nodes.
Draw a shared Redis store behind all nodes holding sliding window counters per client key.
Draw the token bucket algorithm: a bucket filling at a fixed rate and emptying as requests consume tokens.
Draw two outcomes: token available (request passes, token consumed) and no token available (request rejected with 429 and retry-after header). Label the response headers: X-RateLimit-Limit, X-RateLimit-Remaining, X-RateLimit-Reset.
Shared state is required for a distributed rate limiter to prevent clients from bypassing limits by distributing requests across nodes.
Trade-off: Every request requires a Redis read and write on the critical path. The Redis store must be highly available or rate limiting fails open.
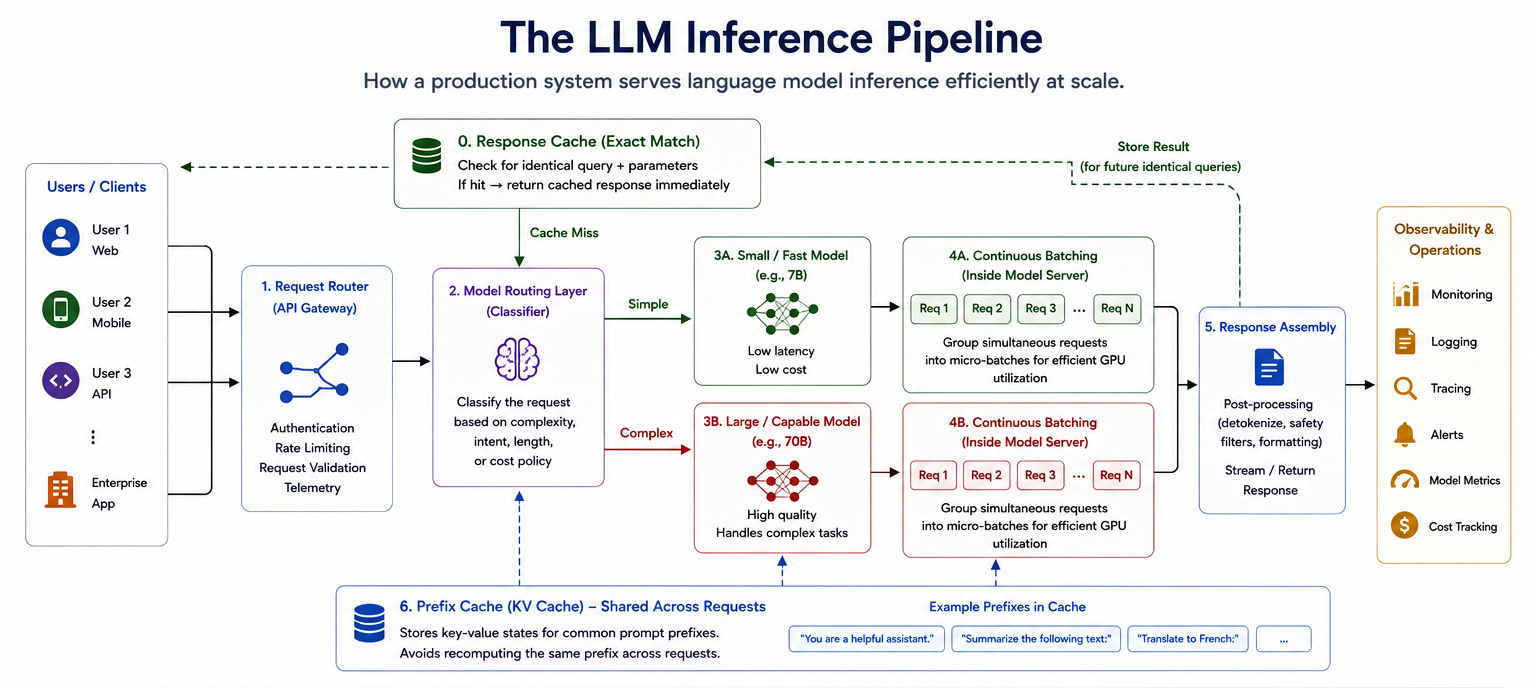
What it shows: How a production system serves language model inference efficiently at scale.
Draw a request router receiving user queries.
Draw a model routing layer classifying requests as simple or complex.
Draw simple requests going to a small fast model and complex requests going to a large capable model.
Draw a prefix cache (KV cache) shared across requests showing how repeated prompt prefixes avoid recomputation.
Draw a continuous batching layer inside each model grouping simultaneous requests.
Draw a response cache at the top for identical queries returning cached responses without inference.
The combination of model routing, prefix caching, and continuous batching makes LLM inference economically viable at scale.
Trade-off: Model routing requires accurate complexity classification. A misrouted complex request to the small model produces poor quality. A misrouted simple request to the large model wastes cost.
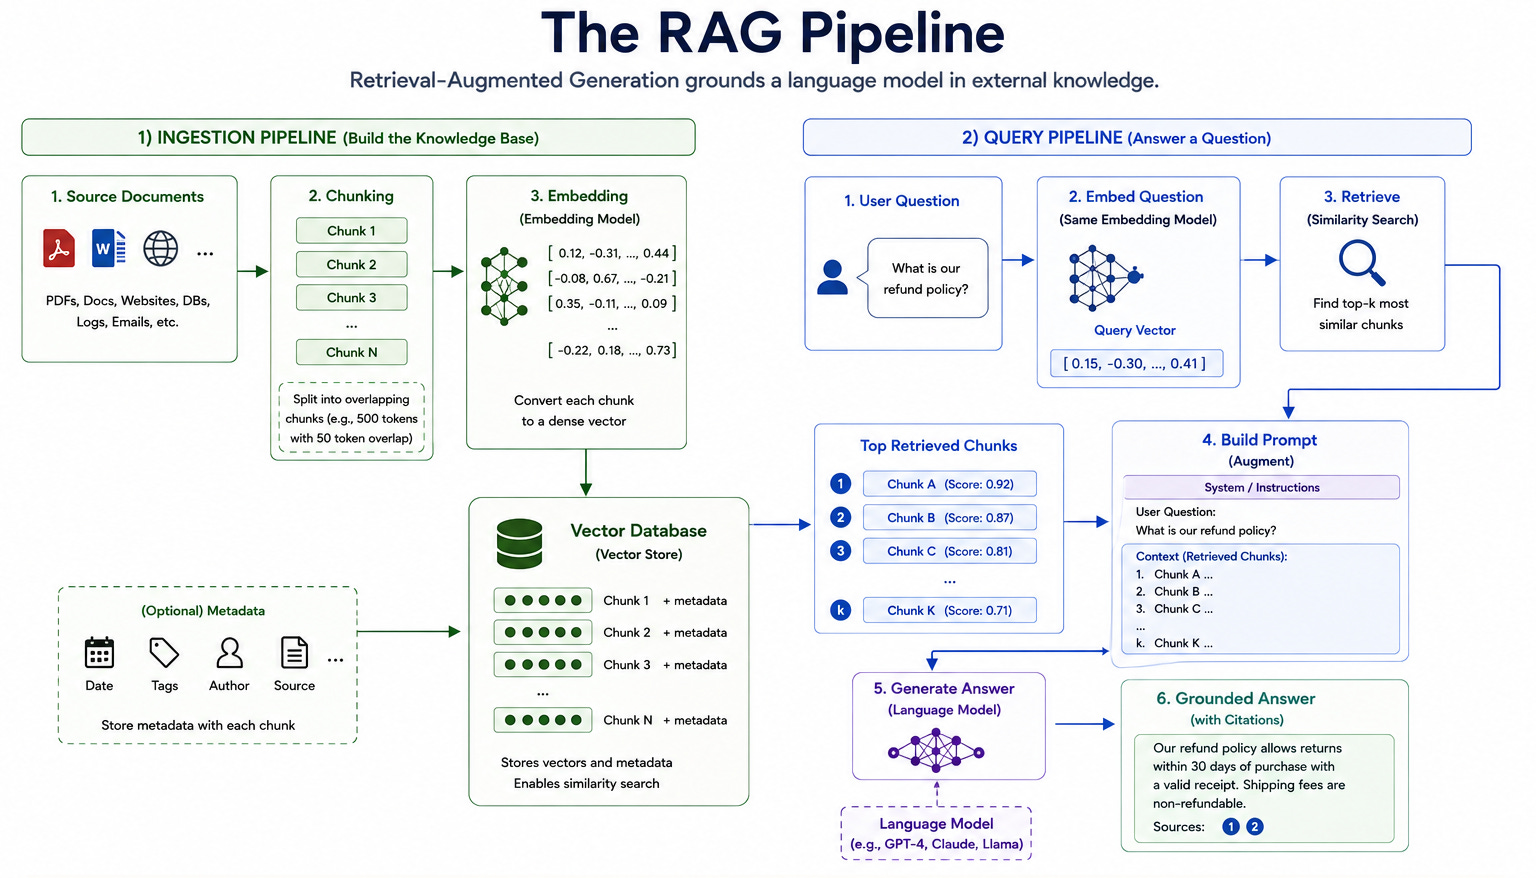
What it shows: How a language model is grounded in external knowledge through retrieval.
Draw two clearly labeled flows.
Ingestion on the left: source documents chunked into pieces, each chunk embedded by an embedding model into a vector, vectors stored in a vector database.
Query on the right: user question embedded by the same model into a query vector, vector database searched for similar chunks, top chunks combined with the question into a prompt, prompt sent to the language model, model returns a grounded answer citing retrieved chunks.
RAG enables language models to answer questions about private or current data they were not trained on.
Trade-off: Answer quality is bounded by retrieval quality. If retrieval returns irrelevant chunks, the model produces a confident answer grounded in wrong information. Hybrid search combining semantic and keyword matching improves retrieval.
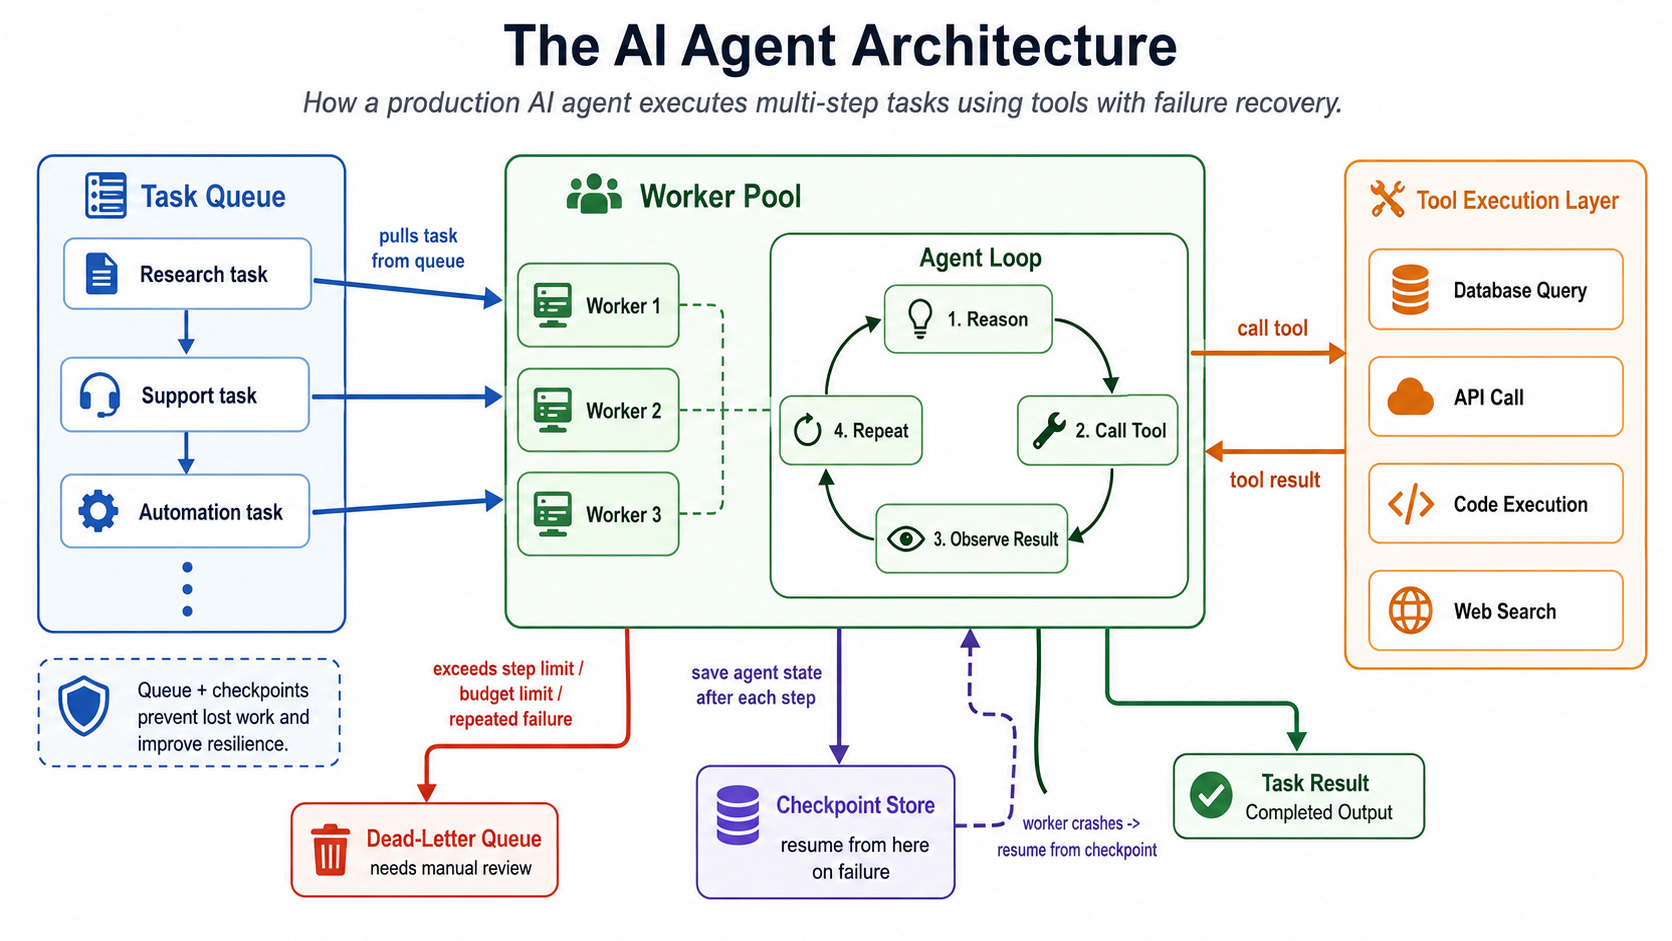
What it shows: How a production AI agent executes multi-step tasks using tools with failure recovery.
Draw a task queue receiving agent tasks on the left.
Draw a worker pool pulling tasks and running an agent loop: reason, call tool, observe result, repeat.
Draw a tool execution layer with specific tools: database query, API call, code execution, web search.
Draw a checkpoint store receiving the agent state after each step labeled resume from here on failure. Draw a dead-letter queue for tasks exceeding step or budget limits.
The queue and checkpoint store make agent tasks resilient to worker failure without losing expensive completed work.
Trade-off: Checkpointing adds storage overhead per step. Long-running tasks accumulate checkpoint state that must be cleaned up after completion or failure.
What it shows: How a single event reaches potentially millions of recipients efficiently.
Draw a triggering event (a new post) on the left.
Draw a fan-out service reading the author’s follower list from a graph store.
Draw two paths: a push path writing directly to follower feed caches for accounts with fewer than ten thousand followers, and a pull path skipping pre-computation for accounts with millions of followers.
At read time, draw a hybrid assembly combining push-populated cache entries with real-time pulls from large accounts.
The hybrid approach prevents write amplification for celebrity accounts while maintaining fast feed reads for normal users.
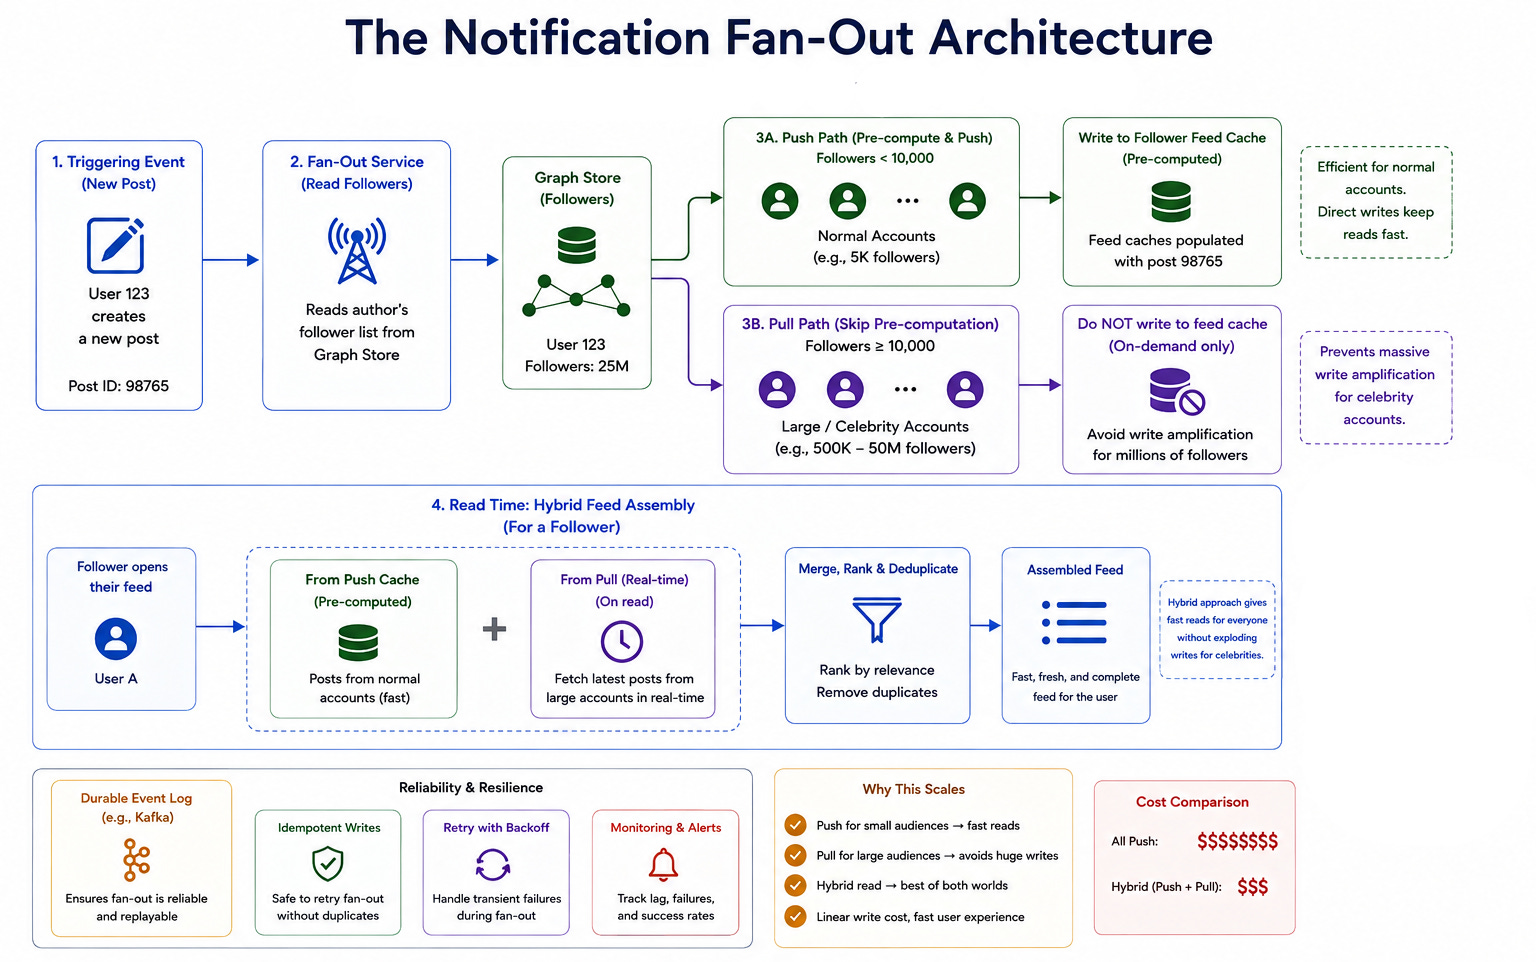
Trade-off: The threshold for switching from push to pull must be tuned. Celebrity accounts on the pull path have slower feed loads than regular accounts.
What it shows: How CQRS and event sourcing combine to create a fully auditable, scalable data architecture.
Draw commands entering a domain model on the left that validates them and produces events.
Draw events appending to an immutable event store in the center.
Draw multiple event handlers consuming the events and updating separate read model databases: one for user-facing queries, one for analytics, one for search. Draw the ability to replay all events to rebuild any read model from scratch. Draw snapshots periodically saving state to avoid full replay.
The combination provides complete auditability (the event log), multiple optimized read models, and the ability to rebuild any view from history.
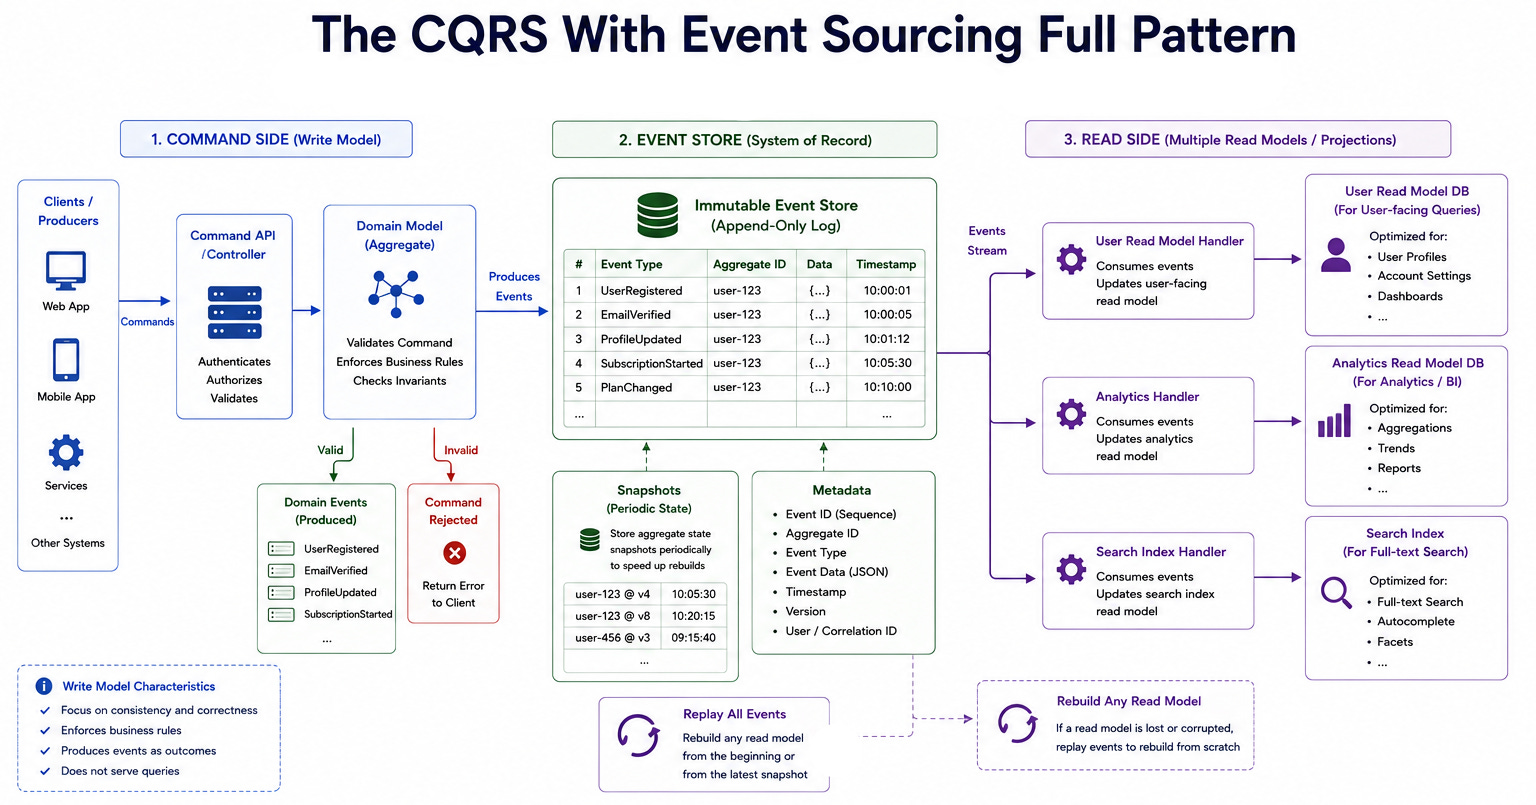
Trade-off: Eventual consistency between the write model and all read models. Complex to implement and operate. Justified only for domains where auditability and multiple read models are genuine requirements.
What it shows: How services find each other in a dynamic environment where instances start and stop.
Draw multiple service instances registering themselves with a service registry (Consul or Etcd) on startup, including their IP address and health check endpoint.
Draw a client wanting to call the payment service querying the registry for available payment service instances.
Draw the registry returning a list of healthy instances with their addresses.
Draw the client load balancing across the returned instances directly.
Draw a health check loop showing the registry removing instances that fail their health checks.
Service discovery enables dynamic routing in environments where service locations change constantly.
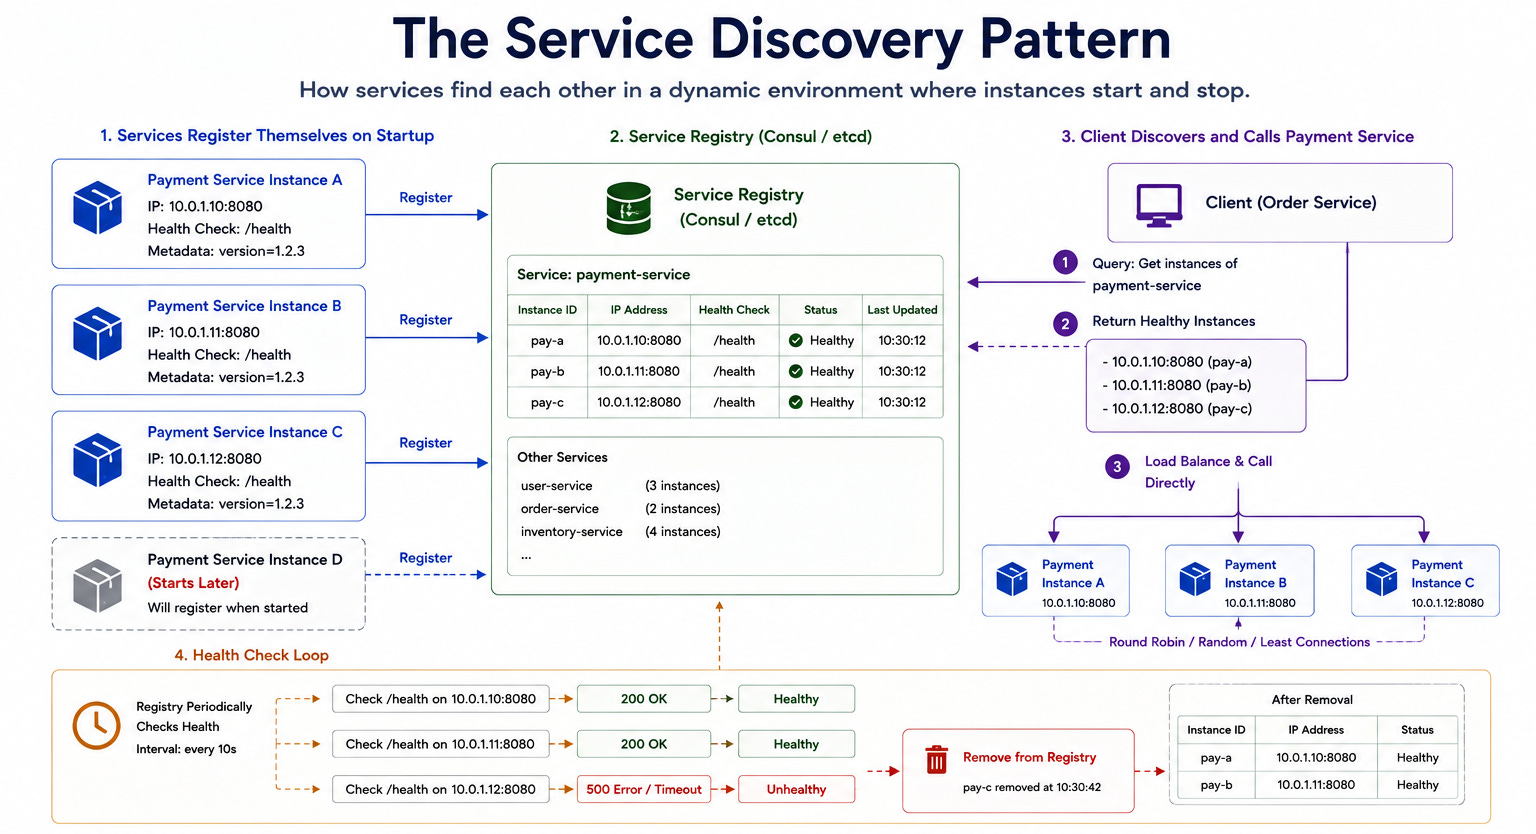
Trade-off: The service registry is a critical dependency that must be highly available. If the registry is unavailable, services cannot discover each other even if they are all running.
What it shows: How resource isolation prevents a failing dependency from consuming all of a service’s capacity.
Draw a service with a shared thread pool on the left labeled without bulkheads.
Draw all traffic going through the same pool, with one slow dependency filling all threads and leaving none for other operations.
Draw the same service on the right with separate thread pools per dependency: payment pool, inventory pool, notification pool. Show the payment pool full with a slow dependency while inventory and notification pools remain available and operational.
Bulkheads contain the impact of a failing dependency to the resource pool allocated to that dependency rather than consuming all shared resources.
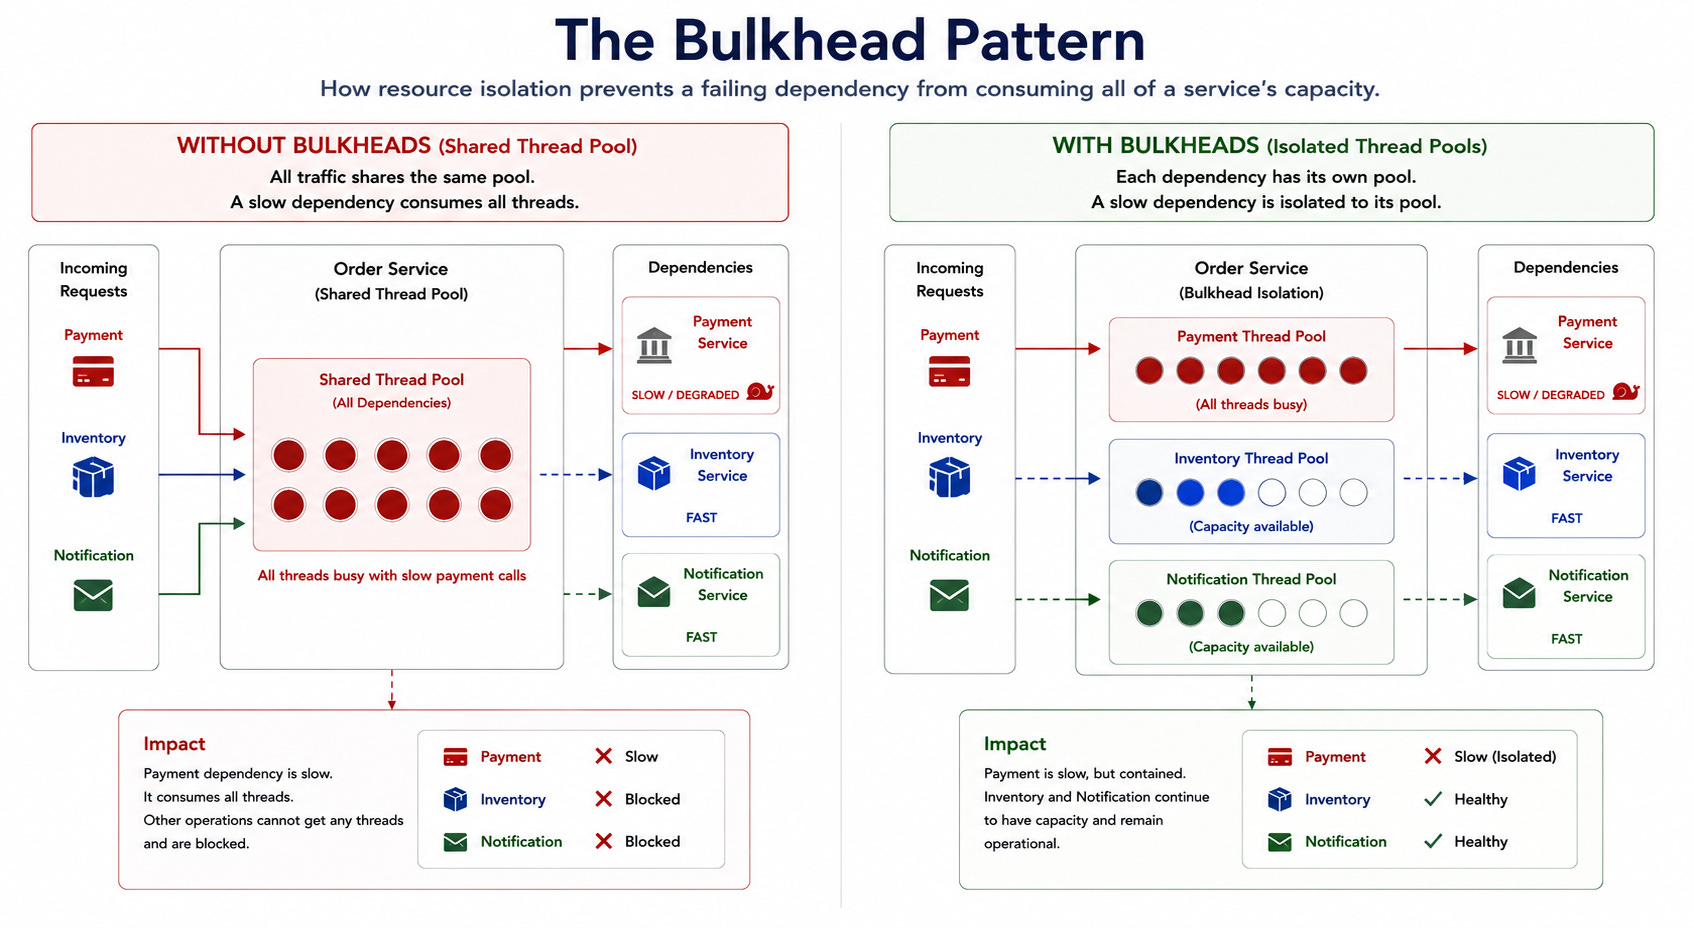
Trade-off: Each isolated pool has a fixed size that must be tuned. Too small and the pool exhausts under normal load. Too large and memory is wasted on idle threads.
What it shows: A complete system incorporating the most important patterns from this entire post.
Draw the complete layered system: DNS resolving to a global load balancer, CDN serving static assets, a load balancer distributing to a stateless application tier, a Redis cache in front of a primary database with read replicas, a Kafka message queue feeding async worker consumers, an S3 object store for large files, an Elasticsearch search service, WebSocket servers for real-time features backed by a Redis pub-sub bus, and a monitoring layer with distributed tracing across all components.
This is the template that every specific design starts from and removes what is not needed.
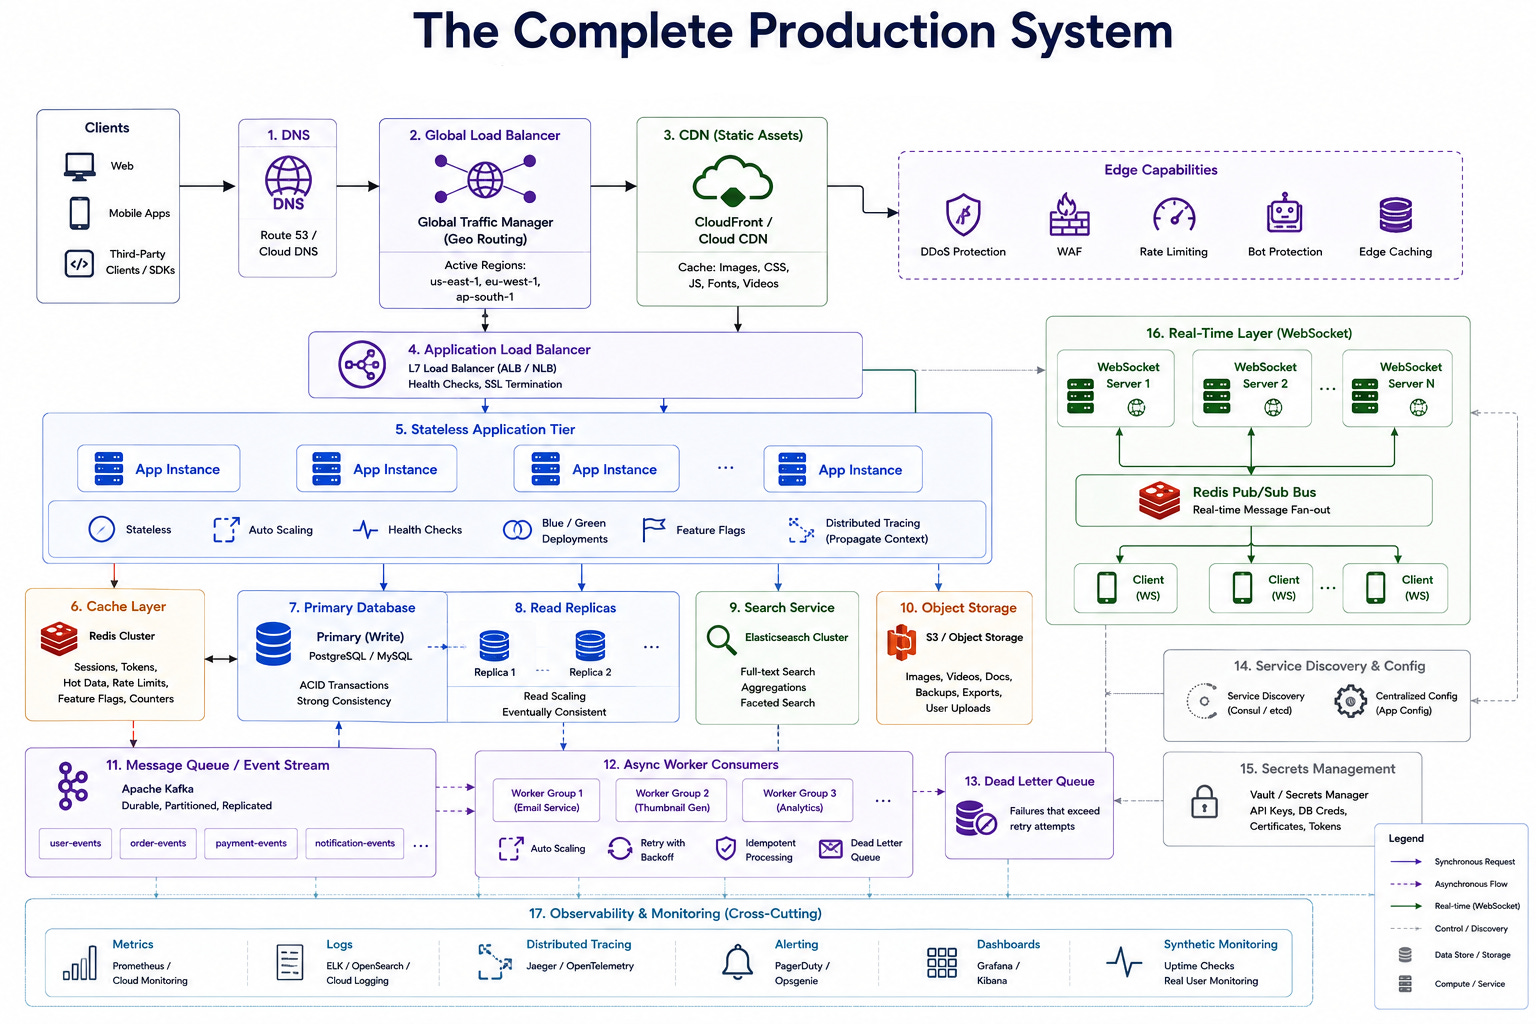
Trade-off: Including every component adds complexity that must be justified. The right design removes every component that the specific requirements do not demand and goes deep on the ones that remain.
Reading these diagrams in one sitting builds the mental model. Using them effectively requires understanding the relationship between them.
The diagrams in sections one and two are the building blocks. Almost every design uses some combination of these.
Section one covers how traffic flows and how the system scales.
Section two covers how data is stored and accessed. These forty diagrams exist to answer two questions: how does traffic get to my system, and what does my system do with data.
The diagrams in sections three and four address the harder problems that appear when the basic design is established.
Section three covers the correctness and coordination challenges that distributed systems introduce.
Section four covers the modern patterns for real-time systems and AI features.
The practice method is the same as with any skill.
Read the diagrams once to understand them. Close the post and draw each one from memory.
Note where you hesitate or get stuck. Return to those specific diagrams. Repeat until every diagram takes under two minutes to draw from memory.
Two minutes per diagram is the target because that is the pace required in an interview where you draw and narrate simultaneously.
The forty diagrams in this post cover the entire vocabulary of production system design.
Every system you will ever design is some combination of these patterns, adapted to specific requirements.
Once you know them, designing a system becomes recognizing which patterns apply and adapting them rather than inventing from scratch.
The ten infrastructure diagrams cover how traffic flows from users to services, how systems scale horizontally, how failures are handled through active-passive and active-active redundancy, and how CDNs and API gateways optimize the request path.
The ten data and storage diagrams cover replication, sharding, caching patterns, consistent hashing, the write-ahead log, the outbox pattern, time-series pipelines, search indexing, and polyglot persistence.
The ten distributed systems diagrams cover the CAP theorem, Raft consensus, circuit breakers, sagas, event sourcing, CQRS, two-phase commit, gossip protocols, vector clocks, and distributed locks with fencing.
The ten modern diagrams cover WebSocket real-time architecture, rate limiting, LLM inference, RAG pipelines, AI agents, notification fan-out, CQRS with event sourcing combined, service discovery, bulkheads, and the complete production system template.
Every diagram has a trade-off and the strongest answers name it explicitly rather than presenting the pattern as a free optimization.
Practice drawing from memory until every diagram takes under two minutes to reproduce cleanly, because the fluency with which you draw signals the depth with which you understand.
Forty diagrams. The complete vocabulary of system design. Ninety minutes to read through all of them.
The rest is practice.
No posts
Comments
Nothing yet. Say the first thing.
Sign in to join the conversation.