

Why caching diagrams win interviews
Cache mechanics diagrams
Cache pattern diagrams
Cache failure diagrams
Cache scaling diagrams
In a system design interview, adding a cache is easy. The system has a database, reads are slow, the candidate draws a Redis box between the application servers and the database, says this will speed up reads, and moves on. The interviewer nods and asks the follow-up.
What happens when the cache is cold?
What is your eviction policy and why?
What happens if two services write different values for the same key?
How do you handle cache invalidation when the underlying data changes?
What happens when a popular key expires and ten thousand requests all miss simultaneously?
How does the cache stay consistent across multiple application servers?
These questions are not difficult if you understand caching deeply. They are impossible if you only know how to draw the box.
The difference is whether you can visualize the mechanism behind each caching concept, the internal state of the cache, the flow of reads and writes, the failure paths, and the system behavior under stress.
Diagrams are the fastest way to build that visualization. Ten of them, each covering a distinct caching concept, give you a complete mental model that holds up under any follow-up question an interviewer asks about caches.
What it shows: The fundamental read flow through a cache and what happens differently on a hit versus a miss.
What to draw: Draw three components in a horizontal line: application server on the left, cache (Redis) in the center, database on the right. Draw two numbered flows.
Flow A (Cache Hit): arrow from application server to cache labeled step 1 check cache. Arrow from cache back to application server labeled step 2a cache hit, return value immediately. Mark this path with a fast label and a latency of approximately one millisecond.
Flow B (Cache Miss): arrow from application server to cache labeled step 1 check cache. Arrow from cache back to server labeled step 2b cache miss, key not found. Arrow from server to database labeled step 3 query database. Arrow from database back to server labeled step 4 return value. Arrow from server to cache labeled step 5 store in cache with TTL. Arrow from server back to caller labeled step 6 return value. Mark this path with a slow label and a latency of approximately one hundred milliseconds.
Below both flows draw a cache hit rate meter showing that ninety percent hit rate means ninety percent of reads follow the fast path and only ten percent hit the database.
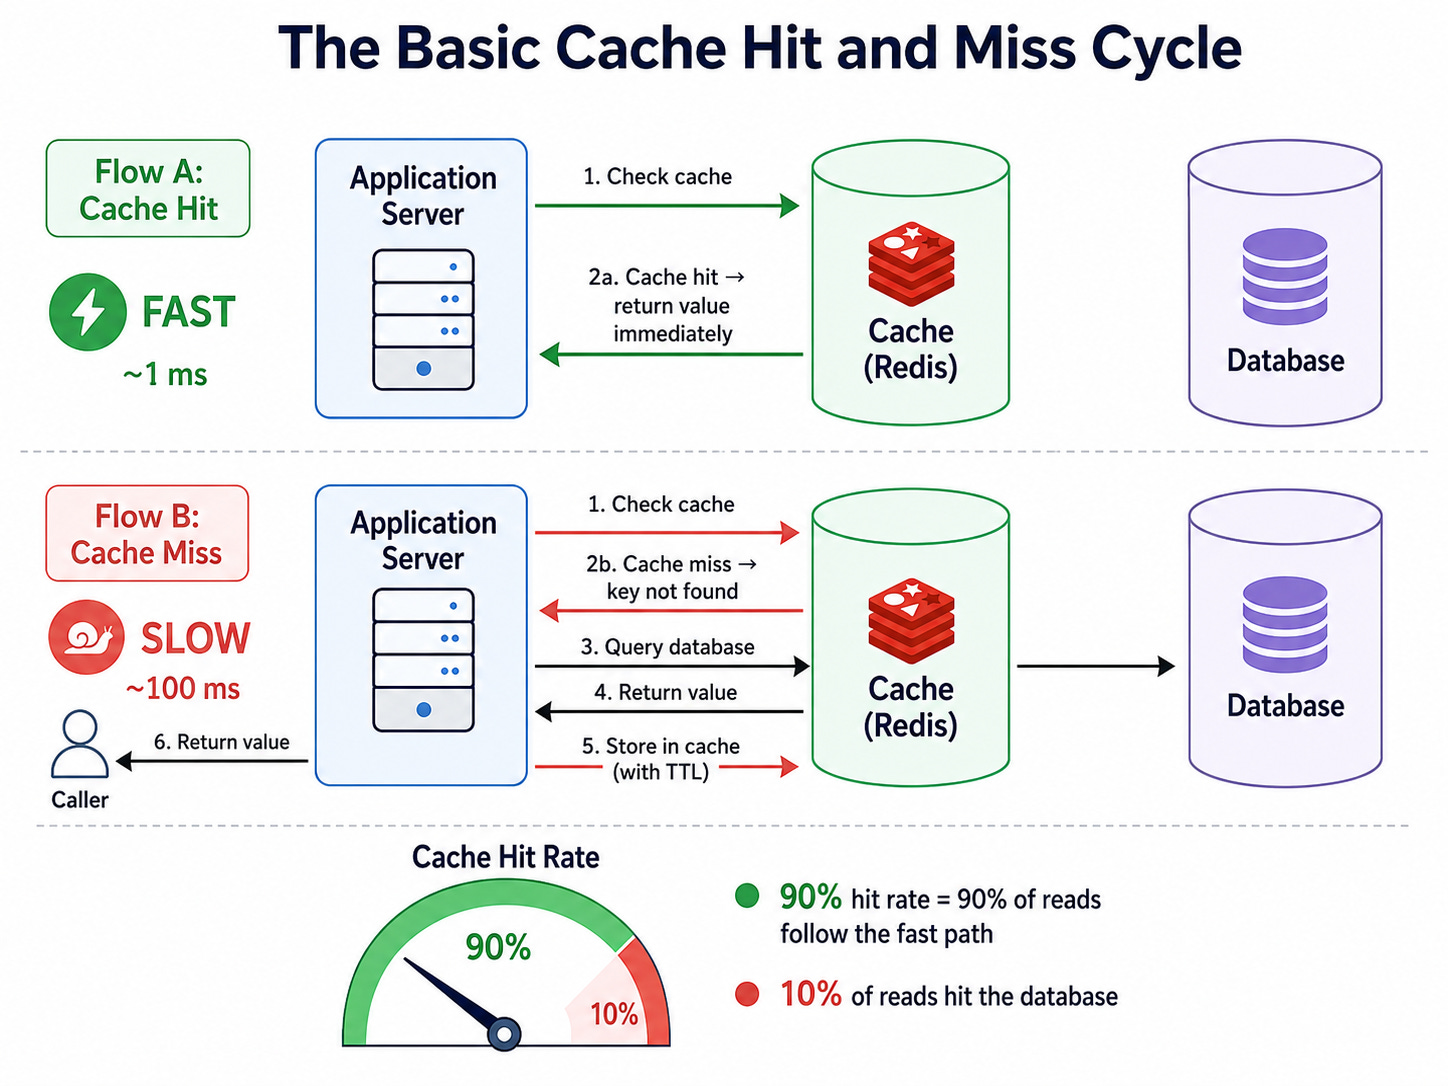
What the interviewer scores: Whether you explain the hit rate concept and understand that a cache only delivers its benefit when the hit rate is high enough to meaningfully reduce database load.
Trade-off: A cache that is too small relative to the working set produces a low hit rate and adds latency (the extra network hop to check the cache) without reducing database load. Sizing the cache to hold the hot working set is what makes it effective.
What it shows: How cache-aside, write-through, and write-behind differ in when and how the cache is updated relative to the database.
What to draw: Draw three side-by-side columns, one for each pattern.
Column 1 (Cache-Aside): application writes to the database first, then either invalidates the cache key or lets the TTL expire naturally. On next read, cache misses and is repopulated. Label: application manages the cache explicitly. Annotate with eventual cache update.
Column 2 (Write-Through): application writes to the cache and the database simultaneously in the same operation. Both must succeed before the write is acknowledged. The cache is always current. Label: synchronous double write. Annotate with consistent but slower writes.
Column 3 (Write-Behind / Write-Back): application writes to the cache only and returns immediately. A background process asynchronously flushes cache writes to the database in batches. Label: async flush to database. Annotate with fast writes, risk of data loss on cache crash.
Below all three draw a consistency-versus-speed spectrum showing write-behind on the fast end, cache-aside in the middle, and write-through on the consistent end.
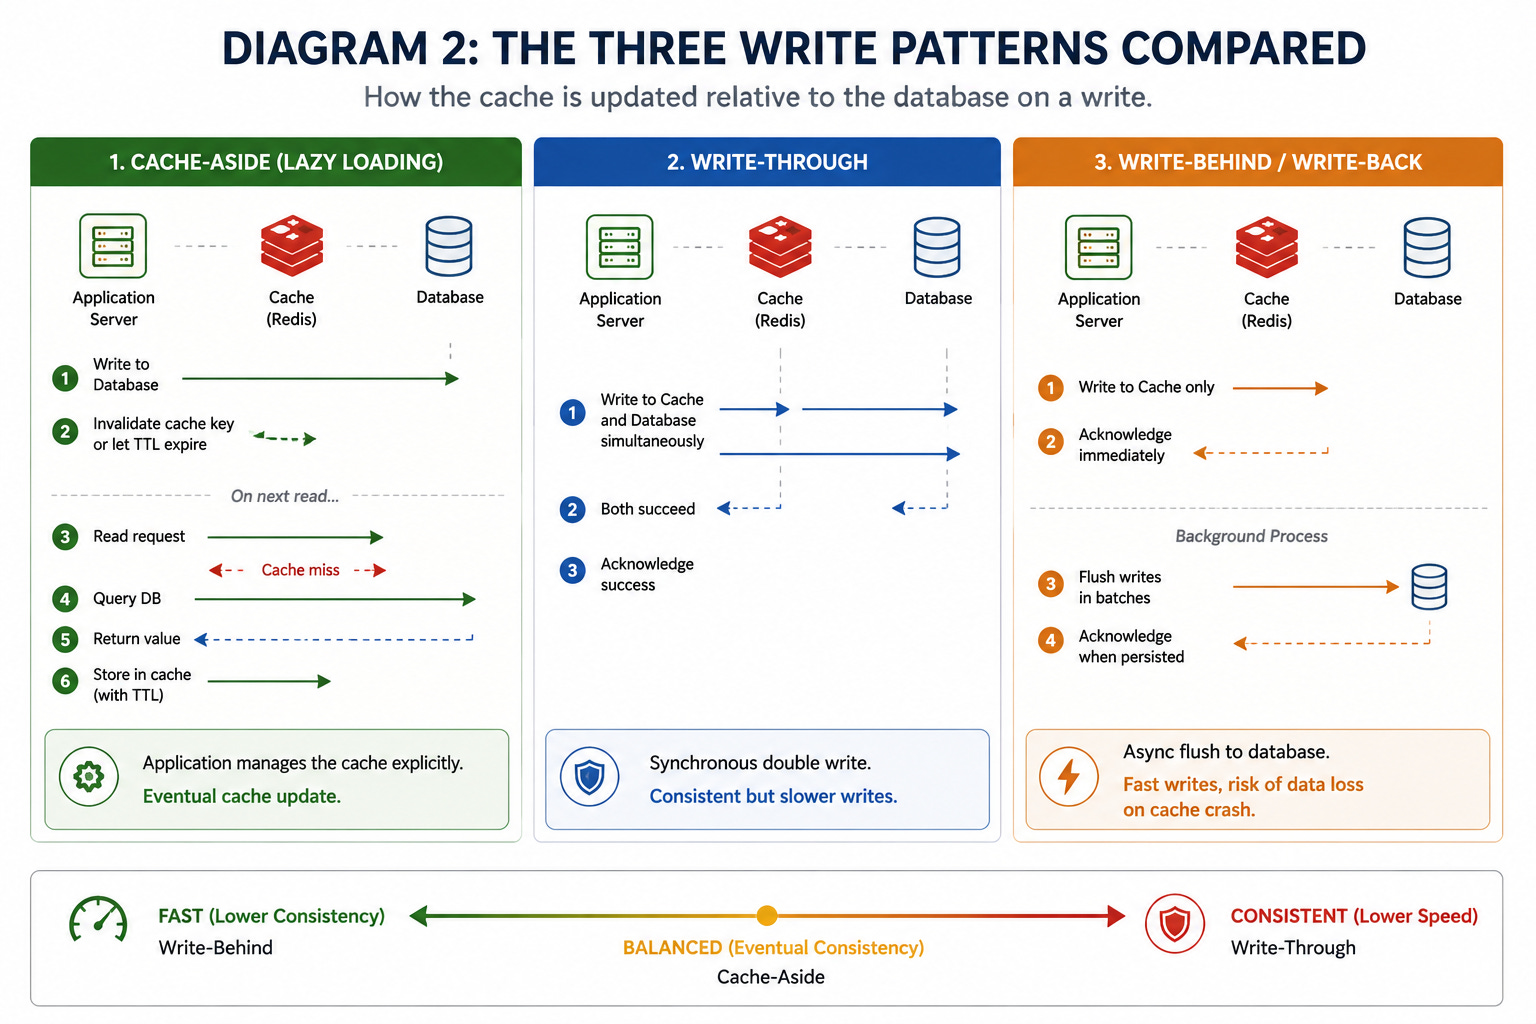
What the interviewer scores: Whether you can name all three patterns, explain the mechanism of each, and choose between them based on the specific requirements of the system being designed.
Trade-off: Write-through is consistent but adds database write latency to every cache write. Write-behind is fast but risks losing writes buffered in the cache if the cache crashes before flushing. Cache-aside is the most common default because it decouples the cache from the write path and degrades gracefully when the cache is unavailable.
What it shows: The three approaches to keeping cached data consistent with the underlying source of truth when data changes.
What to draw: Draw a source of truth database on the left and a cache on the right. Show three invalidation strategies as separate labeled sequences.
Strategy 1 (TTL-Based Expiry): show the cache key with a TTL clock ticking down. When the clock hits zero, the key is automatically evicted. The next read misses and repopulates from the database. Label: simple, eventual consistency, staleness bounded by TTL duration.
Comments
Nothing yet. Say the first thing.
Sign in to join the conversation.