
This is the first in a series of articles on calculating statistics from datasets using Python. This article’s code will create a simple Python list of random data and use built-in functions and the statistics module.
This article has a single Python file, pyliststats.py, which you can clone or downloaded from the GitHub repository. Code from future articles will be uploaded to the same repository.
This is pyliststats.py.
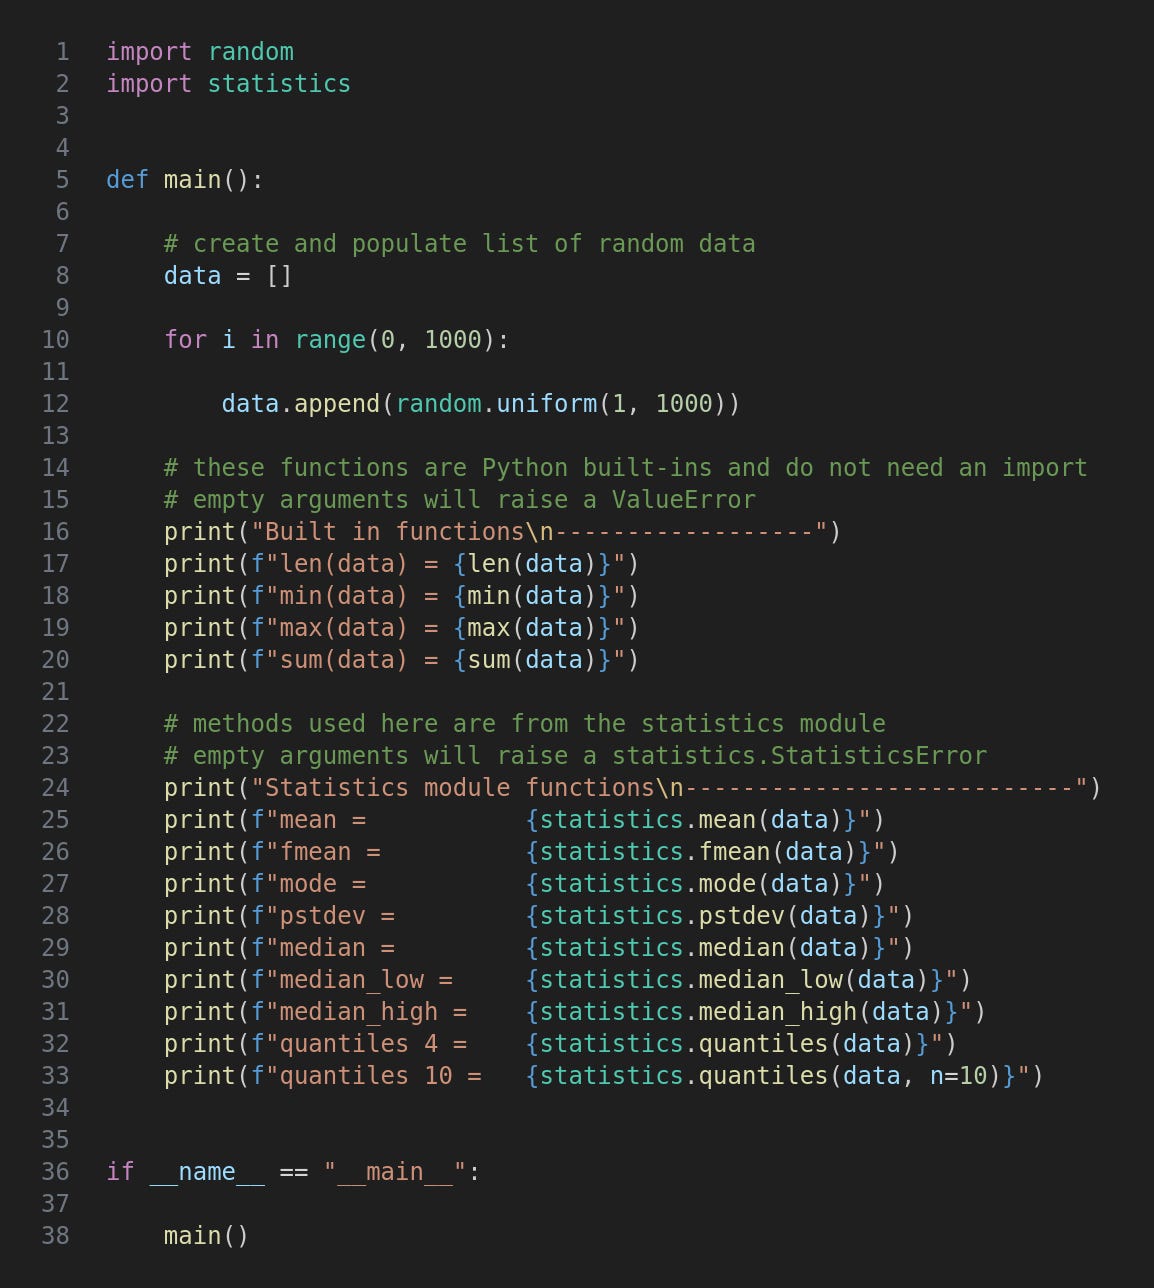
At the top of the file random and statistics are imported. In main we firstly create and populate a list of random numbers.
In lines 17 to 20 four of Python’s built-in functions are called. The function names are self-explanatory and calculate the length, minimum, maximum and sum (total) of the values in the iterable argument. I have omitted exception handling but an empty iterable will raise a ValueError so add exception handling to production code.
The methods in the statistics module are more sophisticated and require some elaboration. These raise a StatisticsError with empty iterables.
The two means used here are the arithmetic means, what most people mean (!) by “average”, ie. add up all the numbers and divide by the count. The fmean method converts all values to floats (although our data is all floats anyway) and is more efficient than mean. There may be minor differences in the return values of the two functions.
The most frequent value, or the first of these if there is a “draw”.
The mean is just a single value which gives no indication of the range of the data; we could calculate the “mean deviation from the mean” or how much, on average, values are above or below the mean but the standard deviation is an ultimately more useful indicator. We know that our data ranges from 1 to 1000 and if you run the code a few times the pstdev is typically in the high 200s which gives a reasonable idea of the spread. Note that I have used pstdev or population standard deviation. This is slightly different from the stdev method which should be used for a sample of data.
The median is the middle value of the sorted data and is somewhat more meaningful that the arithmetic mean as it is less affected by skewed data, ie. when values are more heavily concentrated at the bottom or top ends. The statistics module spoils us with no less that four median methods to choose from although I have only used three so far.
median: the middle value of an odd number of values or the mean of the two middle values if the count is even
median_low: if the count is even the lower value is returned
median_high: if the count is even the higher value is returned
If you sort the data and divide it into chunks with the same number of values in each then the quantiles are the values at the dividing lines of these chunks. The most common are quartiles which divide the data into four groups and deciles which divide it into ten. These give a reasonable indication of the spread of data and the upper and lower quantiles may be more meaningful that the minimum and maximum values if there are outliers, ie. a few values a long way from the typical range. (For this article I have used random.uniform so the data is far better behaved than you would typically find in the wild so there aren’t any values you could consider to be outliers.)
The quantiles method returns a list of the border values, the default number of quantiles being 4 for which we get three values. I have also called the method with n=10 for deciles in which case we get nine values. In each case the middle value is of course the same as the median. In a future article I will show how quantiles can be represented graphically.
Run the program like this:
python3 pyliststats.py
Here we have the output. Don’t bother reading it: this article is more about the process than the end results.
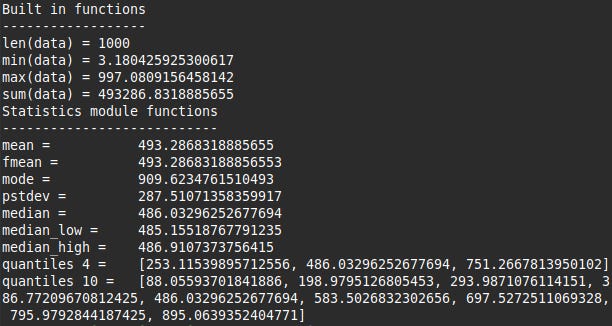
The various functions demonstrated in this article’s code might be all you need especially for small datasets, but they are rather rudimentary and, if you are learning statistics, completely opaque. You throw a list at a function and it gives you back a number or another list with no indication of their meaning or how they are calculated.
For the next article in this series I will write a class that calculates the stats we have looked at so far, primarily to raise the veil of mystery behind them but also because it might be a faster way of doing things. Any possible performance increases will be investigated in Part 3.
For updates and random ramblings please follow me on Bluesky.
No AI was used in creating the code, text or images in this article.
Comments
Nothing yet. Say the first thing.
Sign in to join the conversation.