
Every May, four teams arrive at the EuroLeague Final Four with the same goal and very different identities. By Sunday night, only one is left holding the cup. We wanted to understand what actually separates the champion from the other three — not just on the scoresheet, but in the way they play.
To do that, we looked at every Final Four game from the last five seasons (2020-21 through 2024-25). Five champions. Fifteen Semifinal and Final games. We compared those games to the same teams' Regular Seasons and Playoff series, and we compared the eventual champions to the F4 teams they beat along the way. The goal was to find the patterns, pace, shot selection, play-type tendencies, defensive habits, star reliance that show up over and over in the teams that win it all.

A word on sample size. Five years and five champions is not a huge dataset. Some of the numbers we're going to share come from samples of 10 to 15 games, and a few cuts rest on even smaller samples. We've tried to be honest about this throughout: when a finding rests on a thin slice of data, we'll flag it, and we lean on patterns that show up consistently across multiple champions rather than on any single dominant team-season. Read the numbers as directional rather than predictive. The point isn't to declare a formula for winning, it's to surface the tendencies that the last five champions had in common, so we have a sharper lens for watching this year's contenders.
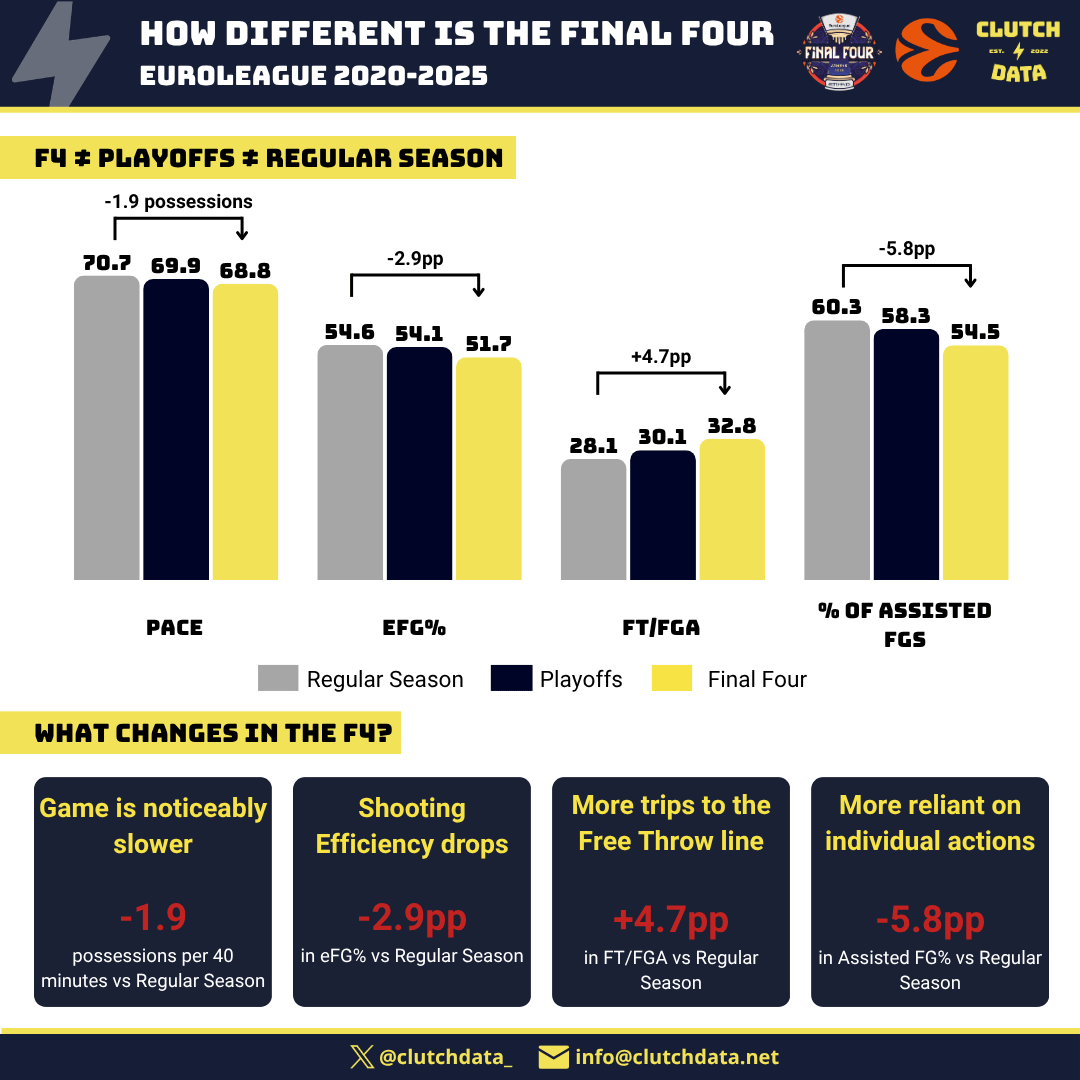
Final Four basketball is not Playoff basketball with the volume turned up. It’s a different game entirely.
When you compare Regular Season, Playoff, and Final Four numbers side by side, the shift is consistent in every direction. Pace slows by roughly two possessions per 40 minutes. Shooting efficiency drops by almost three percentage points in eFG%. The free-throw line becomes the bailout: foul rates spike by nearly five percentage points compared to the Regular Season. And maybe most tellingly, the share of made baskets that come off an assist falls by nearly six points, offenses lean more on individual creation when the stakes are highest and defenses are best prepared.
The takeaway: F4 weekend rewards a different kind of team. The teams built to thrive in a high-pace, high-flow Regular Season environment can find themselves out of rhythm when the game tightens, slows down, and turns into a series of half-court chess matches.
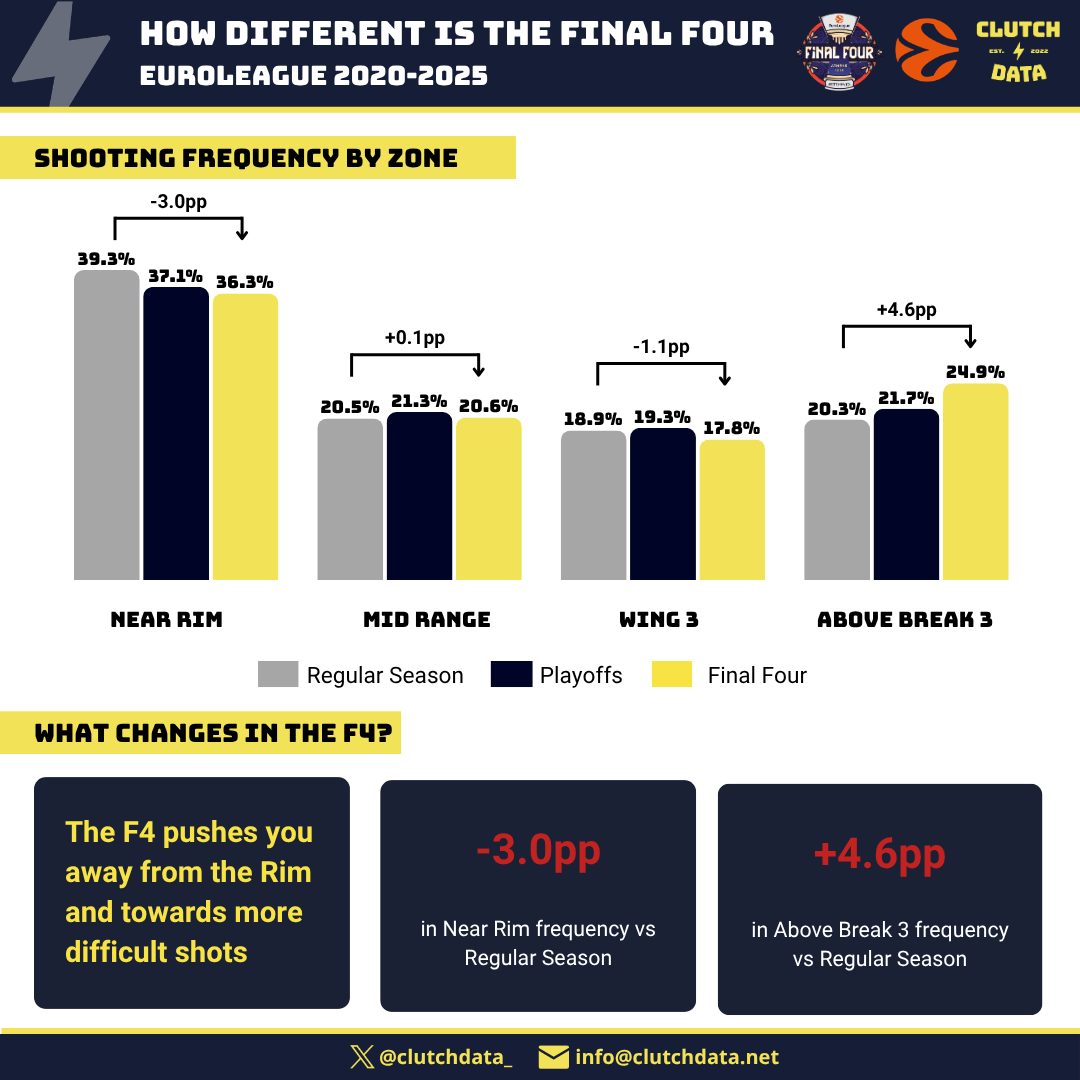
The most striking shift is at the rim: Near Rim attempts drop by 3 percentage points from the Regular Season to the F4. Defenses pack the paint, help is earlier, and the simple drive-and-finish action becomes much harder to find. Wing 3s also tick down slightly.
Where do those shots go? Above-the-break threes, the longer, more contested looks at the top of the arc. F4 teams take 4.6 percentage points more of these than they do during the Regular Season. That’s the single biggest shift in the entire shot diet.
Read together, this is the F4 defensive squeeze in one chart: take away the rim, take away the corner, and live with the contested three. It’s a strategy that works because those shots are inherently harder to make, which is exactly what the next slide shows.
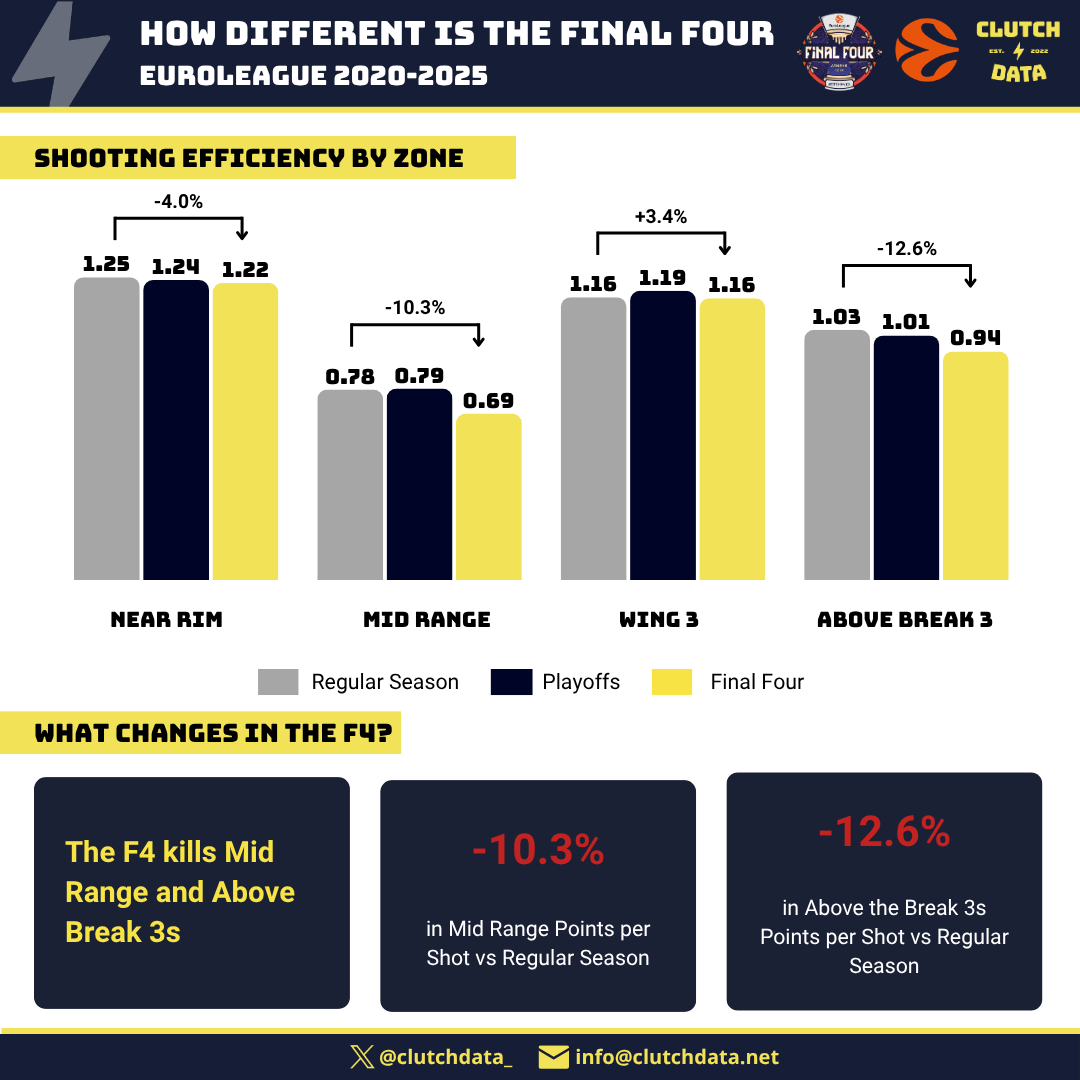
Mid-range efficiency falls off a cliff in the F4. Points per shot from that area drop by more than 10% compared to the Regular Season, these are the contested pull-ups that look manageable in November and look like prayers in May.
Above-the-break threes get hit even harder, with a 12.6% drop in points per shot. Teams take more of them (per the last slide) AND make fewer of them. That’s the textbook signature of an offense settling for what the defense allows rather than dictating its own terms.
Interestingly, rim efficiency barely moves, when teams do get to the rim, they finish at nearly the same rate. The F4 doesn’t make it harder to score AT the rim; it makes it harder to GET to the rim. And the perimeter is where shooting actually breaks down.
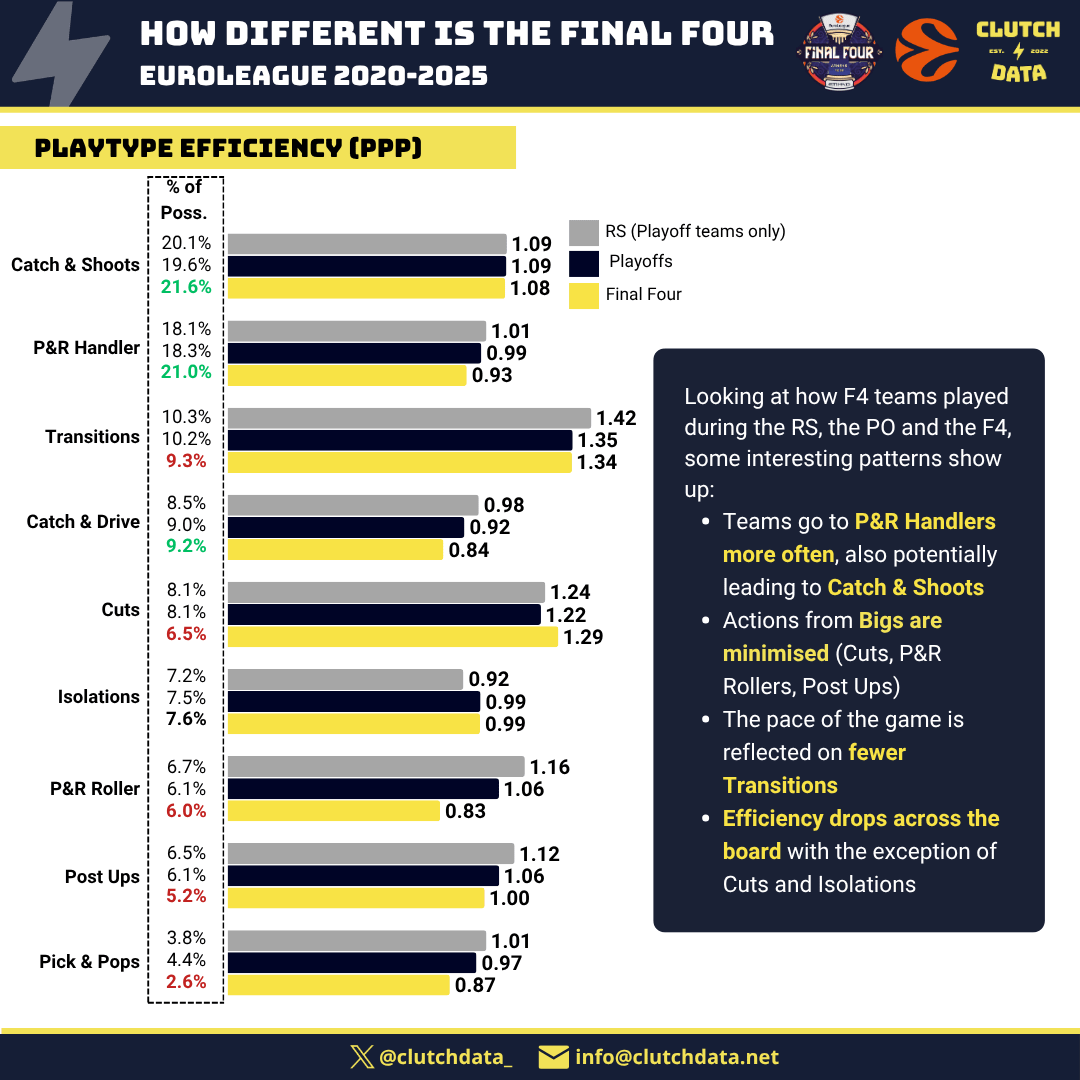
Restrict the lens to playoff-quality offense and the F4 shift gets even sharper.
To compare apples to apples, the Regular Season numbers on this slide come only from teams that eventually made the Playoffs that season. The point is to isolate what changes about how good teams play in May, not just what separates good teams from bad ones.
Three patterns jump out. First, Pick-and-Roll Ball Handler usage climbs dramatically, from 18% of plays in the Regular Season to 21% in the F4. When the playbook tightens, coaches go to what they trust most, and the modern Euroleague trusts its lead guard. Catch-and-Shoot usage rises in parallel, which makes sense: more PnR pressure forces more rotations, which creates more spot-up looks.
Second, everything involving the big disappears. Cuts, P&R Rollers, and Post-ups all see their share of offense shrink. The role of the screen-and-roll big as a primary scoring threat compresses; defenses load up on the dive and force the ball back out.
Third, efficiency drops almost everywhere. The only exceptions are Cuts (which become rarer but slightly more efficient when they happen) and Isolations (essentially flat). When the playbook fails, simpler reads, one guy, one defender, no help-side traps, actually hold up. That’s the seed of the champion archetype on the next slide
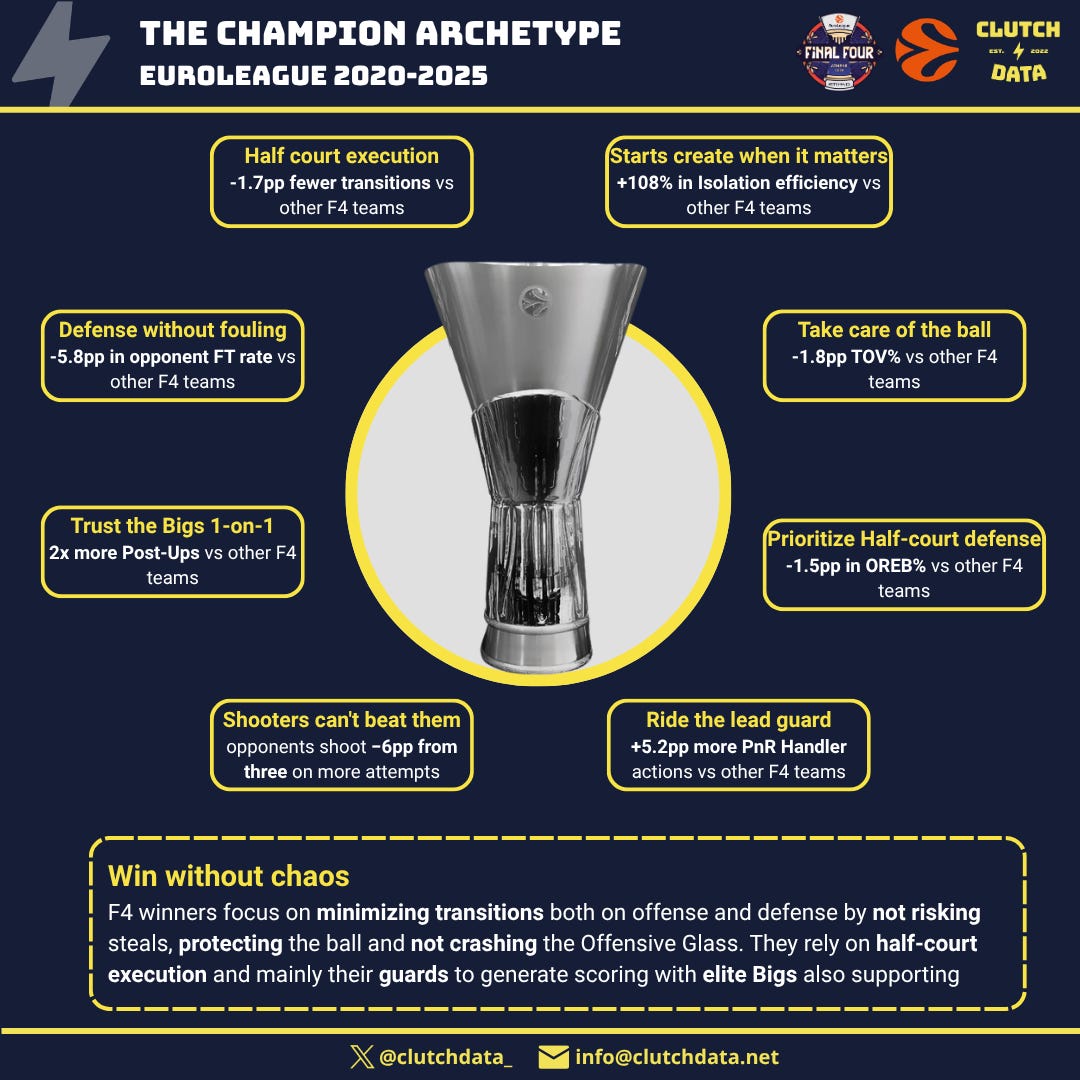
Comparing the five champions to the teams they beat in F4 games, eight clear tendencies emerge. The trophy doesn’t go to the team that creates the most chaos, it goes to the team that minimizes chaos on both ends.
On offense, champions run a smaller, more controlled menu: fewer transition opportunities (−1.7 pp), more reliance on their lead guard in pick-and-roll (+5.2 pp), and noticeably more post-ups (2x the rate of non-champion F4 teams). When it’s time to get a bucket against a set defense, they trust their stars to score one-on-one, champion isolation efficiency is more than double that of the teams they beat (1.12 PPP vs 0.54 PPP, a +108% gap).
On defense, the signature is discipline rather than havoc. Champions don’t gamble for steals, they don’t foul (−5.8 pp in opponent FT rate, the largest defensive edge), and they don’t sell out to crash the offensive glass (−1.5 pp in OREB%). They funnel opponents into more three-point attempts (+7 pp opp 3PA volume) but contest cleanly enough to hold them to 6 percentage points lower from deep.
They also take care of the ball (−1.8 pp in TOV%) and limit their own transition opportunities — both to prevent the opponent from running back and to keep the game on their terms.
The picture that emerges is consistent: F4 winners win by playing a controlled, executable half-court game on both ends. They don’t chase the upside; they reduce the variance
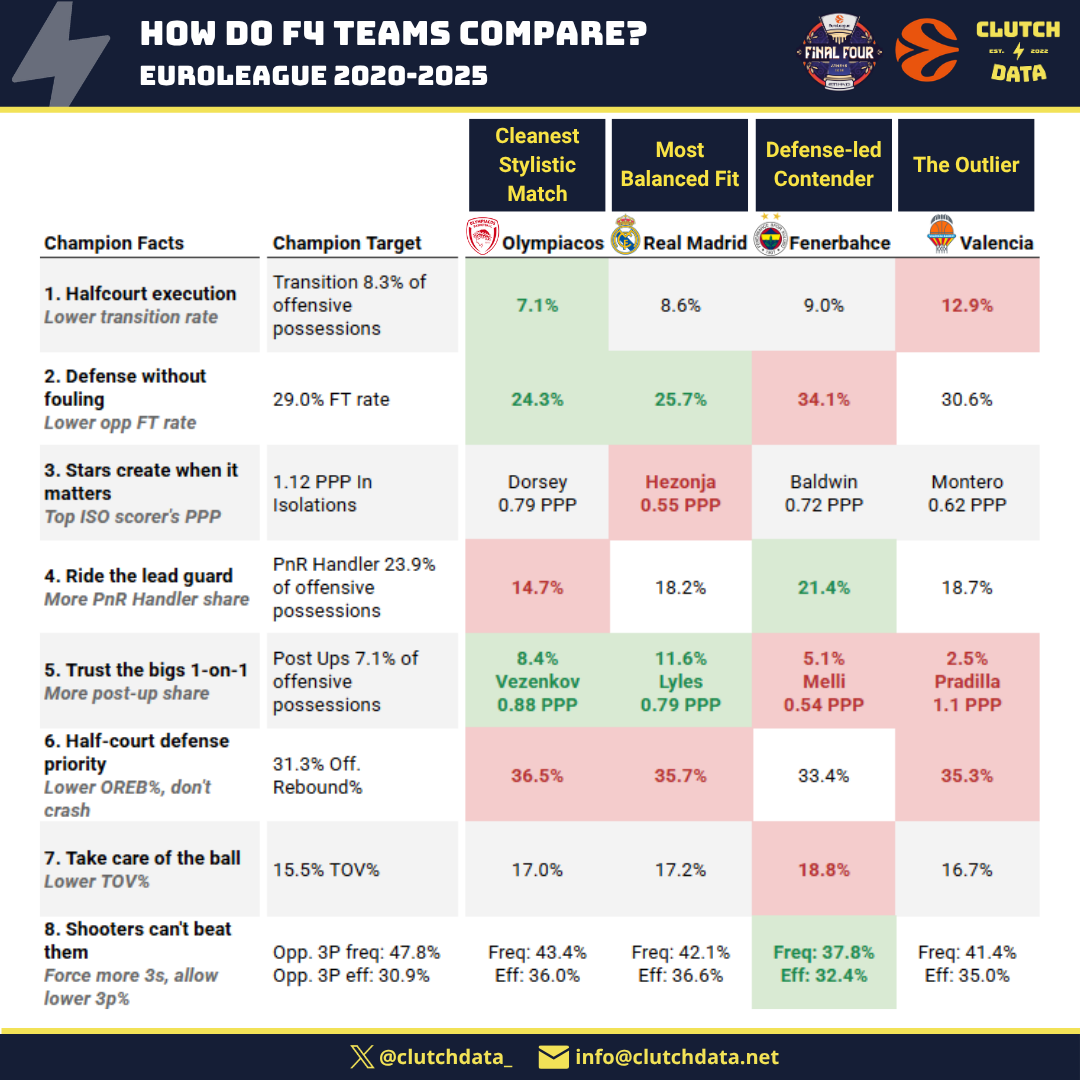
Four teams remain. Each fits the archetype in some ways and breaks it in others.
Comparing this year’s Regular Season numbers from Olympiacos, Real Madrid, Fenerbahce, and Valencia to the champion archetype gives a useful health check, though with the caveat that Regular Season numbers don’t perfectly project to F4 weekend performance.
Olympiacos is the cleanest stylistic match. They have the lowest transition rate of any contender (7.1%, right at the champion bar), don’t foul (24.3% opp FT rate, well below the target), and have an elite post-up scorer in Vezenkov who matches the “Trust the Bigs” pillar. Their biggest deviation: they run the fewest PnR Handler plays of any contender (14.7%), they’re not built around riding a single lead guard the way recent champions have been.
Real Madrid is the most balanced overall fit. They lead all contenders in post-up volume (11.6%, well above the bar), with Lyles as a secondary option, and they meet the “Defense without fouling” target comfortably (25.7%). Their misses: high OREB%, and the lowest top-isolation efficiency of any contender (Hezonja at 0.55 PPP on limited attempts). Keep in mind that both Tavares and Len will miss the Final Four.
Fenerbahce matches the archetype in two specific places, they ride their lead guard heavily (Baldwin at 21.4% PnR Handler share) and they hold opponents to the lowest three-point percentage in the league (32.4%, the only contender meeting the “Shooters can’t beat them” benchmark on both volume and efficiency). The flags: highest opponent FT rate of any contender (34.1%) and highest TOV% (18.8%).
Valencia is the outlier. They play the fastest of the four (12.9% transition rate, well above the champion bar) and barely run post-ups (2.5%, lowest of the group). They look like a different archetype entirely, high-tempo, perimeter-driven, that hasn’t won an F4 in our 5-year window.
The clearest finding: no contender is a perfect archetype match. Each has at least one significant deviation from the historical winner’s profile. Whoever lifts the trophy this year will likely do it by either bending the archetype around their strengths or by having one extraordinary weekend that breaks the pattern. Both have happened before.
Five Final Fours is a small sample, but the consistency across champions is striking. They slow the game down, take care of the ball, trust their guards to create and their bigs to finish one-on-one. On defense, they prioritize discipline over disruption, they don’t gamble, they don’t foul, and they don’t sell out on the glass. They win by reducing the number of ways the game can go sideways.
This isn’t a recipe. There’s no formula that guarantees a EuroLeague title, and the champions in our sample have ranged from #2 to #6 in their Regular Season seedings, proving that getting to the F4 and winning it are very different skills. But there is a pattern, and the teams that fit it most closely have a head start when the spotlight gets bright.
Which of this year’s four contenders bends the archetype best? We’ll know by Sunday night.
No posts
Comments
Nothing yet. Say the first thing.
Sign in to join the conversation.