
A version 2 of the Climate Engine drought reports co-developed with the Bureau of Land Management (BLM) were released. Both version 1 and version 2 are available through the reports.climateengine.org site. The reporting site layout was updated to include a Get Started section and linking across report types for pre-computed BLM AOIs.
Multiple new datasets were added including the PRISM 800m daily, GRACE percentiles, and ForDRI.
The CONUS Canopy Height Model data were added as a raster basemap option and WRI’s Aqueduct data were added as a vector choropleth overlay option.
The Climate Engine-Earth Engine Connector was launched, allowing Climate Engine API users to authorize Climate Engine to use their own Google Cloud Project for Earth Engine processing and Google Cloud Storage exports. A priority parameter was added to the Climate Engine API raster export endpoints, allowing commercial earth engine accounts to specify priority on exports. Drought Report endpoints were updated to return V2 reports.
The team presented Climate Engine tools at the NADP Spring Meeting and Scientific Symposium and Great Lakes Geosymposium.
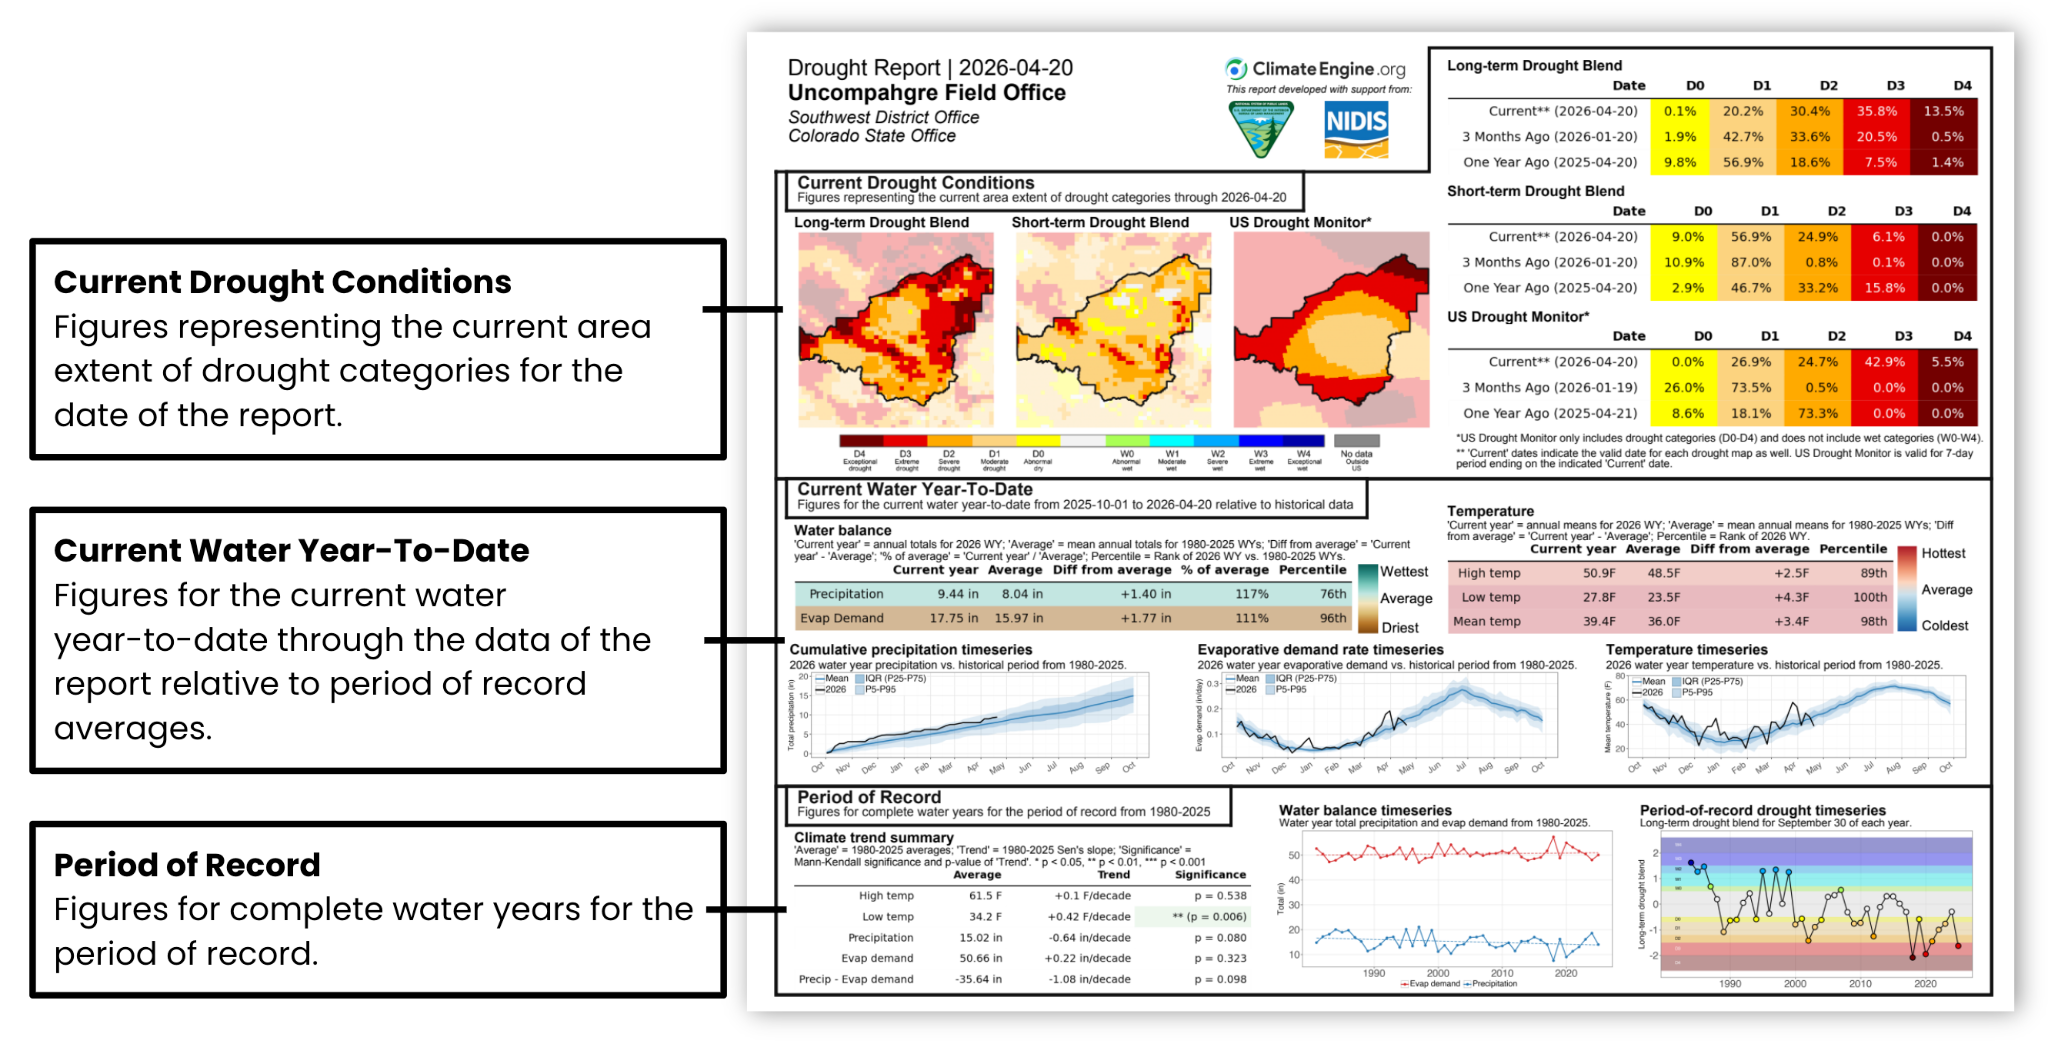
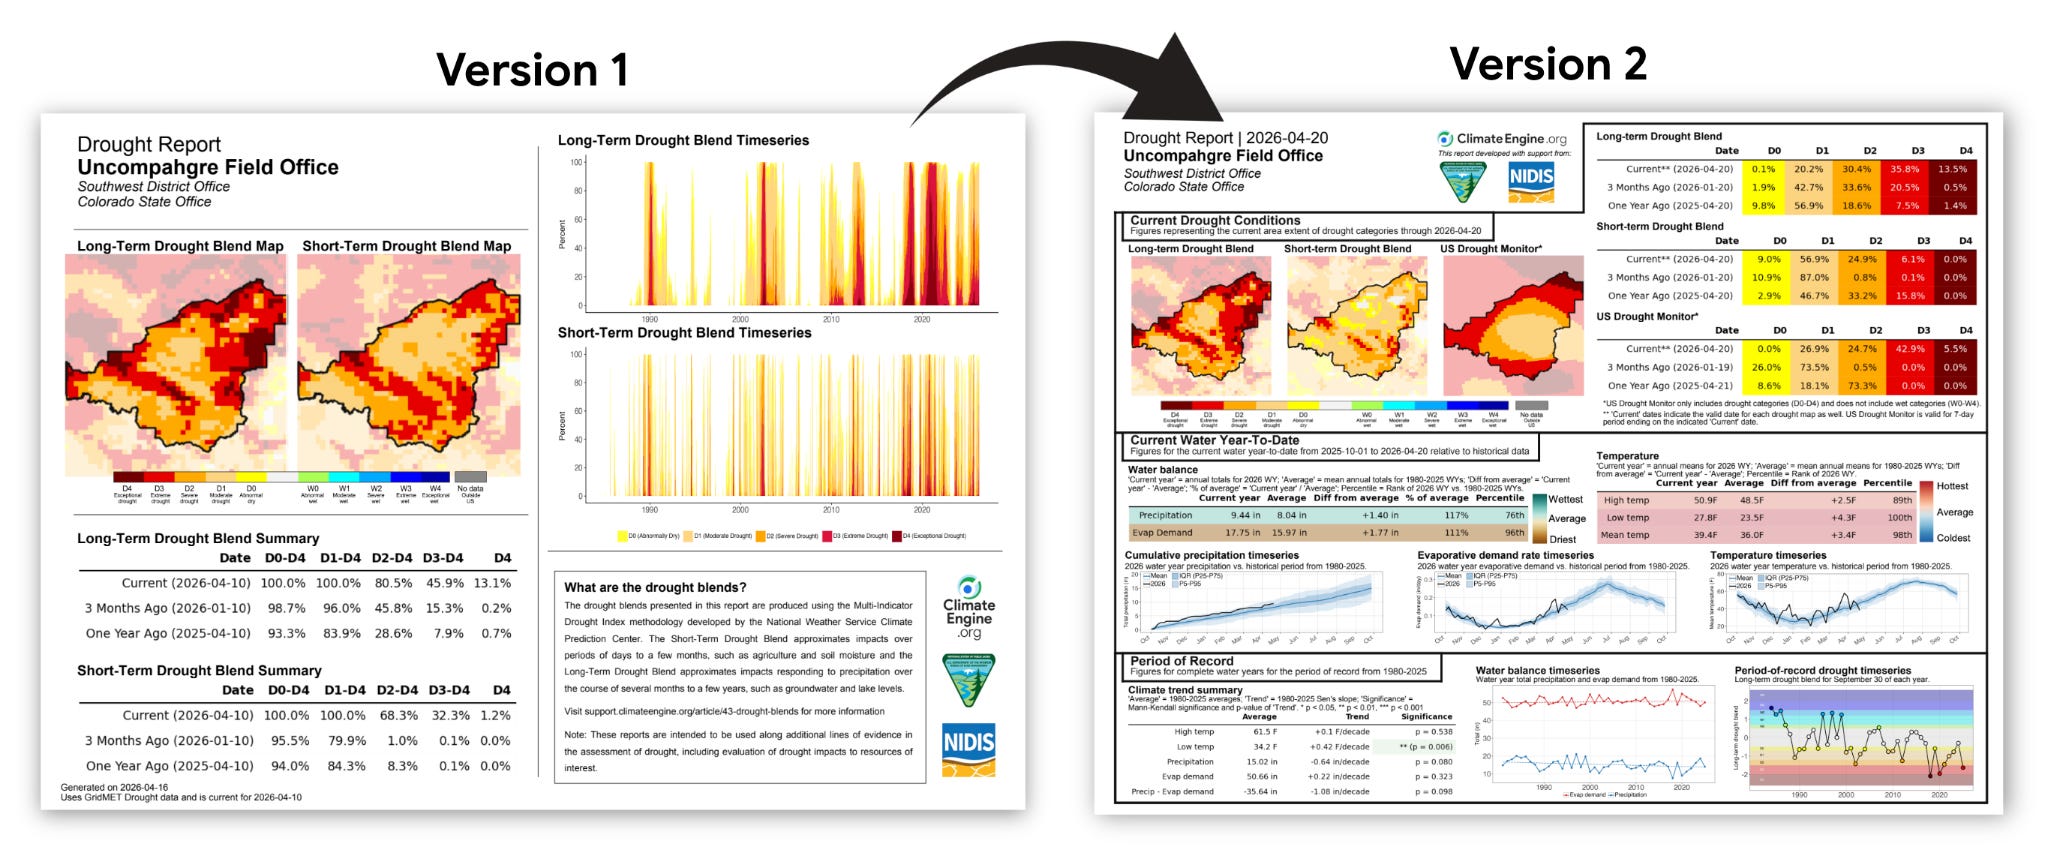
Climate Engine released Version 2 of its Drought Reports, developed in partnership with the Bureau of Land Management and NOAA’s National Integrated Drought Information System, offering a significantly expanded view of drought conditions for any user-defined area of interest. Building on Version 1’s short-term and long-term drought blend maps, the updated reports add the U.S. Drought Monitor for an impact-based perspective, current water-year-to-date summaries of precipitation, evaporative demand, and temperature (each with historical context), and long-term trend analysis using Sen’s slope and Mann-Kendall significance testing. These updates give decision-makers a more complete picture of both current drought status and the climatic conditions driving it. The drought category summary tables have also been revised to report class-specific percentages (D0 through D4) rather than cumulative totals, making it easier to understand how drought severity is distributed across an area.
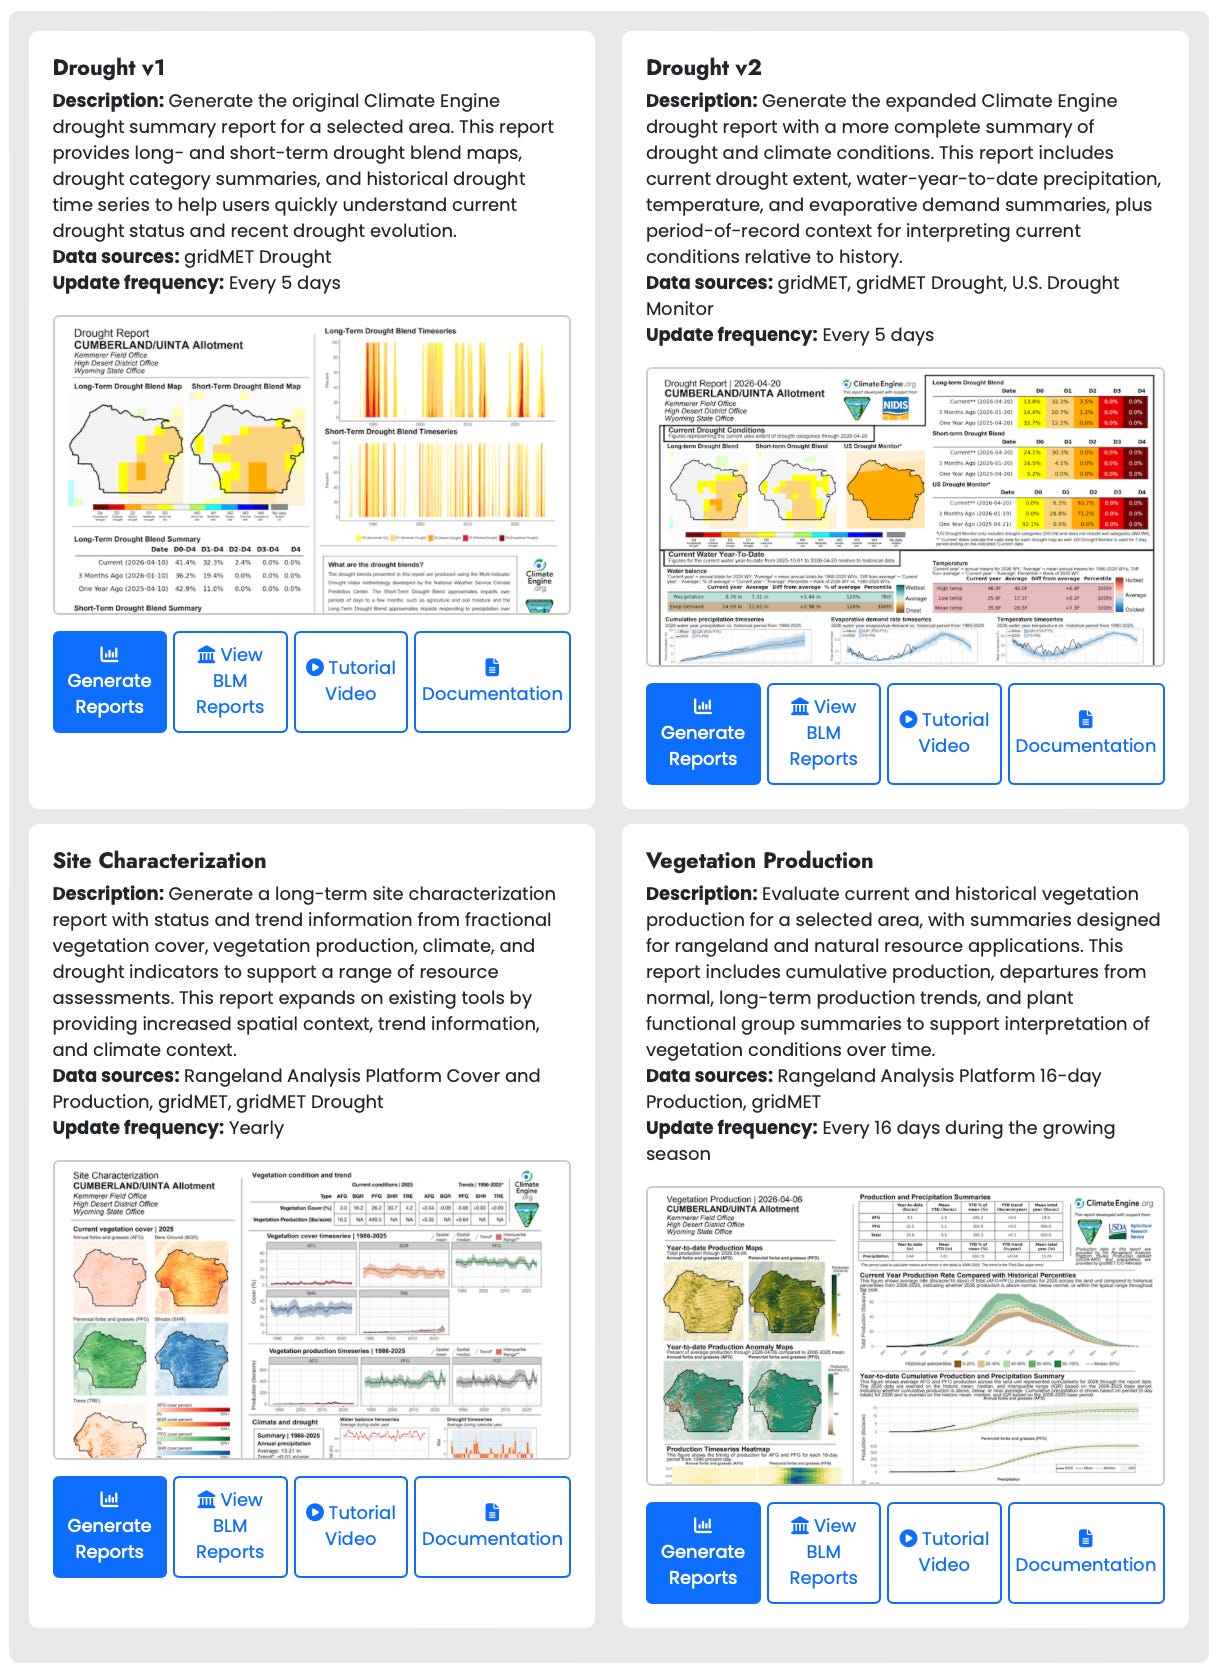
A new Get Started section was implemented on the Climate Engine Reports page. It allows users to 1) quickly see across the current report templates, 2) view key information such as description, data sources, and update frequency, and 3) be directed to generating custom reports, viewing BLM reports, a tutorial video, or documentation. Additionally, when viewing BLM Reports for an AOI, related reports are linked in a small box for quick navigation between reports.
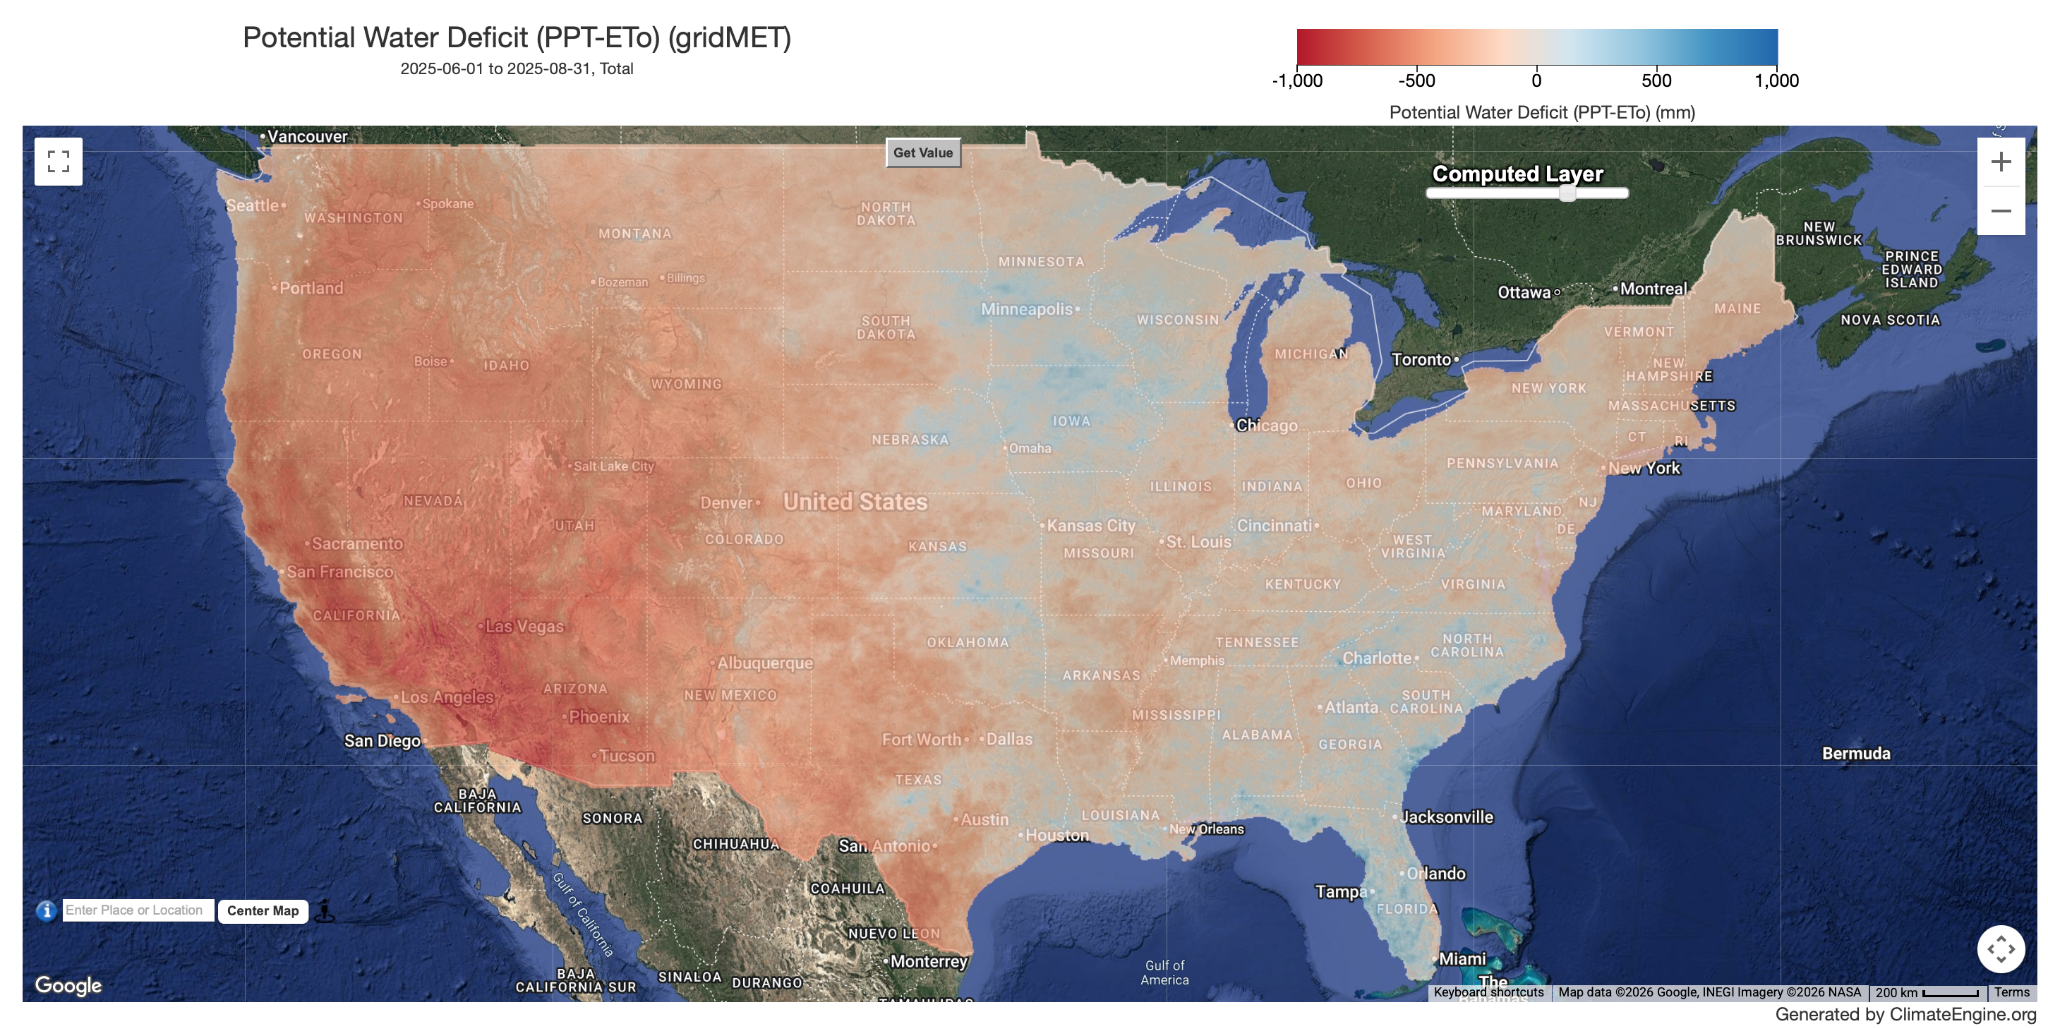
The PRISM 800m Daily data has been added to both the Climate Engine web app and API. Developed and maintained by the PRISM Climate Group at Oregon State University, PRISM uses a hybrid statistical-geographic model that combines weather station observations with a digital elevation model to generate gridded climate estimates that explicitly account for topographic influences including elevation, slope aspect, rain shadows, temperature inversions, and coastal effects. The 800m resolution represents the native modeling resolution and is the highest-detail version available. Twelve variables are available for analysis: core meteorological measurements (maximum, minimum, and mean temperature; mean dewpoint temperature; maximum and minimum vapor pressure deficit; and precipitation), two derived water balance variables (Hargreaves potential ET and potential water deficit), and three drought indices ( SPI, Hargreaves EDDI, Hargreaves SPEI). This daily dataset complements the 4km PRISM dataset already available in Climate Engine, giving users access to finer spatial detail for applications in hydrology, ecology, agriculture, and resource management where local topographic variation matters.
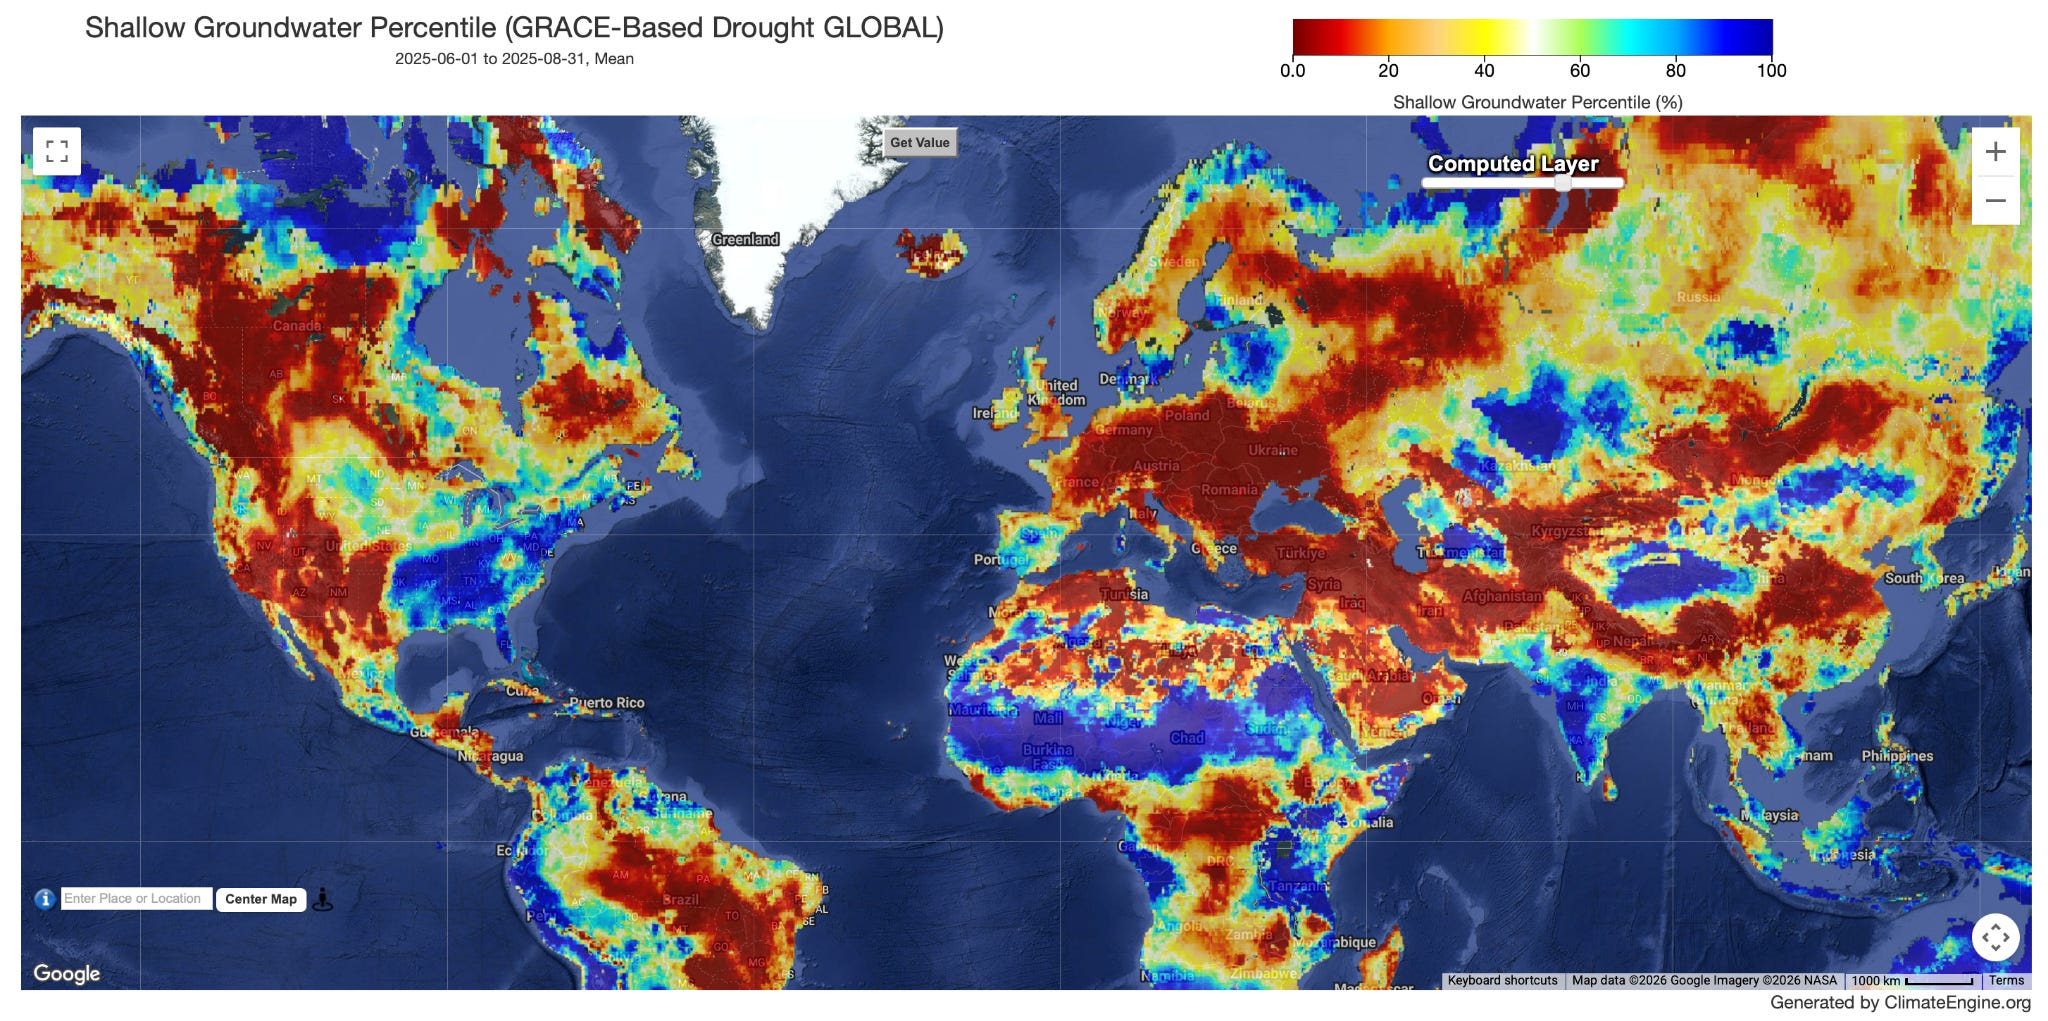
Climate Engine has added the GRACE Drought Indicator (CONUS & Global) datasets to the web app and API, providing weekly groundwater and soil moisture drought indicators derived from NASA's GRACE-FO satellite. Produced by scientists at NASA's Goddard Space Flight Center, the datasets combine terrestrial water storage observations from GRACE satellites with a numerical land surface model to generate three drought indicators: surface soil moisture, root zone soil moisture, and shallow groundwater. Each indicator is expressed as a percentile relative to historical conditions for that location and time of year. The CONUS version offers 14km resolution coverage from 2002 to present, while the global version provides 28km resolution coverage from 2003 to present. Both datasets are particularly useful for tracking subsurface drought conditions that may not be captured by precipitation-based indicators alone, with lower percentile values indicating drier-than-normal conditions and higher values indicating wetter-than-normal conditions.
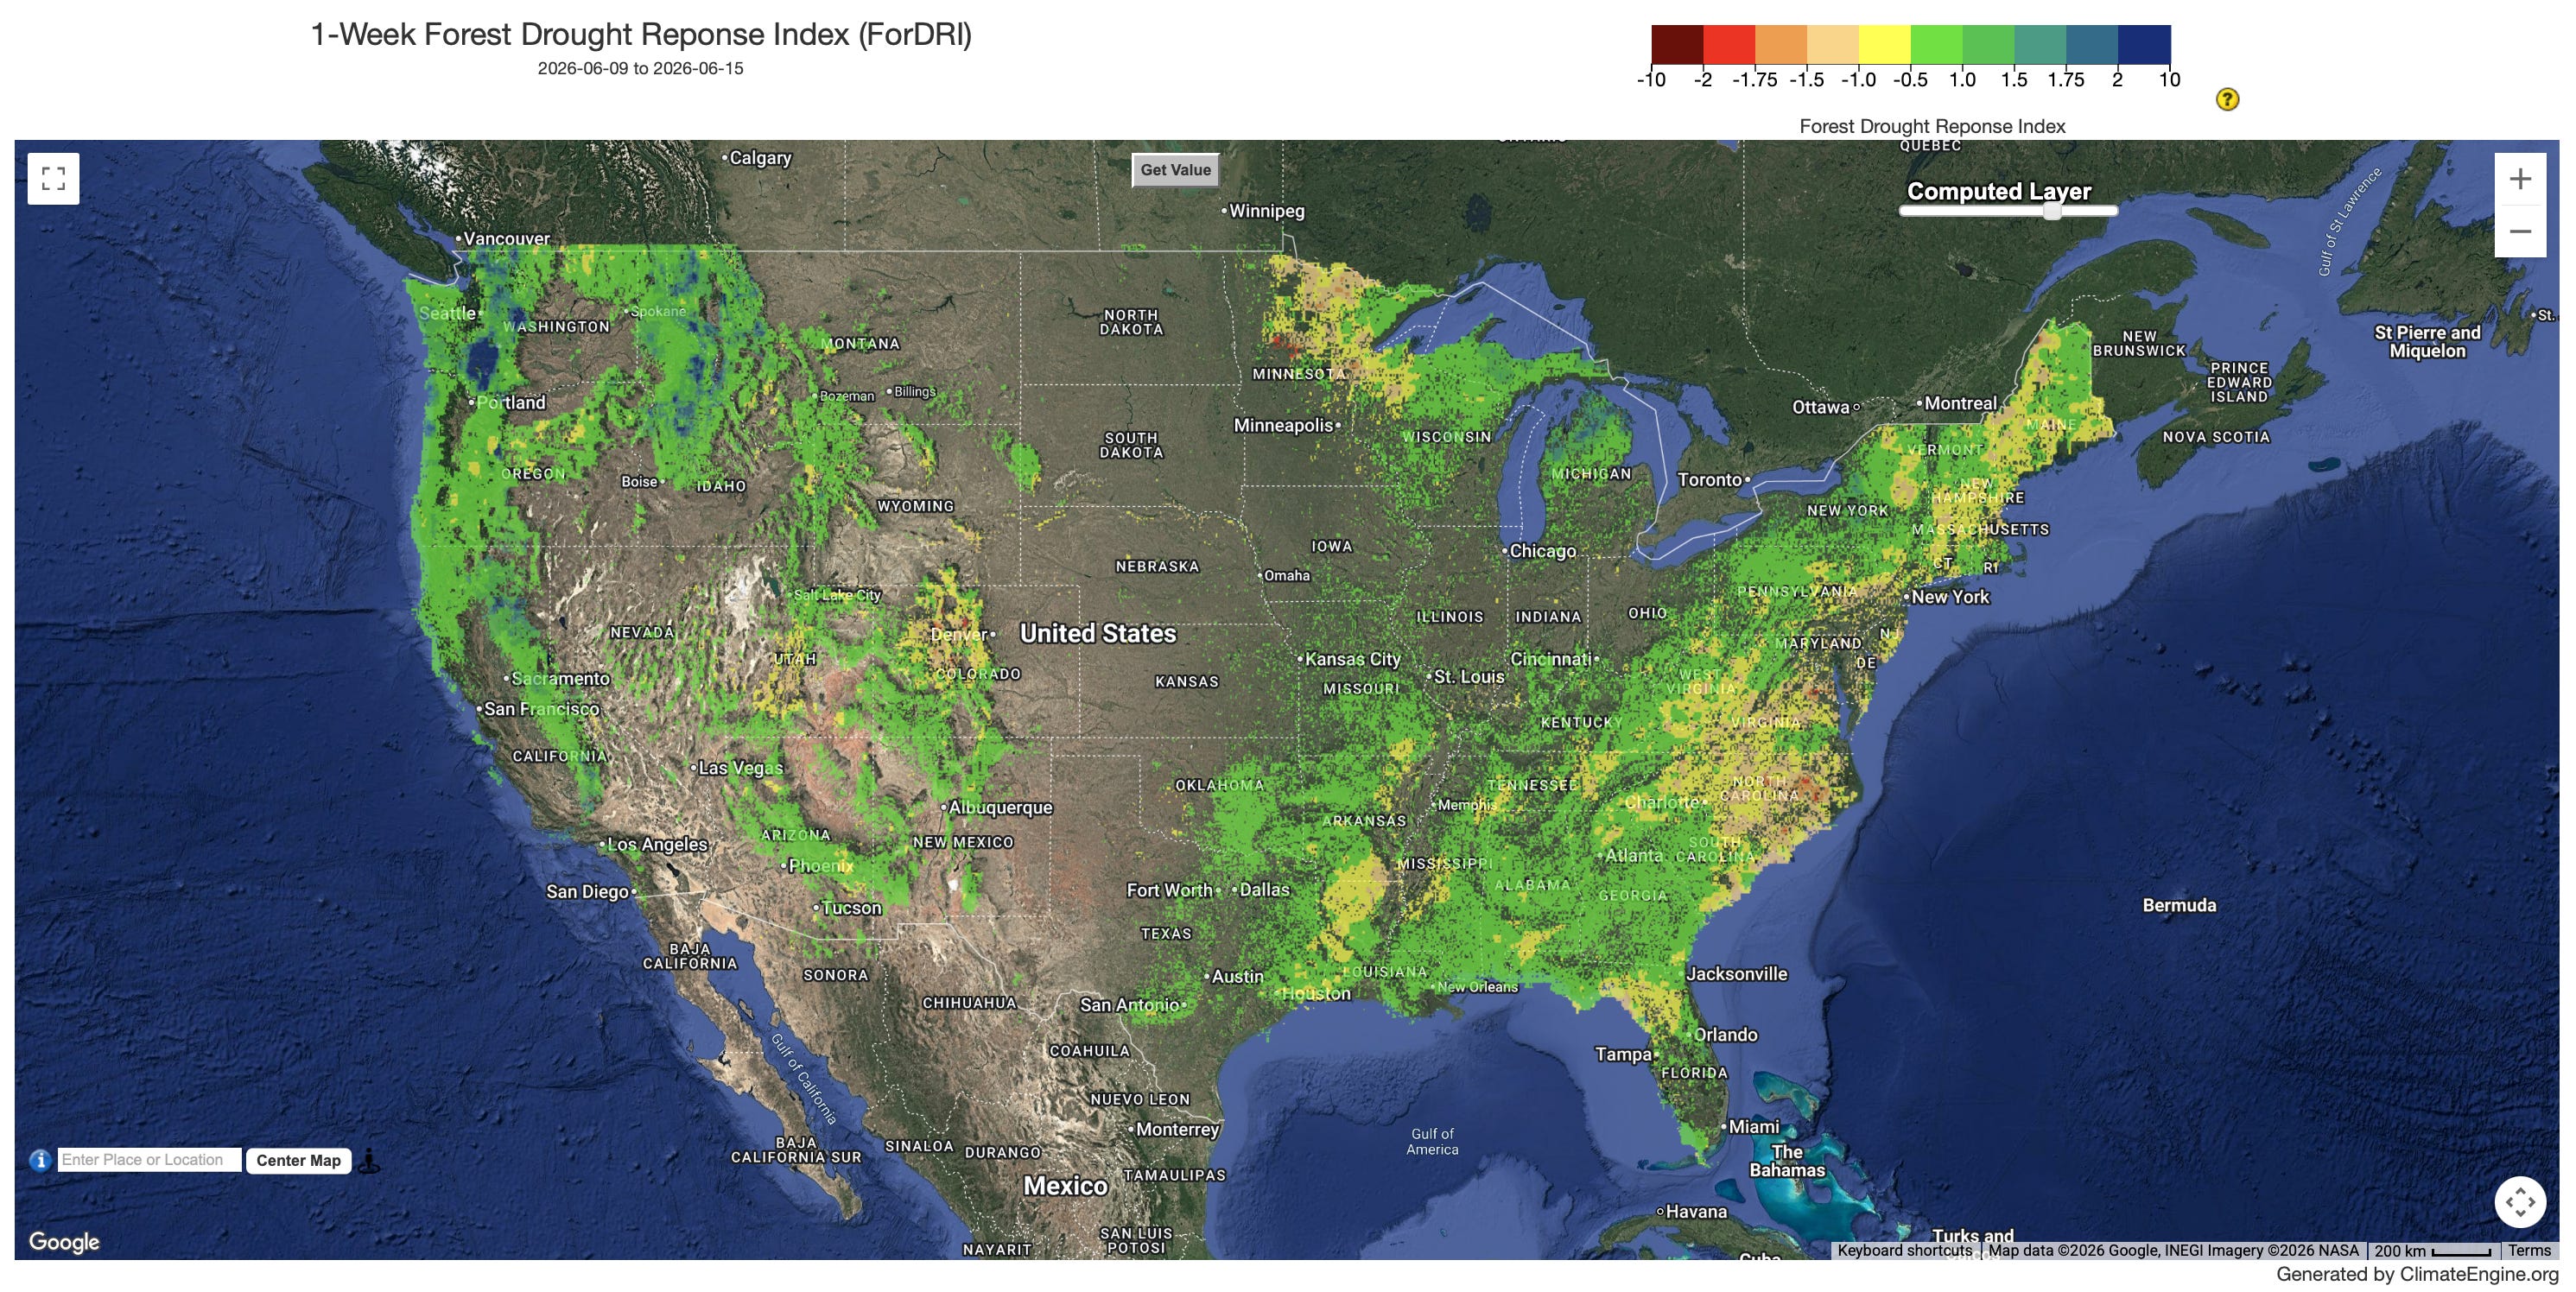
Climate Engine has added the Forest Drought Response Index (ForDRI), a weekly 1km drought monitoring product for forest ecosystems across the contiguous United States, to the web app and API. Developed by the National Drought Mitigation Center at the University of Nebraska-Lincoln in collaboration with the USDA and U.S. Forest Service, ForDRI addresses a gap in drought monitoring by focusing specifically on forest drought stress. The index integrates 12 environmental variables spanning vegetation health (MODIS/VIIRS NDVI), groundwater storage (GRACE), soil moisture (NLDAS-2), atmospheric evaporative demand (EDDI, VPD), and multi-timescale climate indices (SPI and SPEI at 9-, 12-, 24-, and 60-month periods), combining them into a single hybrid index using principal component analysis weighted independently for each 1km grid cell and each week of the year to account for seasonal variation in tree growth. ForDRI is particularly effective in arid and semi-arid forest regions, and has been validated against Bowen ratio data from AmeriFlux sites and tree-ring records, with coverage extending back to 2003.
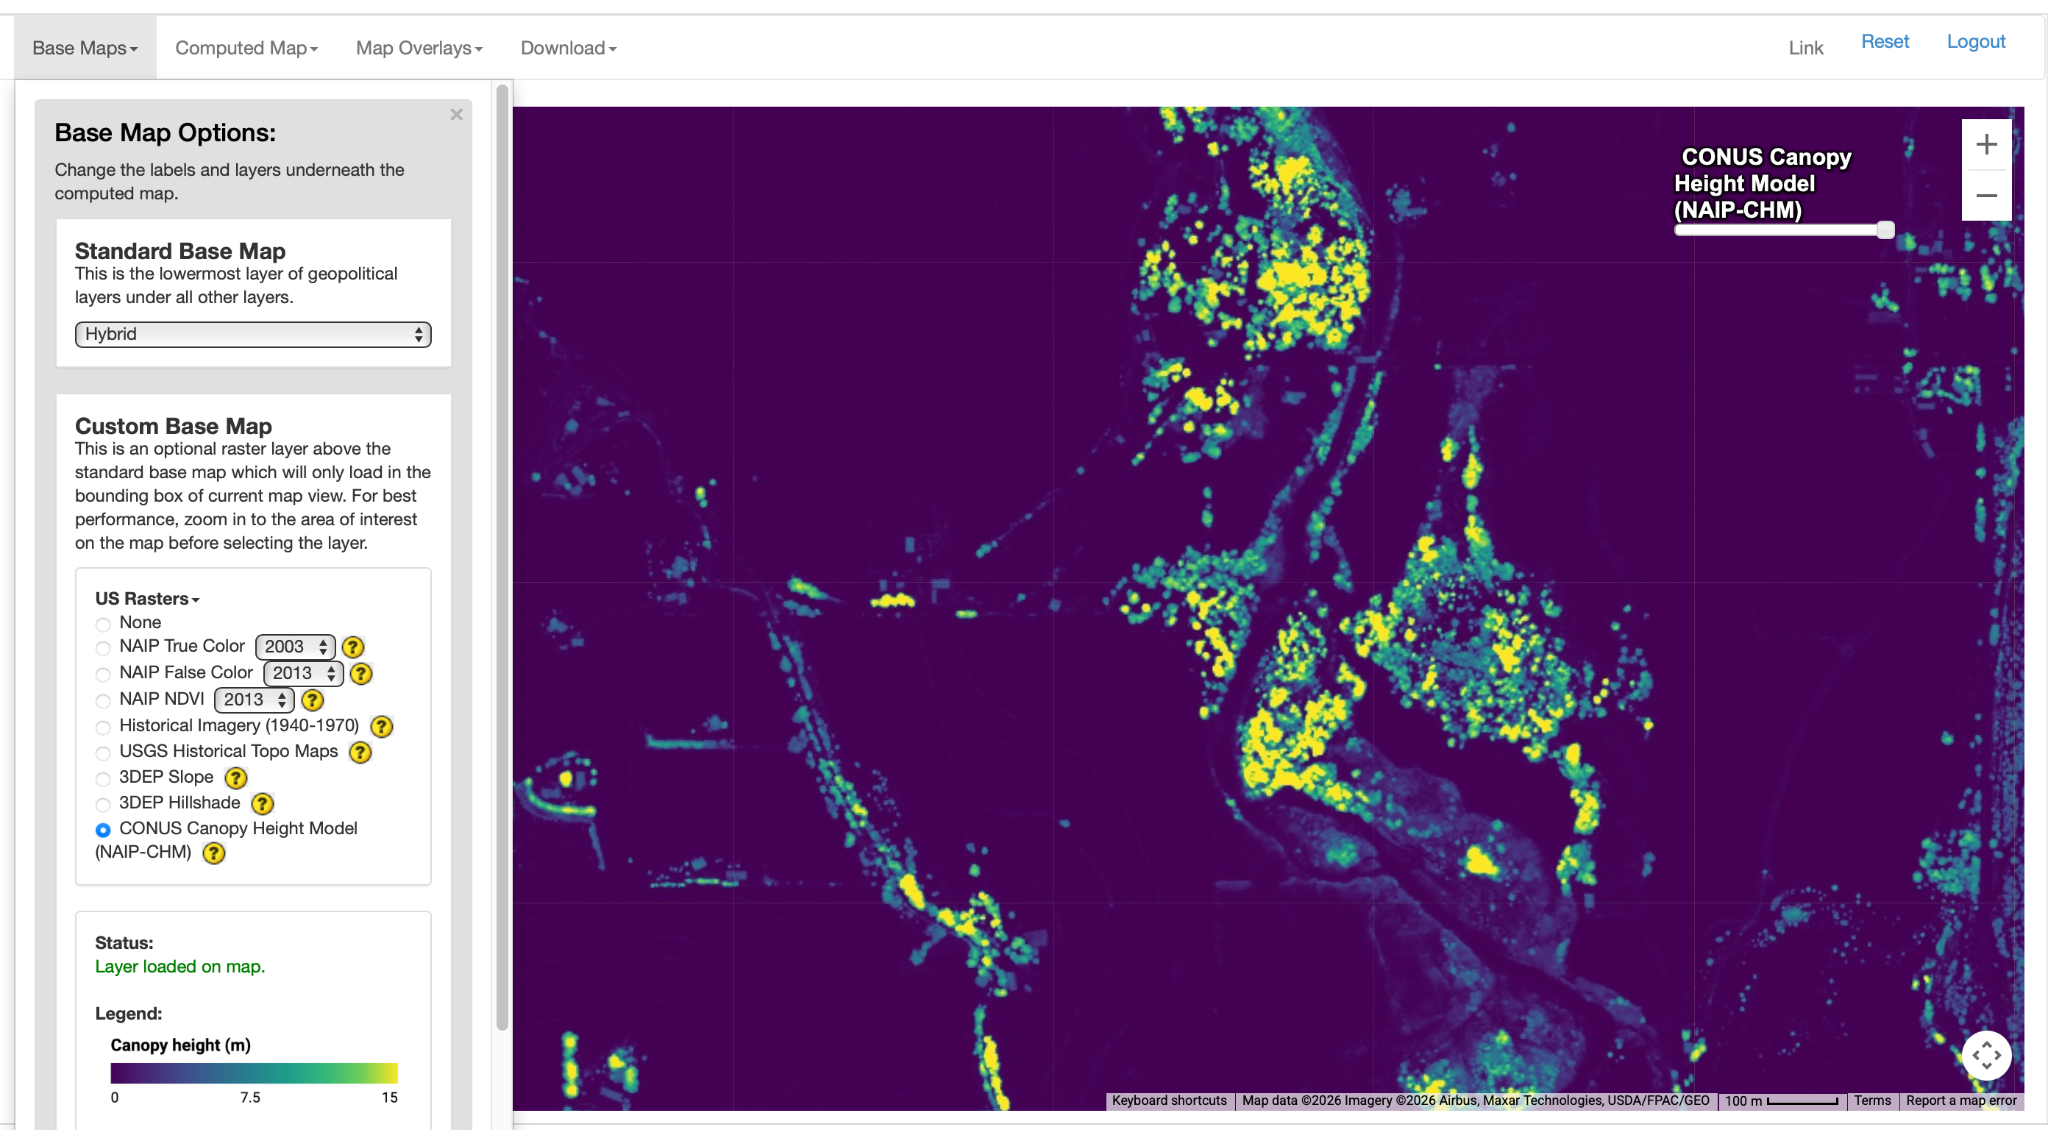
Climate Engine has added the NAIP Canopy Height Model (NAIP-CHM) as a raster basemap, bringing 0.6-meter resolution canopy height data for the contiguous United States into the web app. Developed by the University of Montana, the dataset was generated using a U-Net convolutional neural network trained on over 18 million lidar-derived training pairs, primarily drawing on NAIP imagery from 2022–2023. Rather than isolating vegetation alone, it functions as a normalized Digital Surface Model that captures the full vertical structure of the landscape, including vegetation, buildings, and infrastructure, making it useful for characterizing land surface conditions at fine spatial detail. The dataset represents a 2022–2024 composite and reports canopy height in meters, and is available under an MIT license from the University of Montana.
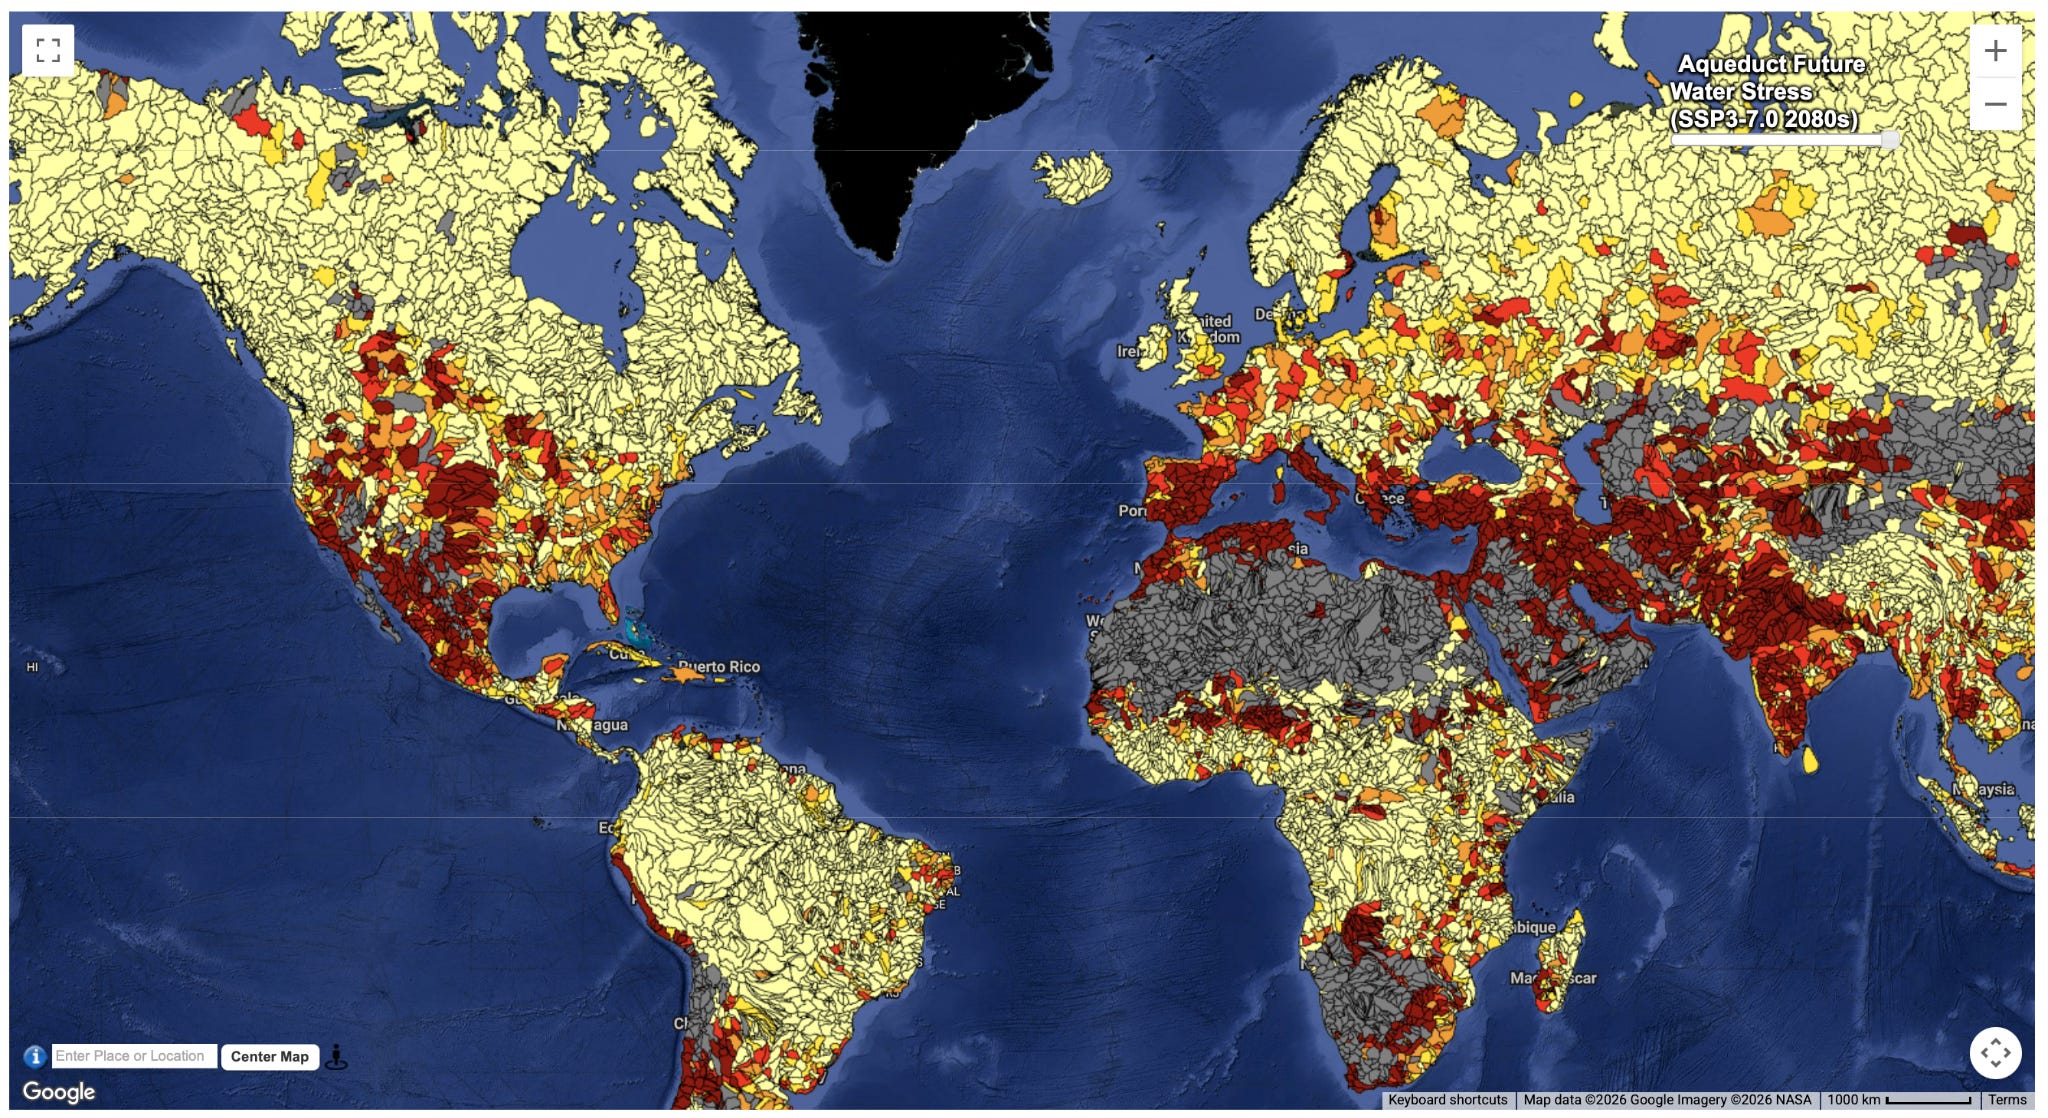
Climate Engine has added the World Resources Institute’s Aqueduct 4.0 as a choropleth vector overlay, giving users a new way to contextualize future water risk alongside Climate Engine’s existing climate and drought datasets. Aqueduct 4.0 translates complex hydrological data into water risk indicators spanning water quantity, quality, and reputational concerns, with five indicators drawing on the PCR-GLOBWB 2 global hydrological model. This dataset includes forward-looking projections centered on 2030, 2050, and 2080 under three CMIP6 climate scenarios: an optimistic pathway (SSP 1 RCP 2.6), a business-as-usual pathway (SSP 3 RCP 7.0), and a pessimistic pathway (SSP 5 RCP 8.5). In this initial integration, Climate Engine has made three indicators (water stress, water depletion, and available blue water) available as overlays in the web app, making it straightforward to place current observed conditions in the broader context of long-term water risk trajectories.
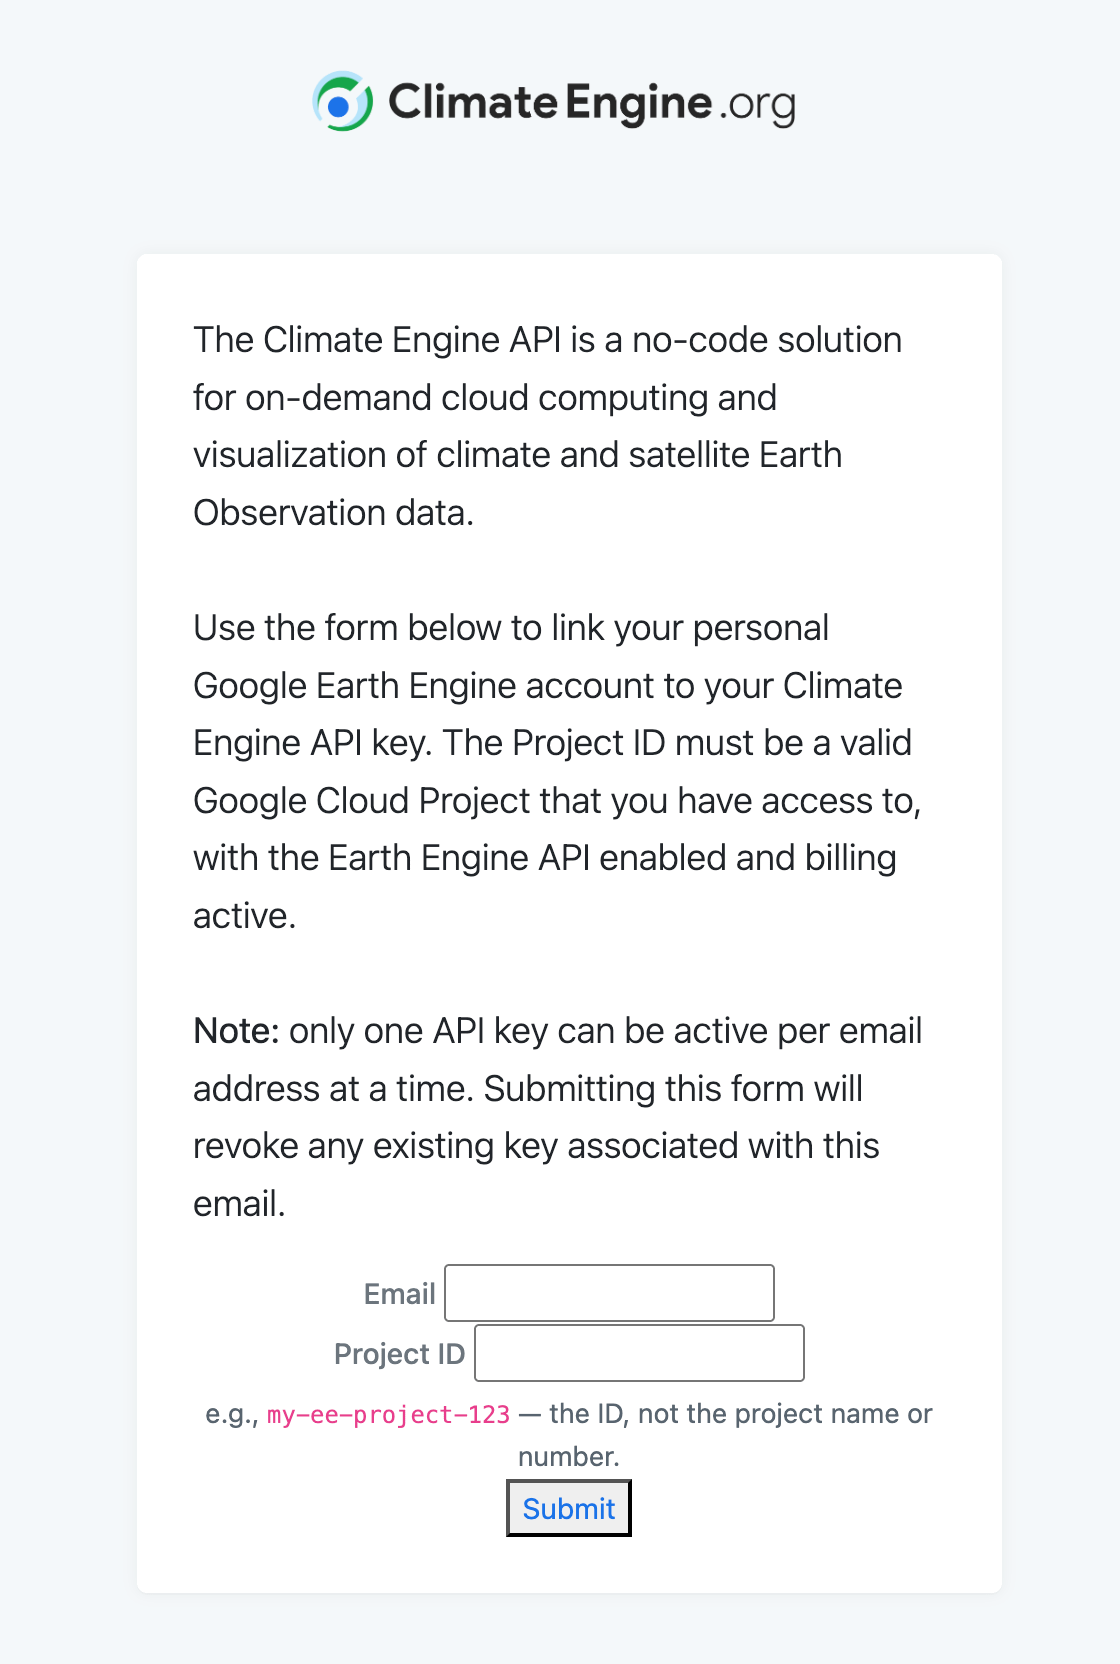
The Climate Engine–Earth Engine Connector is a new authorization workflow that allows Climate Engine API users to link their own Google Cloud Project to Climate Engine, enabling Earth Engine computations to run under the user’s account and export results directly to their own Google Cloud Storage buckets. Once set up by enabling the Earth Engine API on a Google Cloud Project, completing a short authorization form, and saving a new API key, connector-enabled workflows are exempt from Climate Engine’s standard quota limits. This makes it well suited for large image exports, recurring or scheduled jobs, and production pipelines that need outputs delivered to organization-controlled cloud infrastructure. The connector is optional and not required for standard web app or API users; it is specifically recommended for teams that have outgrown typical usage limits or need tighter integration between Climate Engine outputs and their own Google Cloud environment.
The Climate Engine API raster export endpoints now have the ability to pass a priority value to order tasks getting scheduled. The priority parameter can only be applied for projects that are registered for paid Earth Engine Access. For non-registered projects, default will be 100 regardless of parameter passed. See more here.
The Climate Engine API reports/drought endpoints have two new parameters: report_version and end_date. The report_version allows users to select between Version 1 and Version 2 of the drought reports. The end_date allows users to select the date they would like the report generated for. If drought data are not available for the selected date, the report will be snapped to the nearest previous date.
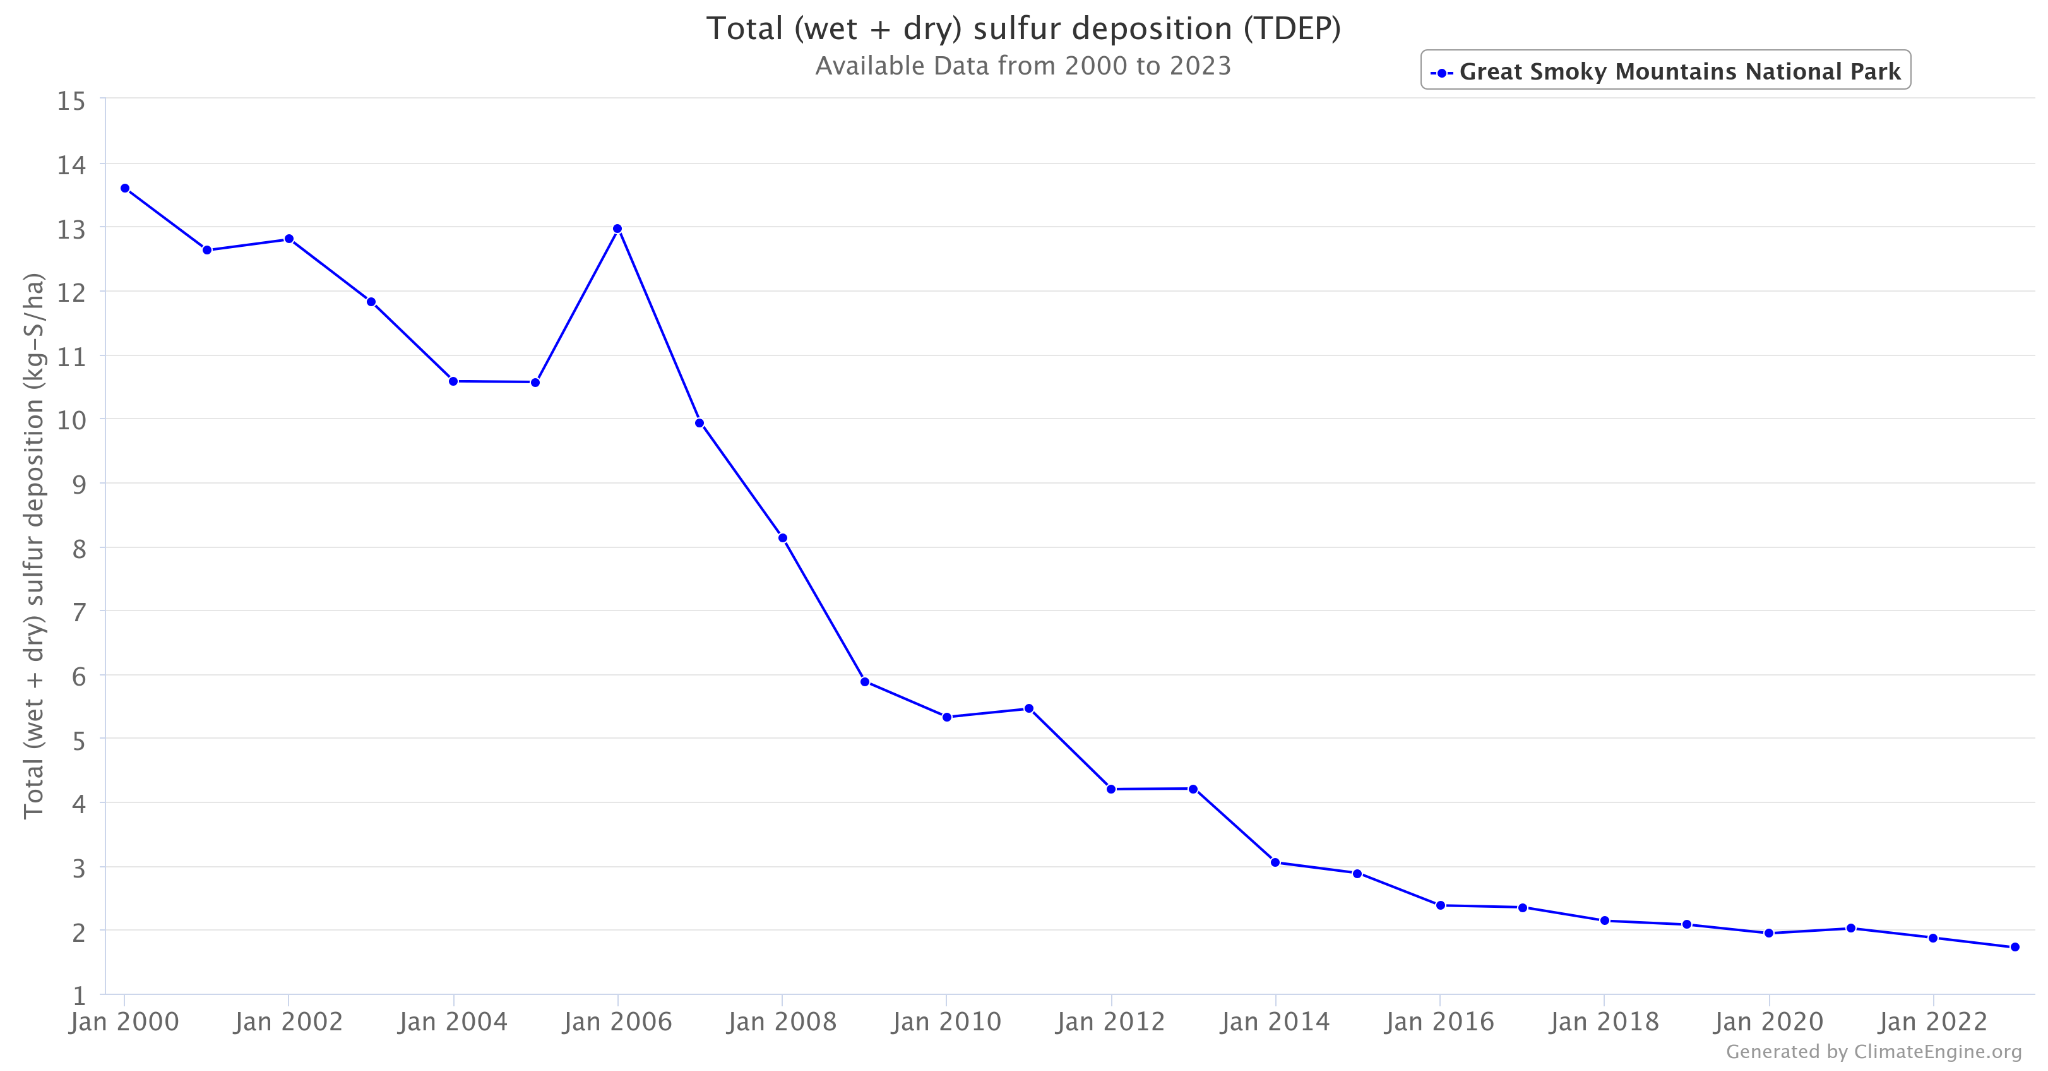
The team presented on Climate Engine with a live demo of the web app, highlighting the EPA Total Deposition (TDEP) dataset. With over forty variables, the TDEP dataset allows users to explore a wide range of deposition related questions. By bringing this data into Climate Engine tools, users can also compare trends in deposition alongside vegetation productivity and fractional cover data. The demo explored total sulfur deposition trends across the Midwest and eastern US, including a time series summary for Great Smoky Mountains National Park.
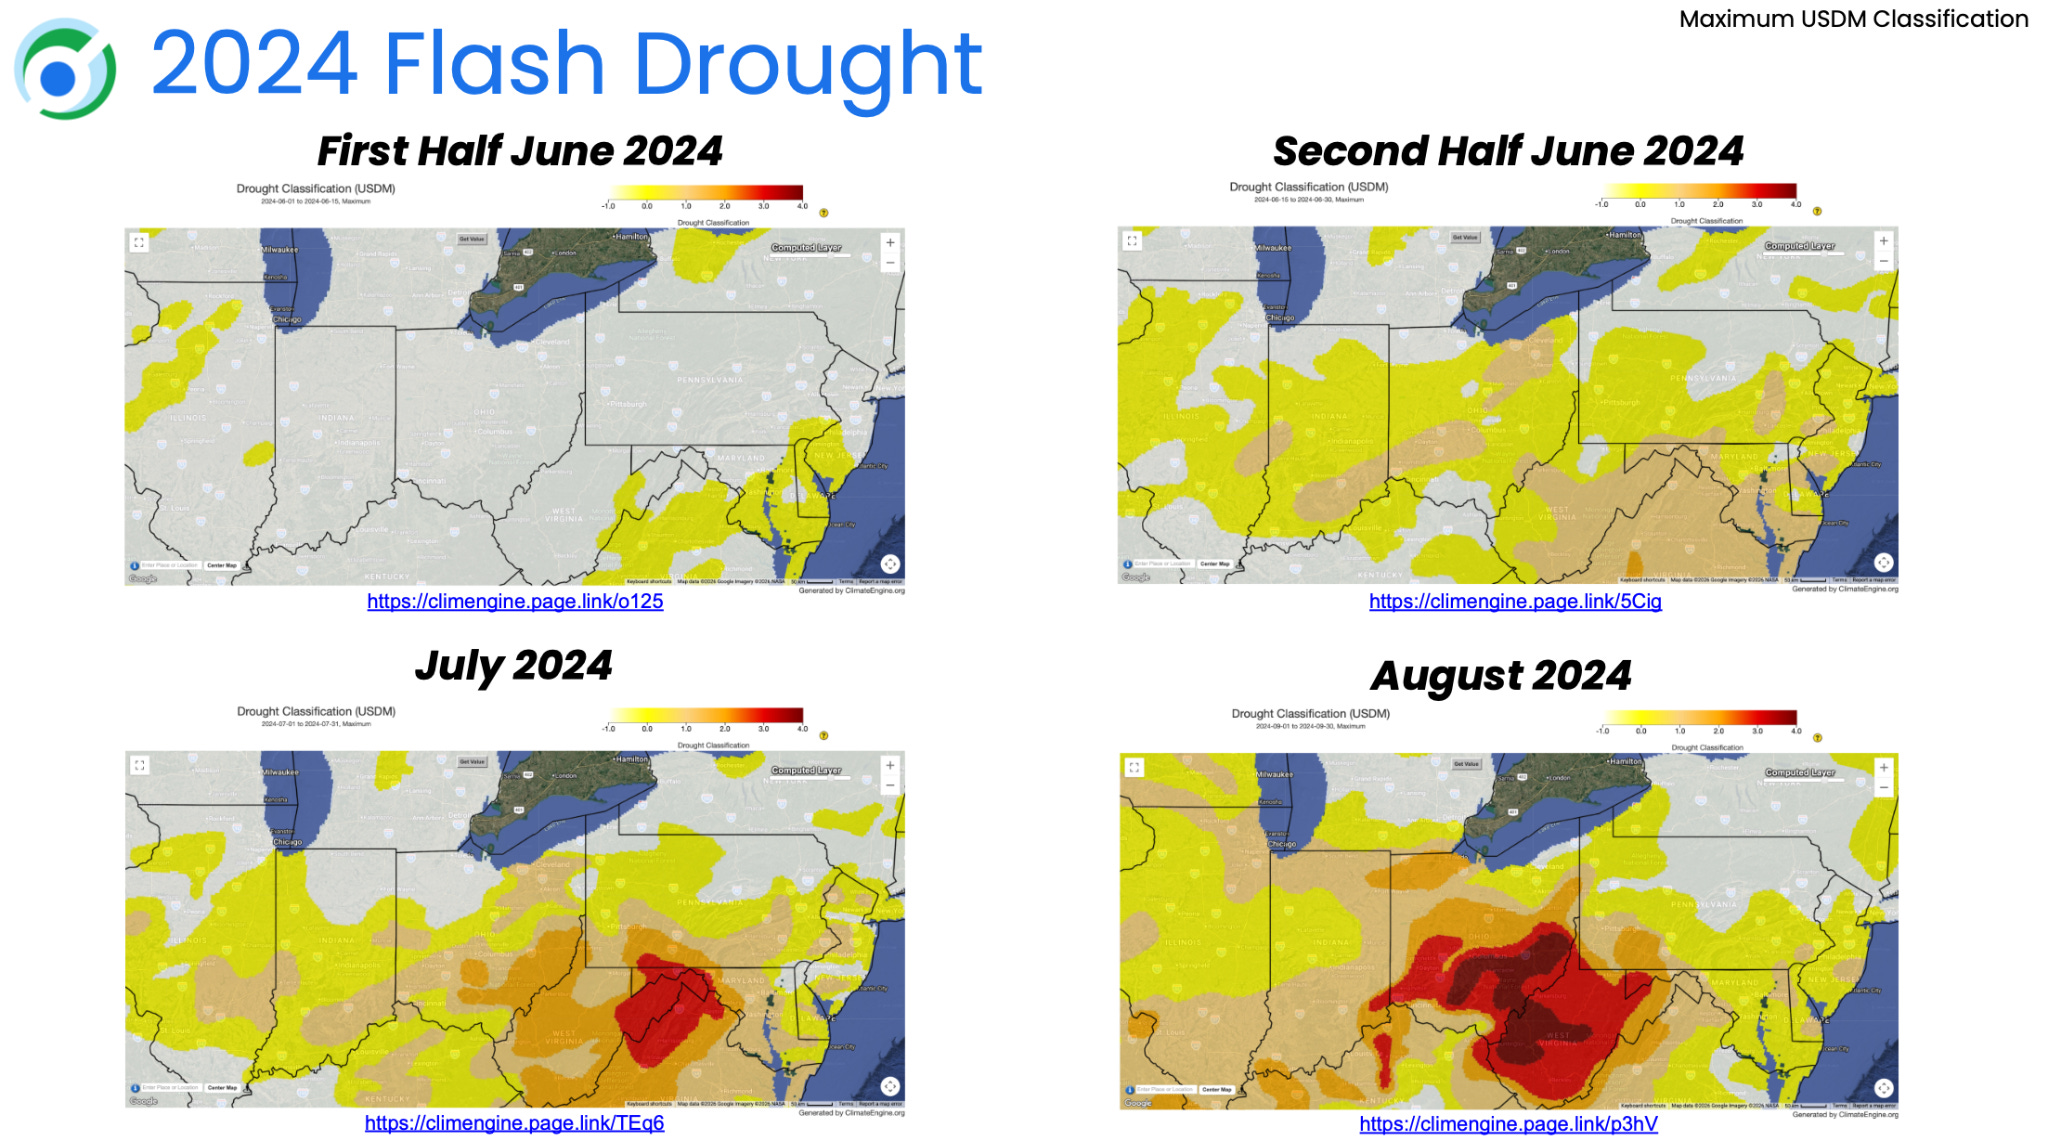
The team presented on the entire Climate Engine toolset, with a special focus on using the web app to explore drought events. Using Climate Engine’s on-the-fly anomaly and percentile mapping functionality, we were able to show that temperature in the second half of June 2024 was exceptionally high (highest average temperature for those two weeks back to 1979). Additionally, exploring the GRACE Surface Soil Moisture Percentile alongside the USDM classification showed alignment, suggesting soil moisture was significantly impacted by the drought.
No posts
Comments
Nothing yet. Say the first thing.
Sign in to join the conversation.