
You’ve read the data center stories. The gigawatt campuses. The utility deals. The town hall fights. Amazon, Alphabet, Meta, Microsoft, and Oracle plan to spend somewhere between $650 and $700 billion this year, most of it aimed at AI infrastructure.
Every one of those stories stops at the same place. The substation. The megawatts get approved, the reporter files the piece, and the story ends.
Follow the wire instead.
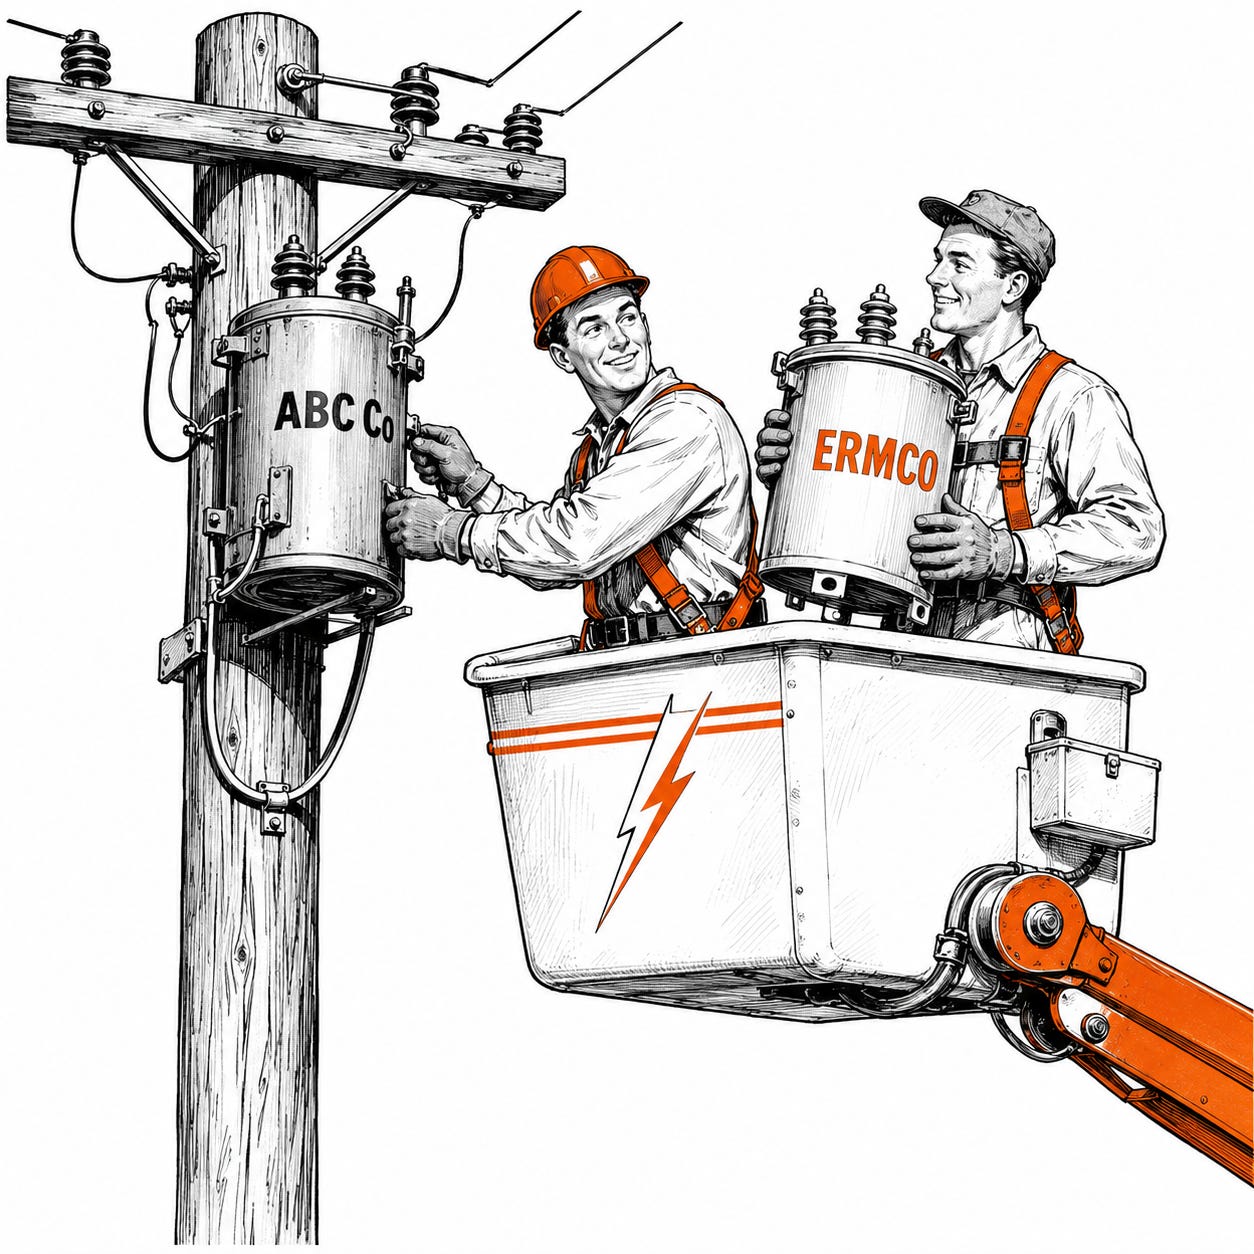
Past the substation, the voltage is still too hot to touch a building. It has to step down one last time, through a gray cylinder on a pole or a green box on a corner. That device is a distribution transformer. Every new house ends at one. Every EV charger. Every data center hall. No box, no power. No power, no story.
Here’s what’s happening to the box. Before 2020, a utility ordered distribution transformers and got them in 8 to 12 weeks. By 2022, per a letter entered into the Senate record, the wait had stretched as long as three years. More than half the transformers on the American grid are older than 33 years. And the load is still coming: the EIA projects record national power demand this year, after fifteen years of the flattest demand curve in modern history.
The utilities know. That’s why 51 investor-owned utilities just proposed at least $1.4 trillion in capital spending through 2030, a number Morningstar DBRS calls a super-cycle, double the investment of the prior decade.
The most invisible product in the economy is missing, the buyers are panicking, and a trillion dollars is rolling downhill toward a gray box.
So we ran demand segmentation on it.
If you read The Case for Demand Segmentation, skim this. If you didn’t, here’s the model.
Every market that serves institutions has two curves. Load is what the market demands. Capacity is what the installed infrastructure can process. Factors feed each curve, and the factors are publicly observable. Neither curve matters alone. The condition that matters is the gap: load pulling away from capacity, compounding, refusing to fix itself.
The point where load crosses capacity is the Demand Breakpoint. Before the crossing, the market has pressure. After it, the market must produce a buyer. The segment that forms around a breakpoint is a Demand-Qualified Segment, the DQS, the sibling of the Pain-Qualified Segment you already know from Finding Hidden Customers. Pain finds the buyers of today. Demand finds the buyers of tomorrow, while they’re still forming, while no competitor is looking.
That’s the theory. This post is the theory with its sleeves rolled up.
The market: distribution transformers. The example brand: ERMCO, a cooperative-owned manufacturer out of Dyersburg, Tennessee, roughly $774 million in revenue, one of the last major American names in the category. Standard disclosure, same as every teardown we publish: no engagement, no inside information, public data only. ERMCO has never heard of us. By the end of this post you’ll know why we picked their market anyway.
One more thing before the stages. We built the process and ran it at the same time, drafting each prompt, executing it, and correcting what broke. What follows is the run as it happened, corrections included. The corrections are the education.
The first prompt asks for the load curve, the capacity curve, and the factors feeding each. It also asks a question that didn’t exist in our pain-based work: when load exceeds capacity, why MUST the owner of this infrastructure respond? Name the forcing mechanism. If there isn’t one, stop, because you don’t have a demand segment. You have a trend.
The transformer market answered with the strongest forcing mechanism we’ve ever seen. It’s called the obligation to serve. An electric utility legally cannot refuse new load. A data center files an interconnection request, a subdivision gets platted, and the utility must build the capacity to serve it. Not should. Must. It’s the law of the franchise.
Sit with that. In the forensic equipment market we studied last time, a county under pressure would eventually respond. Here, the buyer’s response is a legal duty. The Demand Breakpoint doesn’t predict a buyer in this market. The law manufactures one.
Stage 1 also split the product line in two, and the split runs the rest of the post. Single-phase transformers follow residential load: housing starts, new meters, subdivisions. Three-phase transformers follow commercial and industrial load: data centers, chip fabs, EV fleets. Two products, two load curves, two different Americas. The prompt has a rule about this: do not average them. Averaged curves hide both breakpoints.
The second prompt catalogs the public data sources behind every factor, then ranks each source on two axes. Does it name a specific buyer, or just describe a geography? Does it appear before the buying event, or after? A source that names a buyer before the buying event is gold. Everything else is supporting cast.
The gold in this market is a document most marketers have never heard of. Rural electric cooperatives that borrow from the USDA must file a Construction Work Plan: a four-year engineering plan listing every substation upgrade, every feeder, every system improvement, with the load forecasts justifying each one. Named utility. Named projects. Filed with the federal government, surfacing through public environmental review, years before a purchase order exists.
Read that again the way we did. The buyer describes their own capacity problem, in their own words, in a federal filing, up to four years before they buy. In the forensic market we found something similar by accident and treated it as a gift. This time the prompt hunted for it on purpose. The lesson generalizes: in regulated markets, there is almost always a document where the buyer confesses. Your job is to learn its name.
The catalog also produced a free national diagnostic. EIA Form 861 is an annual census of every utility in America: sales, customer counts, peak demand, and reliability statistics, by name. Multi-year sales growth against worsening reliability numbers is the load and capacity divergence, visible per utility, in one downloadable file. And the confirmation layer sits on top: Construction Work Plans, interconnection queues, and municipal bonds on MSRB EMMA. Yes, EMMA again. Same database that found the county morgue projects. One public system, two industries, zero dollars.
The third prompt builds the concentration model, and it carries a scar from the forensic run as a law: volume beats rate. Rank by absolute projected growth, never by percentage. Percentages flatter small markets. A co-op adding 400 meters at 12 percent growth is a story. A co-op adding 9,000 meters at 4 percent growth is a customer.
Run against the grid, the model split down the product line exactly as Stage 1 predicted. Three-phase demand concentrates violently: a few dozen service territories in known corridors, Northern Virginia, central Ohio, Georgia, Texas, Arizona. Single-phase demand does the opposite, spreading across hundreds of growing co-ops and munis in the Sun Belt’s growth rings. Two rankings, two shapes, two sales motions.
And then the overlay: the entities that rank high on both lists. A fast-growing metro co-op that just caught a data center siting is carrying both curves on the same substations. That intersection is the top of the entire stack, and no single-curve model can see it.
(ERMCO, for the record, appears to see it fine. In January they announced their first plant west of the Mississippi: a 566,000 square foot three-phase facility in Maricopa County, Arizona. Look at the three-phase corridor list again. That’s demand segmentation executed in steel.)
The fourth prompt maps the matriculation chain: the ordered public stages a buyer passes through between breakpoint and purchase, per buyer type. Co-ops move through engineering studies, federal work plans, and loan reviews. Munis move through capital plans, council votes, bonds, and statutory public bids. Investor-owned utilities move through resource plans, rate cases, and vendor qualification.
The chain also grows people. That’s what matriculation means here. A board vote creates a project sponsor. An engineering study creates an engineer of record. In all three buyer types, that engineer of record shows up one stage before the specs freeze, holding more influence over the eventual purchase than anyone with “procurement” in their title. Most underrated person in the market.
And then Stage 4 broke something we believed. We assumed every chain ends in an RFP, because in the forensic market it did. In this market, half the time, there is no RFP. Transformers are recurring purchases, and utilities buy them through standing frameworks: master agreements, alliance contracts, approved-vendor lists. The visible buying event is just a release against a framework negotiated years earlier.
Which changes the objective entirely. In project markets, you chase the event. In flow markets, you win the framework slot before the load arrives, and the breakpoint model tells you which frameworks are about to be worth the most. The deadline that matters isn’t the purchase date. It’s the last reachable moment: the point after which the spec is written, the framework is set, and the decision is functionally closed. In a flow market, that moment can arrive years before any money moves. The whole argument for demand segmentation lives inside that sentence.
The fifth prompt places every ranked entity relative to its breakpoint, using evidence tests, not vibes. Past the breakpoint: load provably exceeds capacity, and the entity appears somewhere in its matriculation chain. At the breakpoint: the curves are crossing, no chain record yet. Approaching: capacity still holds, but the velocity makes the crossing a matter of time, with an estimated window and the named public filings that will announce each promotion.
The approaching class becomes a watchlist with trigger feeds: which filings to monitor, at what cadence, and what promotion means. Not a list. A standing surveillance program, built from free public data.
And then the sort produced a class we didn’t ask for. Entities that test past their breakpoint, whose reliability numbers are degrading in public, whose load is provably arriving, and who appear nowhere in any matriculation chain. No work plan. No bond. Nothing filed.
Think about what that is. An institution that legally must respond, under the obligation to serve, that has not started responding. Usually a small utility without the engineering staff to begin. Invisible to every competitor, because there’s no filing to see. Inevitable as a buyer, because the law leaves no exit. We named the series Finding Hidden Customers two years ago. This is the most hidden customer we have ever found: the buyer that doesn’t know it’s a buyer yet, in a market where it has no legal choice.
The sixth prompt assembles everything into a brief and forces a verdict, with disqualifiers it can’t talk its way around. No forcing mechanism, reject. No gold-tier source, monitor at best. It also runs a screen the demand pipeline doesn’t produce on its own: is there a pain path in this market too?
There is, and it was sitting in the same dataset the whole time. More than half the installed transformer fleet is past 33 years old, against a roughly 40-year design life, and the reliability statistics that measure the decay are filed annually, in public, by utility name. Aging equipment inside existing customers, observable through trailing public data. That’s a textbook pain segment, found by the demand pipeline’s exhaust.
Verdict: proceed, dual-path. Pain path into utilities whose installed fleet is failing today. Demand path into utilities whose load arrives tomorrow. Same verdict the forensic market earned, reached from the opposite direction, which is the strongest evidence yet that the two paths aren’t a coincidence. They’re the architecture.
Now the objection you’ve been holding since the second section. This industry is backlogged for years. Manufacturers are allocating, not selling. Why would anyone in a shortage need demand intelligence?
Because the shortage is temporary and the market structure isn’t. A distribution transformer is a spec product. When supply normalizes, and $1.8 billion of announced manufacturing expansion says it will, every vendor’s product meets the same IEEE standards, and the category snaps back to what it has always been: a commodity fight, won on price.
Unless you’re already inside. Here’s what the breakpoint model actually buys in a market like this. The vendor who found the forming buyer two years early is in the room when the engineer of record writes the spec. Their framework bid isn’t a bid; it’s a continuation of a relationship the competitors didn’t know existed. The sales cycle runs faster because the discovery happened years ago, for free, in public filings. The cost of sale drops for the same reason. And the price holds, because the differentiator was never the steel in the box. In a commodity market, knowing the buyer before they’re a buyer is the only differentiation left that a competitor can’t copy by Thursday.
Shortages end. Framework positions persist. That’s why a backlogged industry is exactly where you run this.
Last time we found buyers forming around county morgues. This time, the national grid. The six stages didn’t change between markets. Not one prompt needed a rewrite for the subject matter, only for what the run taught us about the method itself.
So the test for your market is the same four questions. Are load and capacity publicly observable? Does the gap compound instead of self-correcting? Is the responding buyer an institution that must act? Does its formation run through public records? Four yeses and there are buyers forming in your market right now, in plain sight, on a schedule you can read.
Everything below is what we used to read it.
The six prompts from this run, frozen at v1.0, each as a Claude artifact you can open and run. They run in sequence; each stage’s output feeds the next. Expect your market to correct you somewhere around Stage 3. Let it. The corrections are where the method learns your market.
Prompt 1: Curve Identification. Start here with your product category and buyer types. Finds both curves, their factors, and the forcing mechanism, or tells you honestly that you don’t have one.
Prompt 2: Data Source Catalog. Turns the factors into named public databases, ranked by whether they identify buyers and how early. Hunts for the document where your buyer confesses.
Prompt 3: Demand Concentration Model. Ranks named entities by volume, gap, and velocity. Volume beats rate. Separate rankings per product line, plus the overlay class.
Prompt 4: Matriculation Chain. Maps the formation stages per buyer type, the records each stage files, the people each stage creates, and the last reachable moment.
Prompt 5: The Geometry Sort. Places entities past, at, or approaching their breakpoint with evidence tests, builds the watchlist, and reports the anomalies. The hidden customers live in the anomaly report.
Prompt 6: The Demand Brief. Assembles the run into a decision: proceed dual-path, proceed demand-only, monitor, or reject, with disqualifiers that keep it honest.
One more thing. This progression is becoming an agent, the way Finding Hidden Customers did. Run it by hand first anyway. The hours you spend running it manually are how you’ll know, later, exactly what the agent should never get wrong.
Start here: The Case for Demand Segmentation | Go deeper: Finding Hidden Customers: The Playbook | See it in action: We Built an Agent for Finding Hidden Customers. Here’s Yours.
Comments
Nothing yet. Say the first thing.
Sign in to join the conversation.