
From the Census Bureau: Permits, Starts and Completions
Housing Starts:
Privately-owned housing starts in July were at a seasonally adjusted annual rate of 1,239,000. This is 12.4 percent below the revised June estimate of 1,415,000 and is 13.5 percent below the July 2025 rate of 1,432,000. Single-family housing starts in July were at a rate of 808,000; this is 9.9 percent below the revised June figure of 897,000. The July rate for units in buildings with five units or more was 421,000.Building Permits:
Privately-owned housing units authorized by building permits in July were at a seasonally adjusted annual rate of 1,443,000. This is 5.0 percent above the revised June rate of 1,374,000 and is 3.1 percent above the July 2025 rate of 1,400,000. Single-family authorizations in July were at a rate of 894,000; this is 2.5 percent above the revised June figure of 872,000. Authorizations of units in buildings with five units or more were at a rate of 490,000 in July.
emphasis added
The first graph shows single and multi-family housing starts since 2000 (including housing bubble).
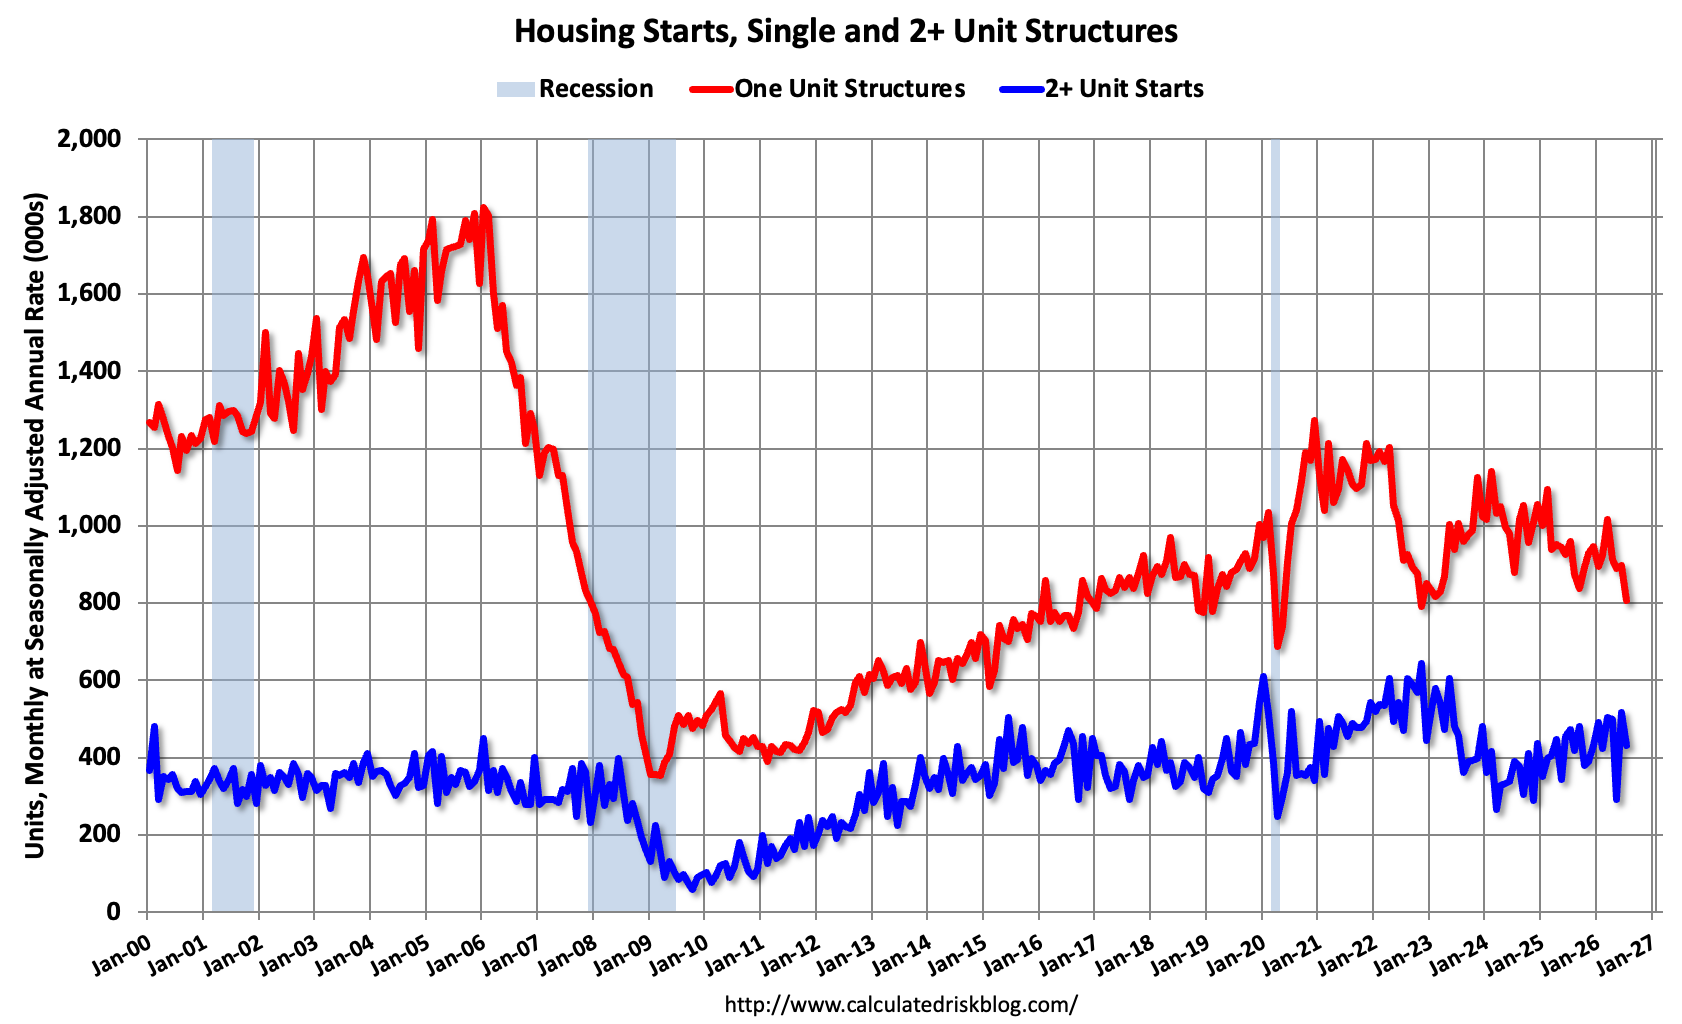
Multi-family starts (blue, 2+ units) decreased month-over-month in July. Multi-family starts were down 8.9% year-over-year. Single-family starts (red) decreased in July and were down 13.5% year-over-year.
The second graph shows single and multi-family starts since 1968.
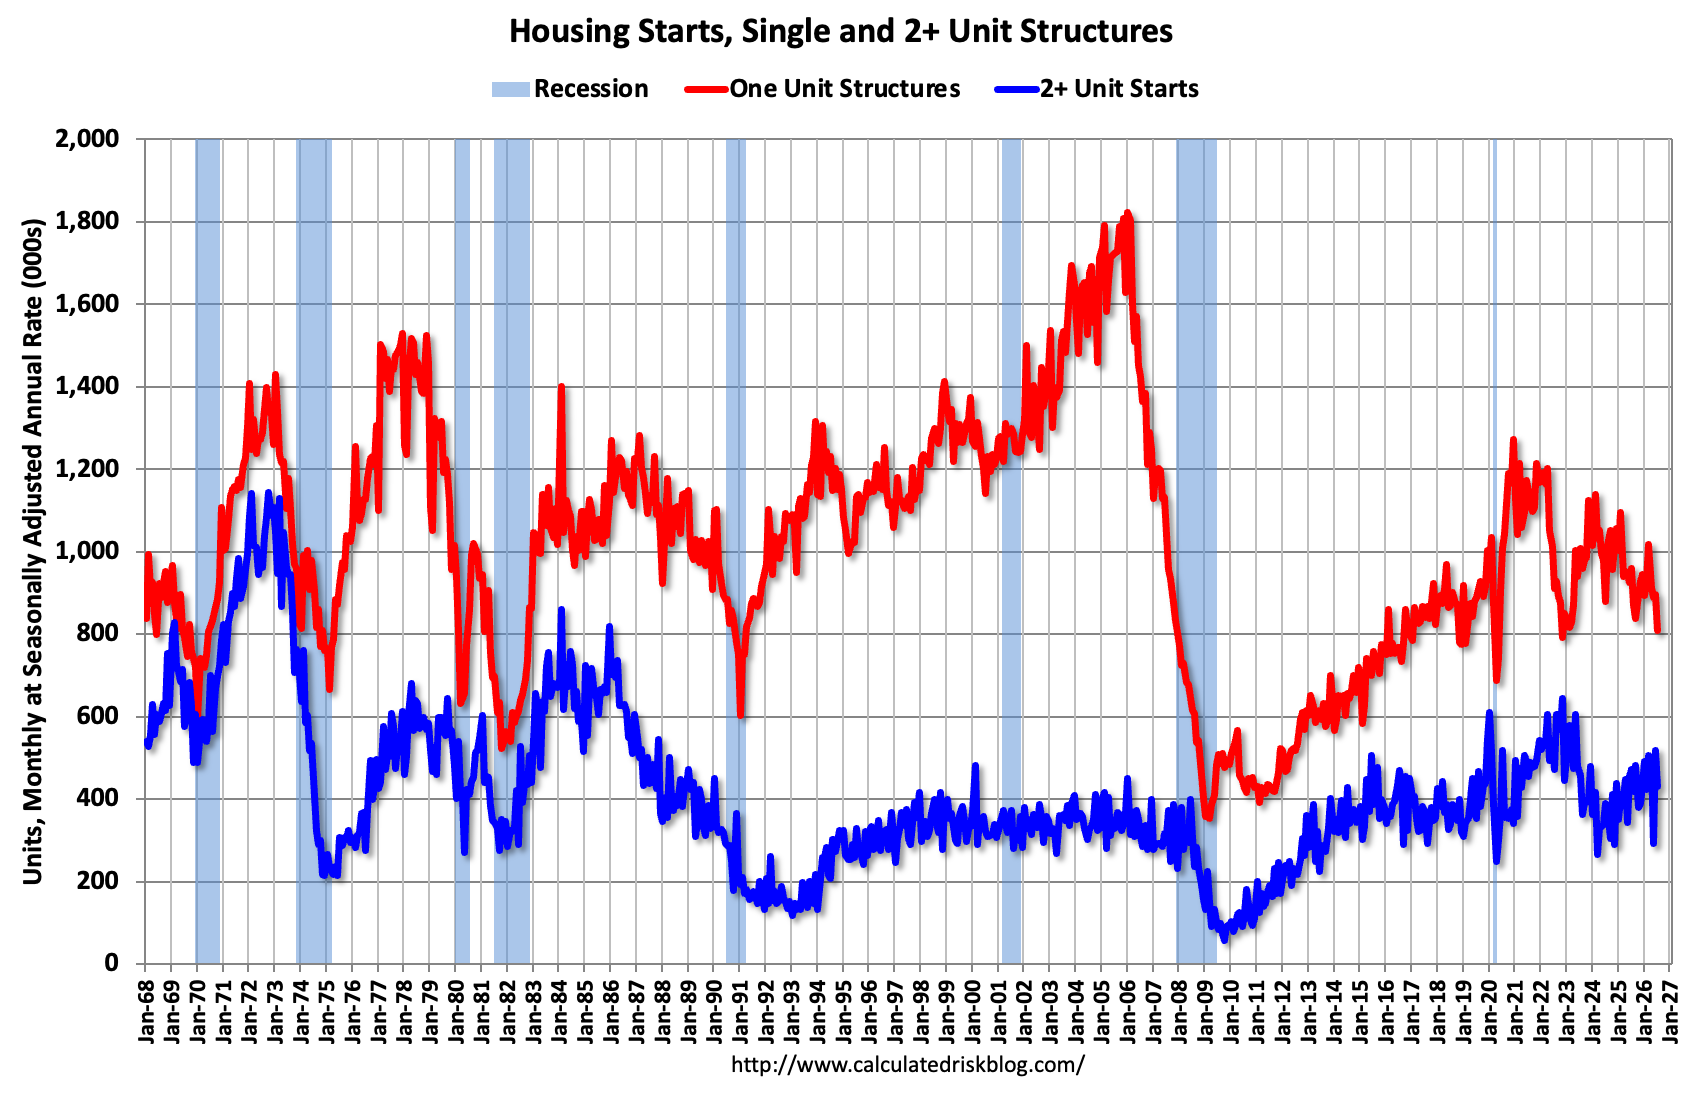
Total housing starts in July were below expectations and starts for the previous two months were revised down.
The third graph shows the month-to-month comparison for total starts between 2025 (blue) and 2026 (red).
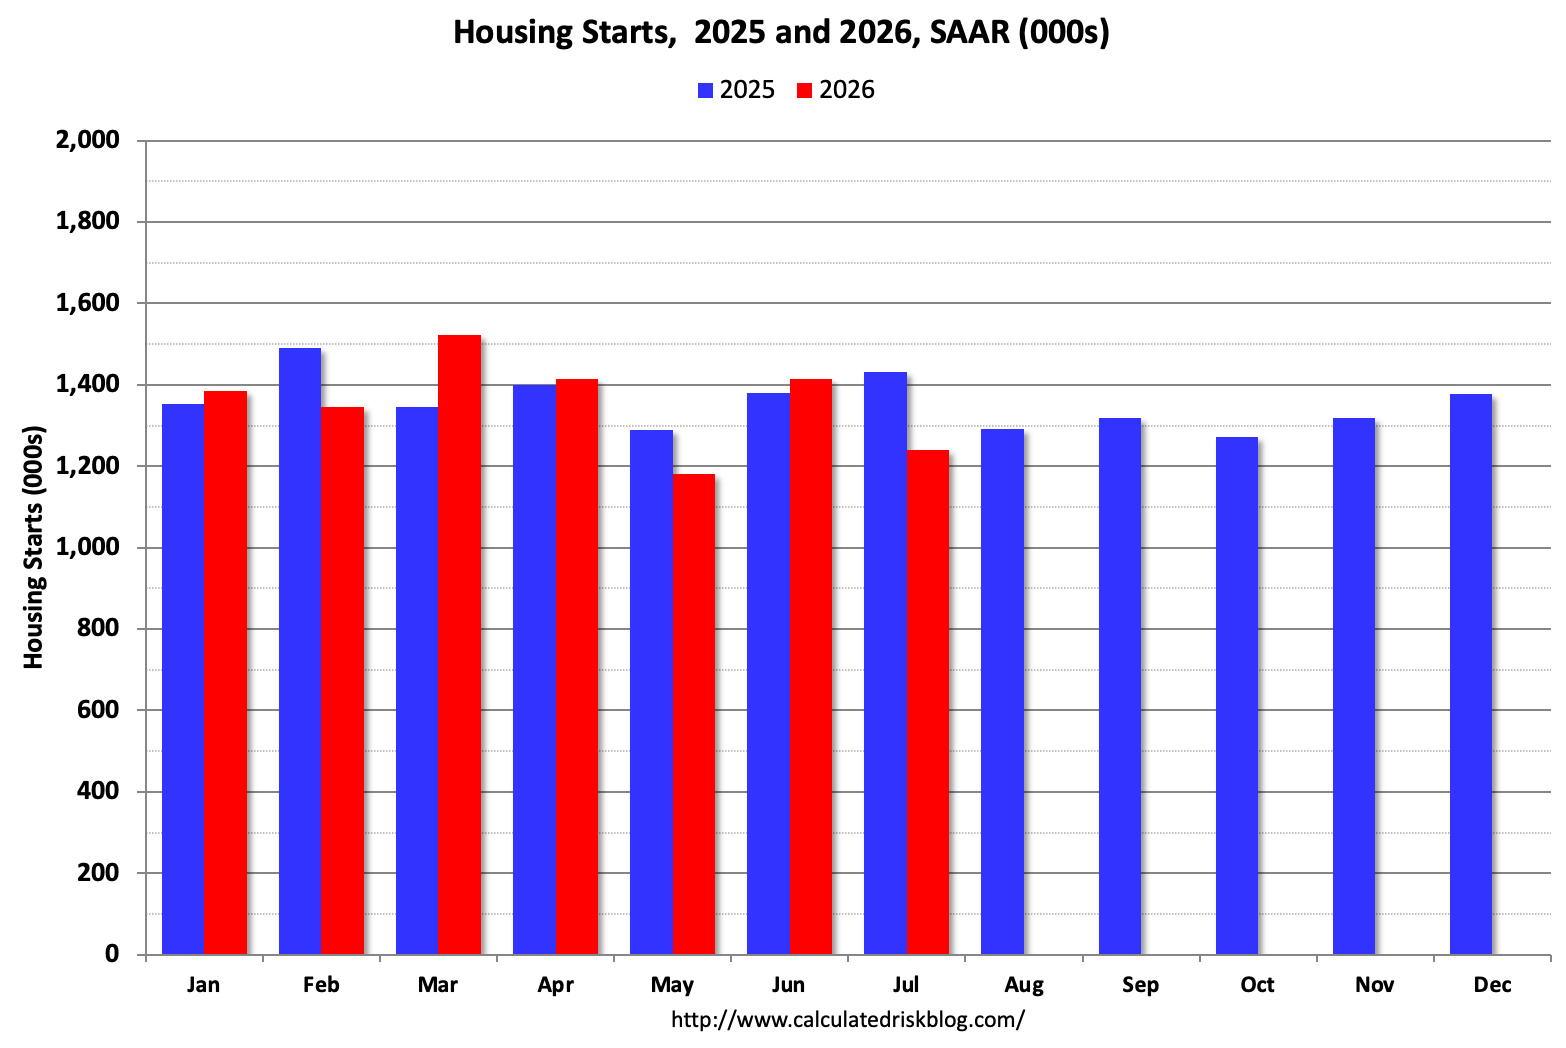
Total starts were down 13.5% in July compared to July 2025.
Year-to-date, total starts are down 2.0% NSA compared to same period in 2025.
The fourth graph shows housing starts under construction, Seasonally Adjusted (SA).
The following content is for paid subscribers only. Thanks to all paid subscribers!
Comments
Nothing yet. Say the first thing.
Sign in to join the conversation.