
Yesterday, in Part 1: Current State of the Housing Market; Overview for mid-August 2026 I reviewed home inventory and sales.
In Part 2, I will look at house prices, mortgage rates, rents and more.
Here is an interesting graph from Realtor.com on median list house prices. According to Realtor.com, list prices peaked in 2022 (when interest rates moved sharply higher) and have moved mostly sideways for four years.
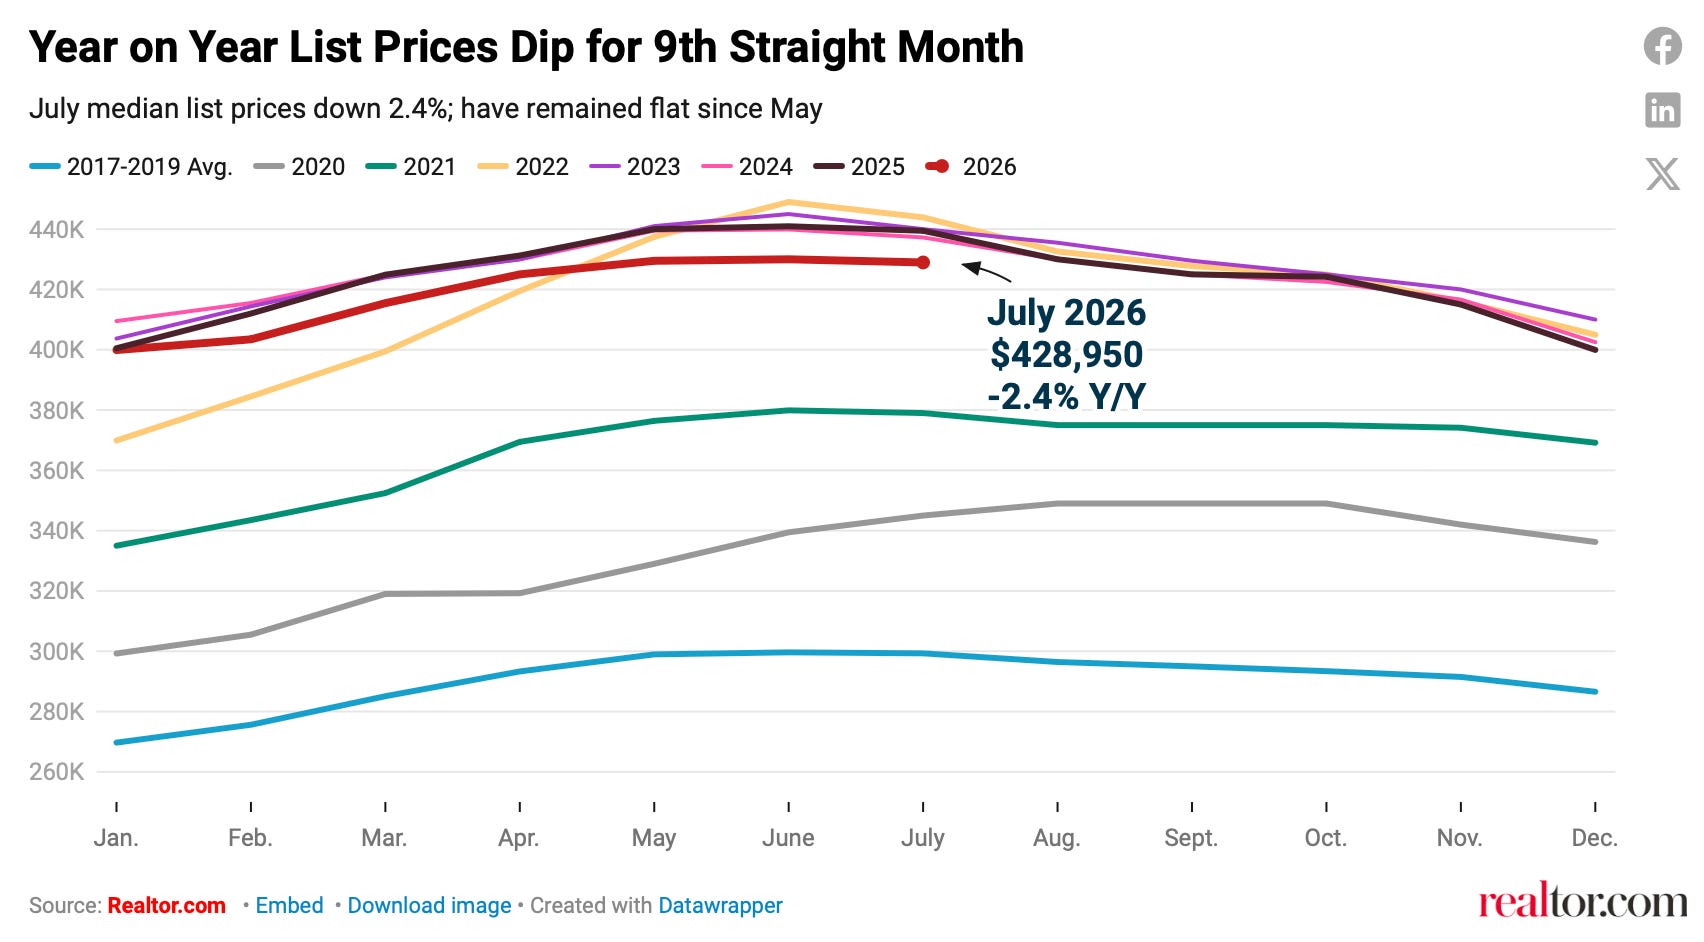
These are median prices and can be distorted by the mix, but median list prices have been down year-over-year for nine consecutive months. Also, June median prices are typically the peak for the year - so this measure of prices will likely decline through December.
The Case-Shiller National Index increased 1.1% YoY in May and will likely be up a little more in the June report (based on other data).
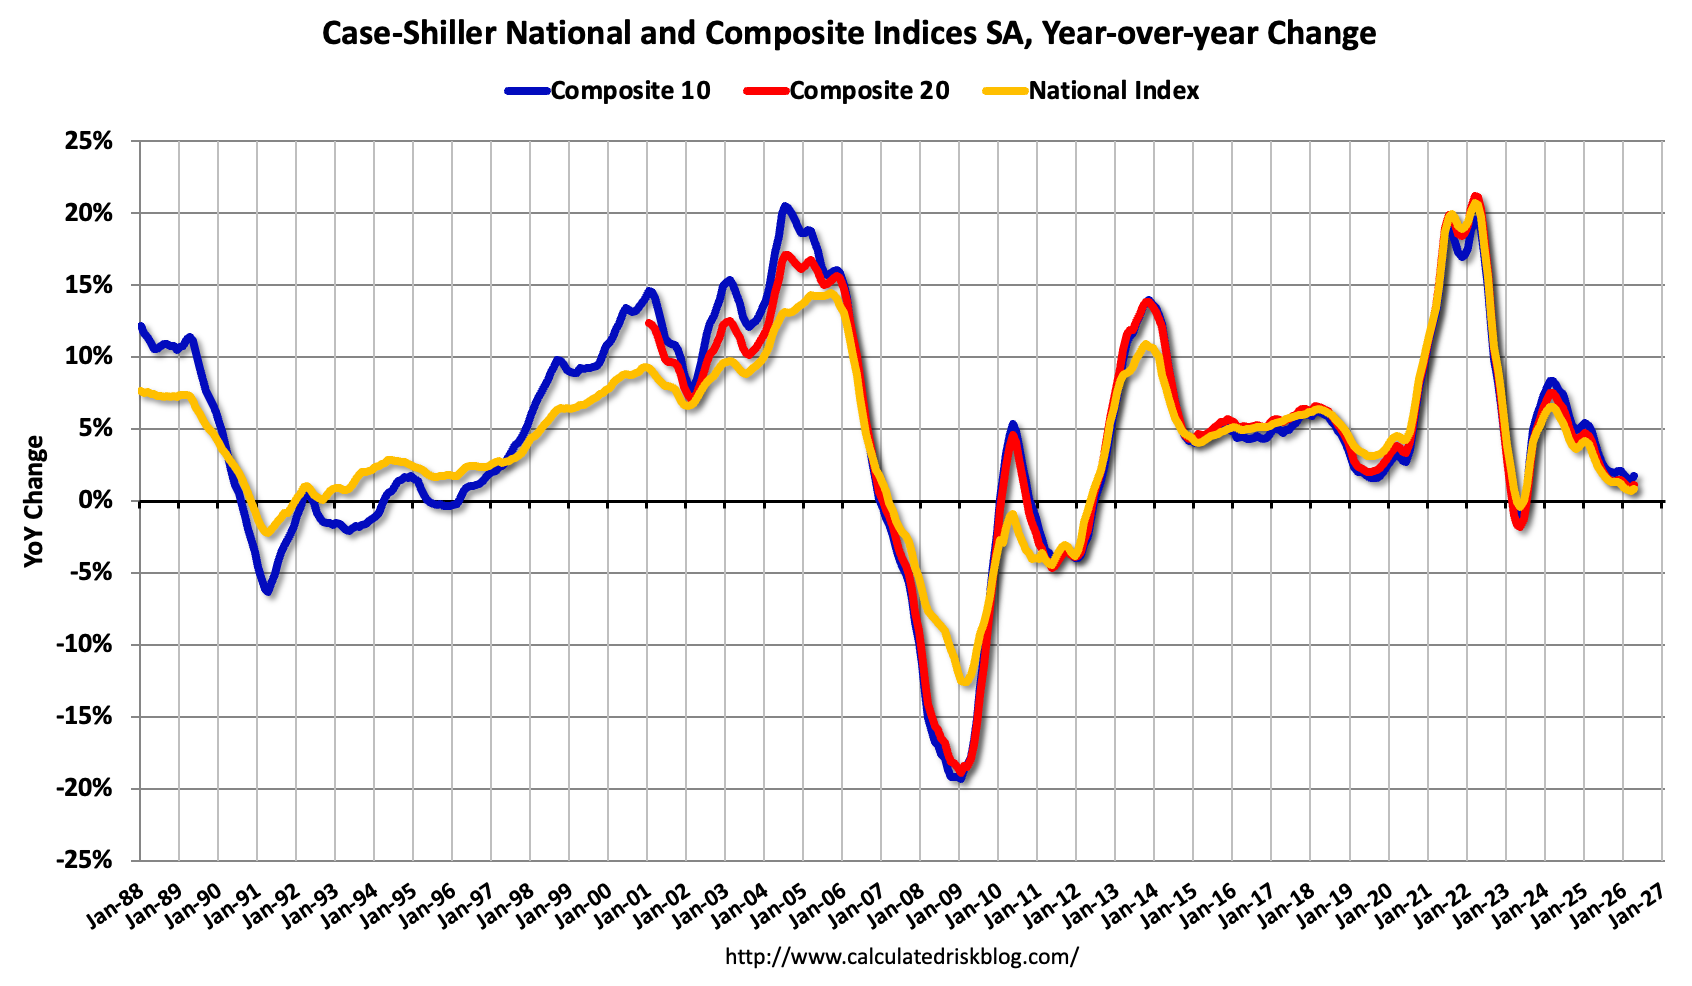
The Composite 10 NSA was up 2.4% year-over-year. The Composite 20 NSA was up 1.6% year-over-year. The National index NSA was up 1.1% year-over-year.
The National index decreased 0.05% month-over-month (MoM) seasonally adjusted. This was the 3rd consecutive month with a MoM decline. Note that the seasonally adjusted month-over-month Case-Shiller price was negative in the March through July 2025 period. Last year, the National index was down 0.13% MoM in June. This makes it mathematically more difficult to see further declines in the year-over-year change over the next couple of months.
Let’s review some more timely house price data …
The following content is for paid subscribers only. Thanks to all paid subscribers!
Comments
Nothing yet. Say the first thing.
Sign in to join the conversation.