
WHAT THIS EXHIBIT SHOWS
Why this number matters. Almost every objection raised in Nashville about scale, traffic, infrastructure or displacement is answered with the same sentence: the city needs 90,000 more homes. It is the figure that ends the conversation. This file is what happens when someone checks it.
Three findings. Two documents are in play throughout: the target itself lives in Metro’s Unified Housing Strategy, and the program built on top of it lives in the Housing and Infrastructure Study. Each section stands on its own, so read them in any order, and skip to whichever number you came to check.
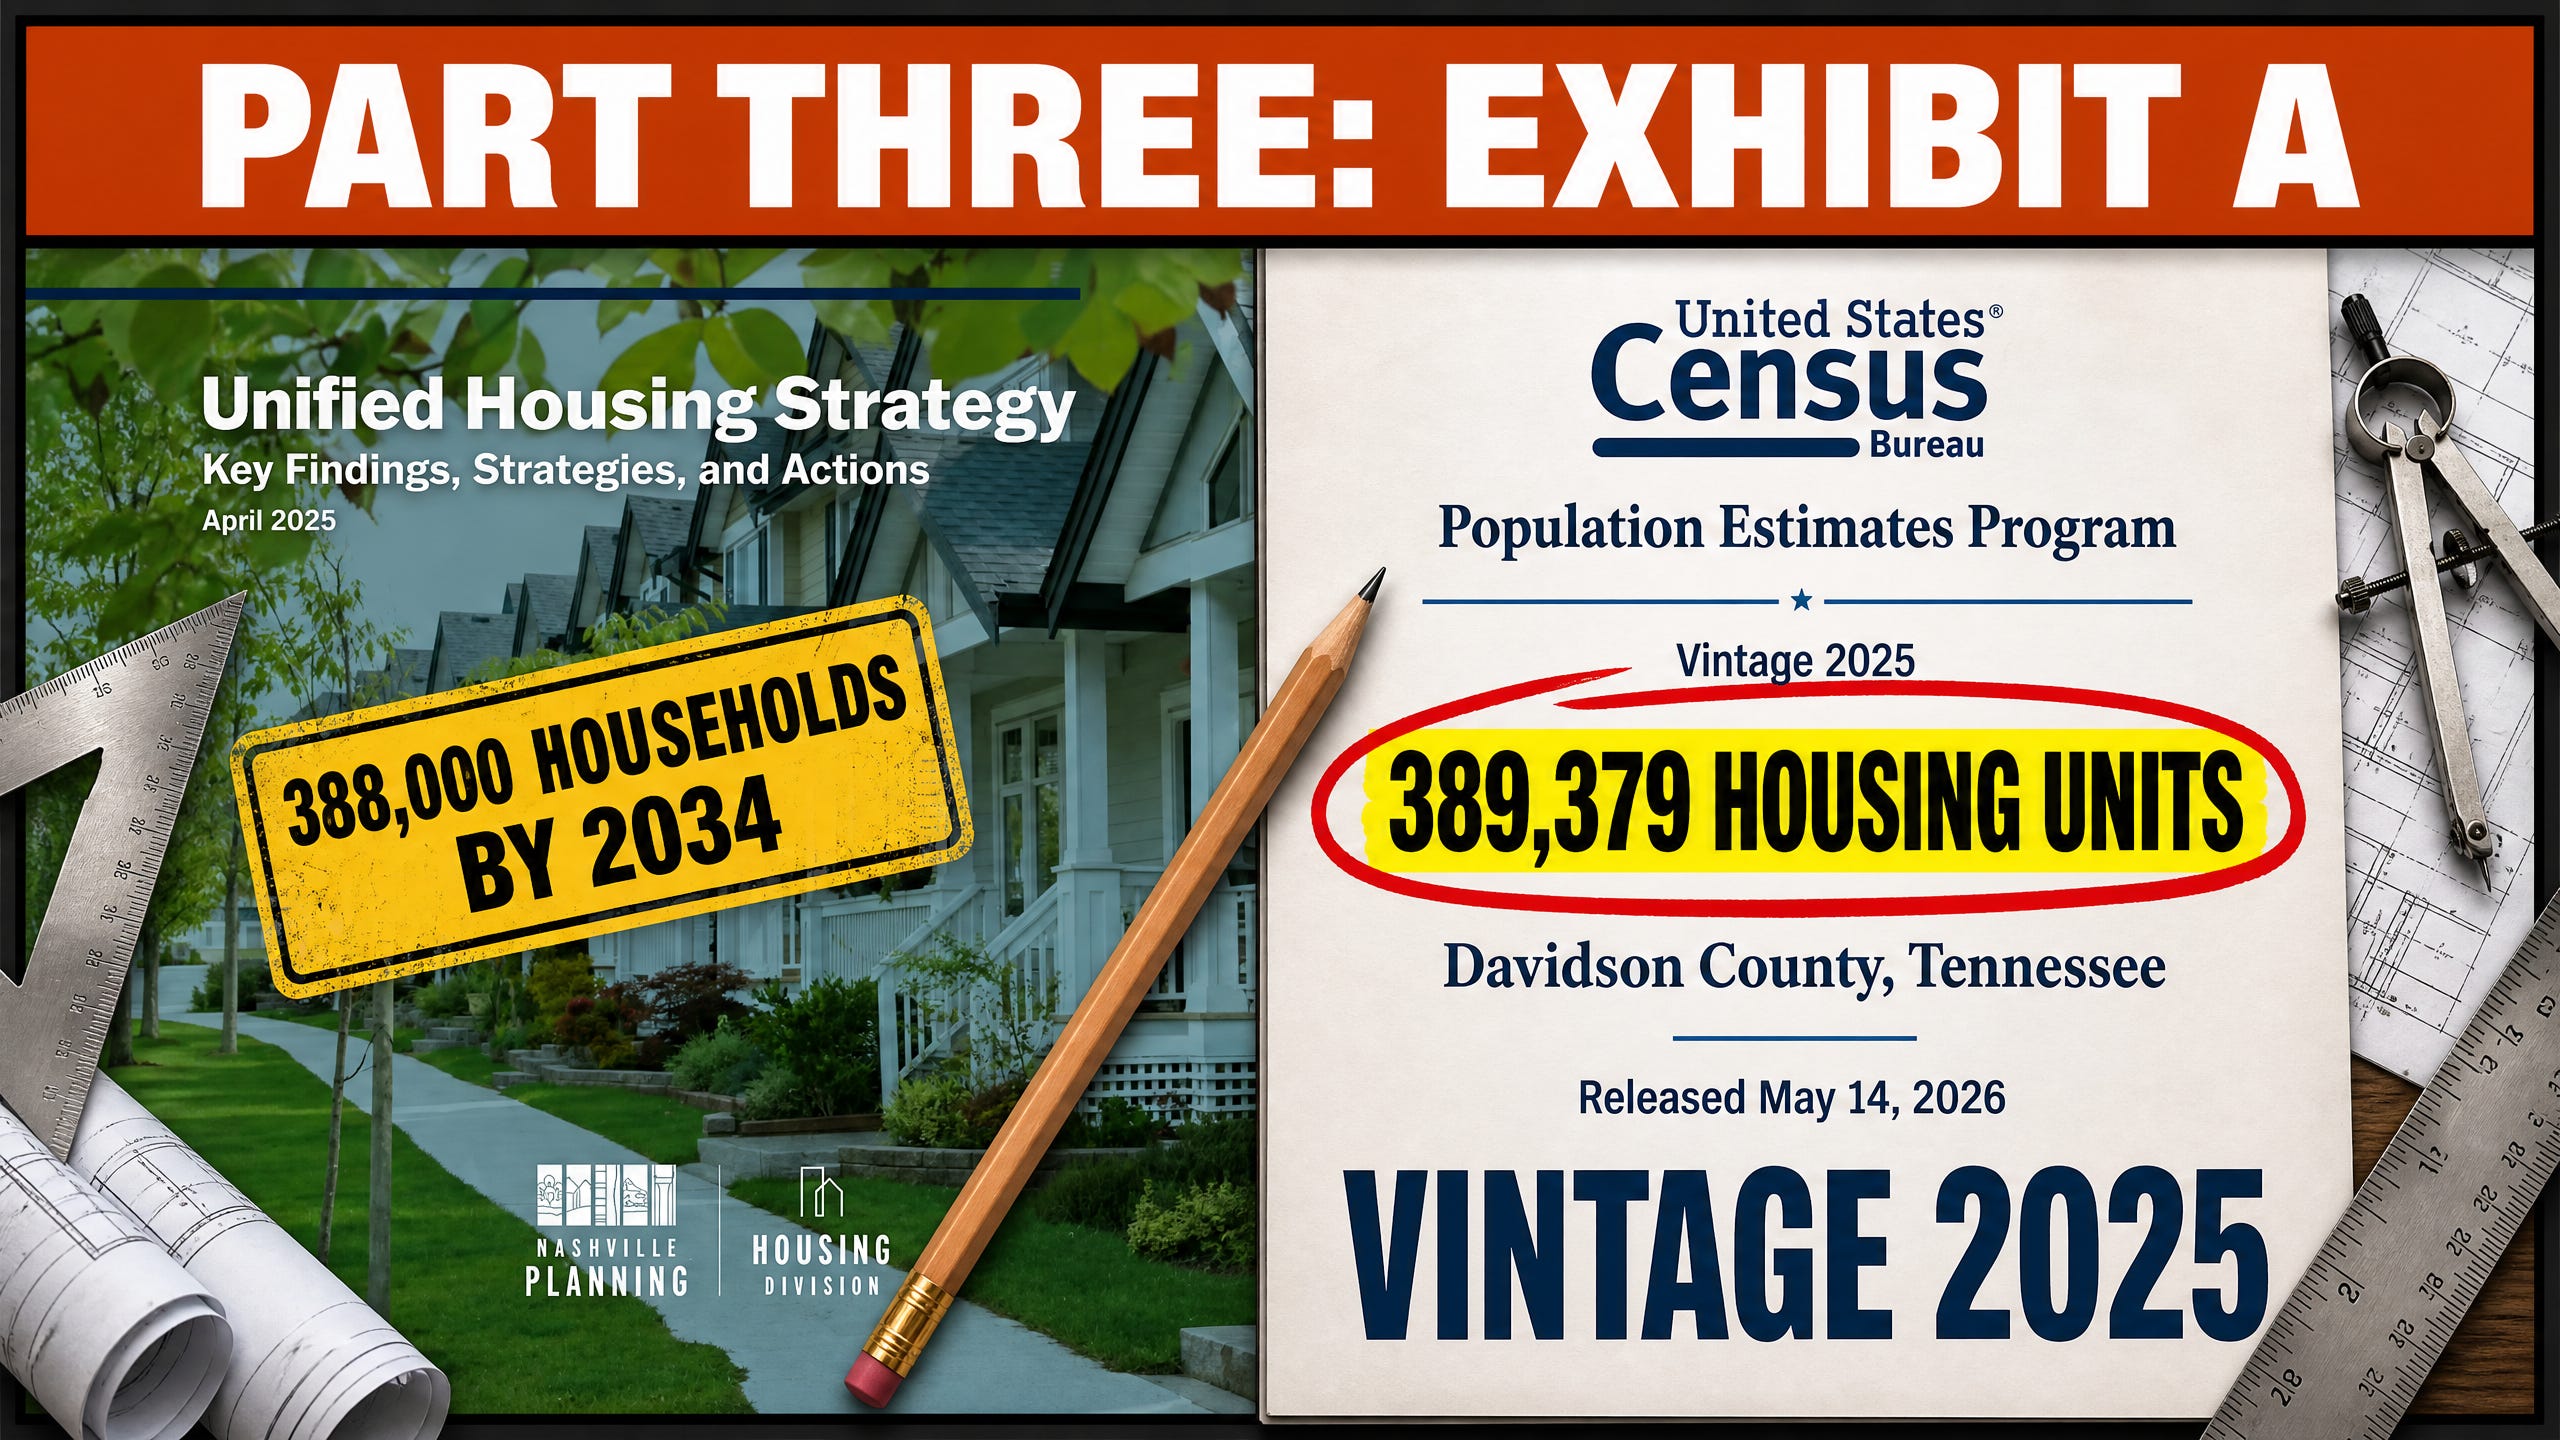
The count. Davidson County already has more housing units standing than the households Metro’s own forecast projects for 2034, and the year the household counting starts was never stated in the document that set it. Sections 1 through 3.
The target does not survive its own inputs. Substitute the state’s official population projection, or credit the housing units built since the baseline, or simply ask whether the assumed population is arriving, and the emergency shrinks on every test. Section 4.
The deficit is real, and this program does not reach it. The strategy counts 15,300 households short at the bottom of the income range, then prices its own prototypes at 212 to 245 percent of area median income, excluding every one of them from its attainable housing program by definition. Sections 5 through 7.
And one term nobody priced. Tennessee assesses the identical building two ways depending on how many units inside it are rented, 40 percent of value against 25. That falls on the rental version of the missing middle, which is what the new districts are written to produce. Asked at a public meeting whether it reaches rents, Metro’s planner said he would expect so, and then that it is not something they have looked at. Section 8.
A word on length, briefly, since the rest is not. This runs about half an hour cover to cover, and it is a reference file rather than an essay. It was built to be checked, and checking takes more words than persuading does. Nobody reads a file like this straight through, including the person who wrote it. If you read one section, read Section 4, where every lever is tested one at a time. If you came to check a figure, Section 9 lists the sources.
Republished 8/25/2026. The ongoing study has tightened the historic census data around this file: the household-side Census measurements are now on the record and are added below, and the strategy’s implied 2020 household base is now stated with its figure. No table, no figure, and no finding changed.
How to read this exhibit. Three rules govern everything below. First, their numbers first: every test starts from Metro’s own published figures and substitutes one input at a time. Second, the supersede rule: when sources conflict, the latest-dated official document wins. Third, two ledgers: what Metro could know when the studies printed is kept separate from what the current data shows, so no one is graded against numbers that did not yet exist. Nothing here requires special access. Every source is public, and the closing section tells you where to pull each one.
Update, August 21, 2026. This version supersedes the version published August 18. Reading the appendix's figures rather than only its text turned up material the first version did not have. Four sentences overstated what the appendix omits and have been narrowed to what its pages actually say. Two findings have been added on the strength of the same reading. No table, no figure and no arithmetic in this document changed. The corrections are itemized in Section 9.
The 90,000 is the end of a five-step chain in the Unified Housing Strategy’s Appendix B, pages 144 through 146. A jobs-based projection, which the appendix itself describes as “a more aggressive population forecast,” produces 892,000 residents by 2034, an addition of about 175,000 people. Dividing by an assumed average household size of 2.3 yields about 388,000 total households, an increase of about 85,300. A 7 percent vacancy allowance converts households to housing units: 85,300 × 1.07 is about 91,271, published as 91,288 units, rounded in public speech to 90,000. One line matters more than any other: the projections begin with 2020. Every unit built since 2020 counts against this target.
THE CHAIN, IN FIVE STEPS
One. A jobs-based projection puts Davidson County at 892,000 residents in 2034, an addition of about 175,000 people.
Two. Divided by an assumed household size of 2.3, that is about 388,000 households in 2034.
Three. Subtracting the 2020 household base of about 302,700 leaves an increase of “about” 85,300 households.
Four. A 7 percent vacancy allowance converts households to housing units: 85,300 × 1.07 is about 91,271.
Five. Published as 91,288 net new homes by 2034, and rounded in public speech to 90,000.
A word about that starting line, because it was never disclosed. The 90,000 arrived as a quantity of homes with a deadline attached and no starting point named, and an unanchored number cannot be checked, only repeated. The only anchored figure in the chain is the destination. Recovering the baseline takes arithmetic: 892,000 minus 175,000 is 717,000, and 717,000 is the 2020 census count of 715,884. It is not 2024, when the county stood at 736,623, and not 2025, at 745,904. The base year is 2020, and it is 2020 by subtraction. Search the full strategy for “2020,” and it appears six times, none of them the baseline: a citation date, the 2020 tornado, a source line under a figure, a disaster funding line, a production count, and a capital spending plan. So a reader hunting for the starting year will not find it and may reasonably conclude the claim was invented. It was not invented. It was derived; the derivation is above, and the fact that it had to be derived is one of the findings. The household side of the same subtraction: 388,000 minus 85,300 is about 302,700 households in 2020, exact by construction, carrying only the strategy’s own word “about” from both inputs. The 2020 Census’s own household count stands as the independent check on that implied base, a separate instrument, never blended with the strategy’s figures.
The document also tells its readers the opposite. At least six times, in the body text and again in the executive summary, the strategy describes the target as covering “the next ten years.” Verbatim: “HR&A estimated that the county will need over 90,000 new homes in the next ten years.” So the same document that computes fourteen years of demand tells the public it is asking for ten. A reader following the prose starts counting at publication and never arrives at 2020, however carefully they read.
By now the deadline itself has been stated four different ways in the official record. The appendix says by 2034. The narrative says the next ten years. The executive summary reissued in February 2026 repeats the next ten years. And BL2025-1008, the attainable housing ordinance the Mayor approved on February 5, 2026, recites in its own whereas clause that the strategy “anticipates the need to create 90,000 new homes by 2035.” Four statements of one deadline, they do not agree, and the version the Council recited when it enacted zoning legislation is not the version the appendix computes.
That is not only a framing problem. It changes the number. Appendix B, verbatim: “HR&A applied a 7% vacancy target to household projections to arrive at a total production target of 91,288 total net new homes by 2034. This determined HR&A’s production target of about 9,000 homes annually (rounded), or 45,000 homes by 2030.” Run the division. Across the fourteen years the population increment actually spans, 91,288 is about 6,521 a year. Across ten years it is 9,129, and the 45,000-by-2030 checkpoint works only at nine thousand a year beginning in 2025. The total is computed over fourteen years and annualized over ten, which puts the annual production figure quoted in hearing after hearing nearly forty percent above what the strategy’s own total supports. It forks, and both branches lead somewhere unwelcome. If the 175,000 is right from 2020, every “9,000 a year” is inflated. If the ten-year annualization is right, the 175,000 double counts the roughly 21,000 residents Davidson added between 2020 and 2024, and the total itself is too high. It cannot be both, and the strategy never says which, because it never names the year the household counting starts. It does name one. Figure 30, page 145, labels the jobs projection 2024 to 2034, and the appendix notes that the federal matrix behind it is a ten-year projection. That is the input the population forecast is built from. The increment it produces, 175,000, reconciles only against 2020.


Unified Housing Strategy, Appendix B, pages 144 and 146, operative lines highlighted.
A note on rulers, because everything below depends on it. The 388,000 is a level: a count of what is standing at one moment, the way a photograph counts what is in the frame. The 90,000 is a flow: the amount added across the fourteen years it takes to get there, the way a water meter counts what passed through. A photograph and a meter reading are both true, and they are not the same measurement, which is why the two are never subtracted from one another. Section 2 reads the photograph. Section 4 reads the meter. The run-forward test at the end of Section 4 is the one place the two are converted into each other, and the conversion used is the study’s own, not ours. Where a population forecast appears, it is quoted endpoint to endpoint, one 2034 figure against another, because that is the only comparison immune to which base year a projection happens to start from.
Comments
Nothing yet. Say the first thing.
Sign in to join the conversation.