
AT A GLANCE
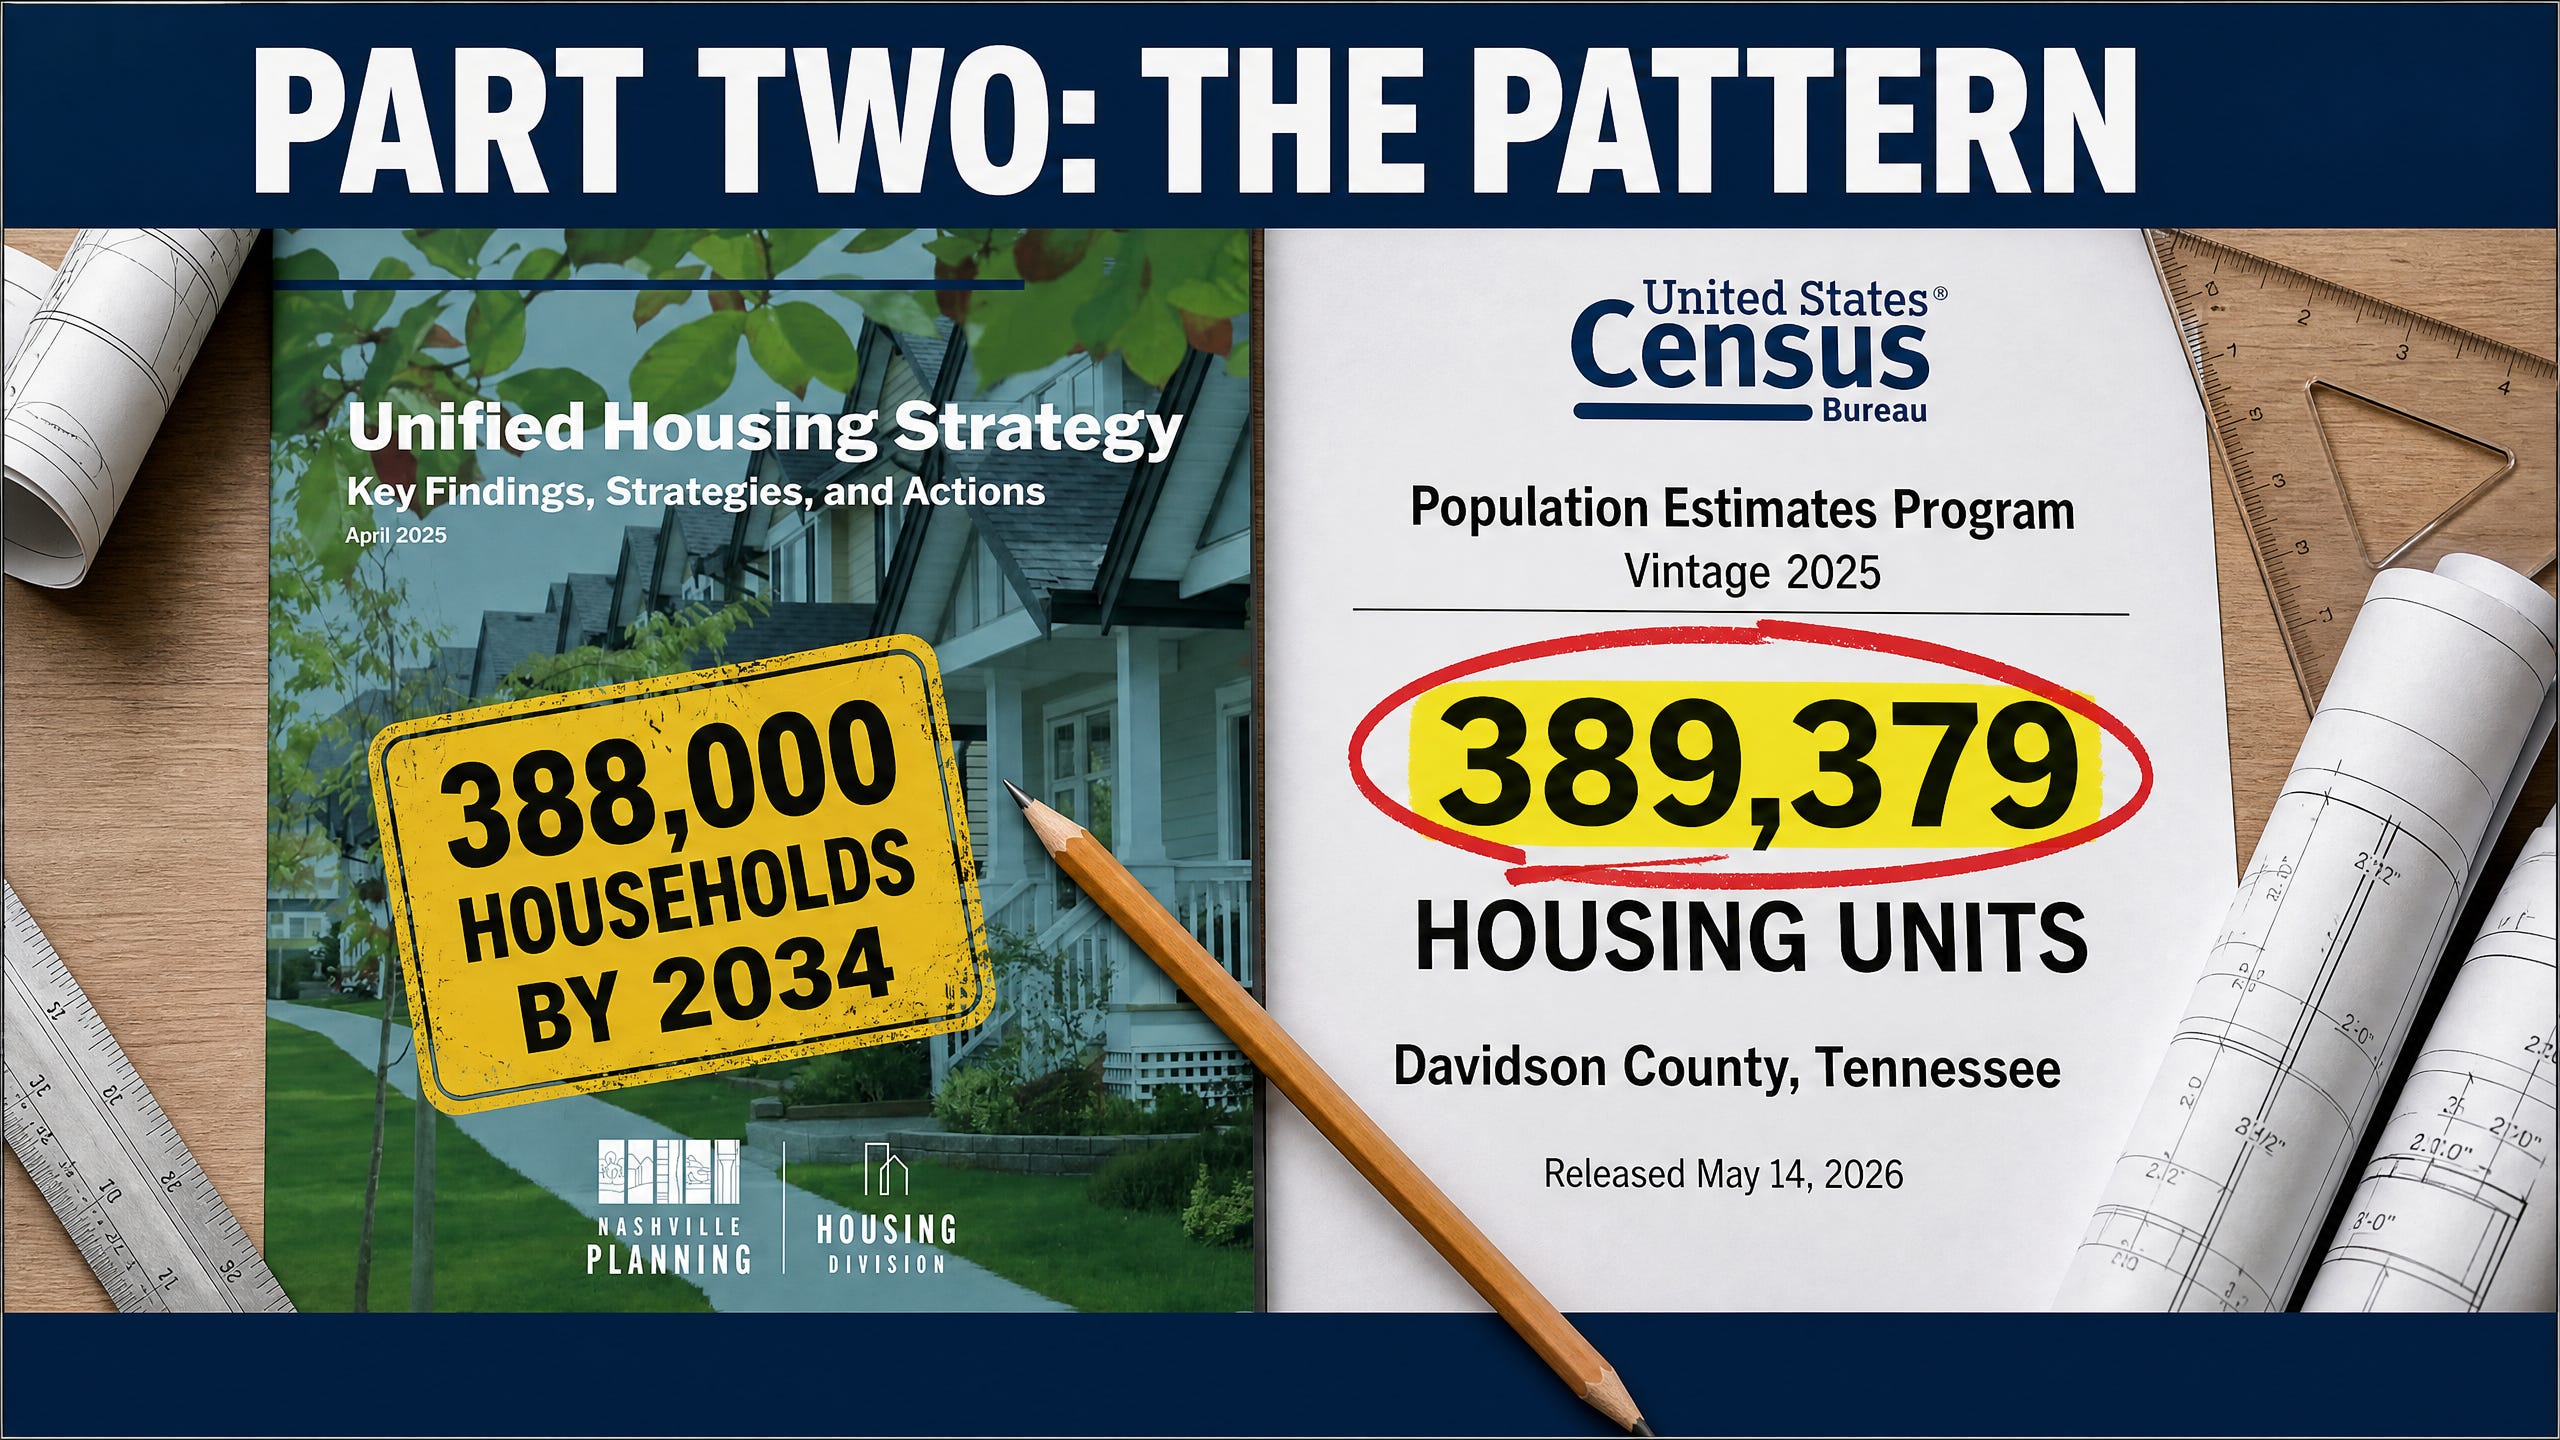
• Part One settled the count: Davidson County already has more housing units standing than the households Metro forecasts for 2034. Part Two answers the question left on the table: how a city talks itself into an emergency its own numbers contradict, and keeps repeating it.
• The answer is a playbook. Eight published steps for dismantling the public’s role in local zoning, from academic blueprints out of the University of Toronto and Harvard, which Nashville has adopted nearly bill by bill, as documented in this publication last October.
• Step one is targets, and the target came first. The state’s official scorekeeper, the UT Boyd Center, puts Davidson County at 790,836 residents in 2034. Metro’s consultant assumed 892,000, using a forecast its own appendix calls “more aggressive.”
• When a resident’s arithmetic cut into the demand estimate last August, Planning’s written response was to double that resident’s own estimate “to move back to the 90,000 unit forecast.” The conclusion was fixed. The inputs were negotiable.
• The claimed construction savings were published in March 2025. In April, Planning confirmed in writing that Metro did not yet have the final pro forma model and would provide it when complete. It has not been provided.
• Upzoning changes how the state taxes the building. The constitution assesses commercial property at 40 percent of value against 25 percent for a home, and state law places any dwelling containing two or more rental units in the commercial class, so the identical structure carries 60 percent more taxable base once it is fully rented. That penalty falls on the rental version of the missing middle, which is what the new districts are written to produce. Asked at a Planning Department community meeting last October whether property-tax increases have pushed up rents, Metro’s planner said he would expect so, and then: “It’s not something that we have looked at.”
• The official peer review of the Housing and Infrastructure Study graded whether Nashville followed the missing-middle formula, not whether the formula fits Nashville.
• The full reconstruction runs alongside this piece as Exhibit A, for the paid subscribers who make this work possible: every lever isolated and tested against the county’s own data, and the consultant’s own sheet reproduced row by row.
• Coming soon: the pattern at work in one hearing room, where a neighborhood, its council member, and the professional staff all agreed, and the machine overrode them anyway.
A note on purpose. To support good decision making, this series serves as a peer review (voluntary) of Metro’s housing forecast, conducted in public, with every source named and every page cited. It takes no position on whether any particular program is good policy. It asks one question of all of them: do the numbers behind them hold? A review worth the name also says what not to do, and that lesson sits inside the strategy itself without ever reaching the policy response.
Part One ended on a question and a promise. The question: how does a city talk itself into a 90,000-home emergency that its own census count and its own affordability charts contradict? The promise: the answer has a playbook and a paper trail. Here is both. And the place to start is with an uncomfortable observation about the whole affair. The numbers were never the point. The pattern was.
The playbook
The pattern has a name and a bibliography. The University of Toronto’s School of Cities published the blueprint as “Enabling the Missing Middle”; Harvard’s Joint Center for Housing Studies runs a near-identical version with six reform categories. Merged, they form eight steps, and I walked Nashville’s adoption of them, bill by bill, in this publication last October: set an ambitious housing target, end single-family zoning by legalizing units by right, remove qualifying projects from public hearings, modernize the building codes, strip the site-design rules, fast-track approvals, cut development taxes (public improvement costs), and publish a pattern book of pre-approved plans. Call it the playbook. Every use of that word in this piece means those eight steps. Nashville has adopted nearly every one, among them the RN and RL zone types, the DADU expansion, the adaptive-residential ordinance, the single-stair code change, the voluntary developer bonus program, and a funded pattern book. None of that needs re-arguing here.
One correction to how that list usually gets read. Adopted is not applied. The RN and RL districts are law, but to this author’s knowledge no legislation adopting one for any Nashville neighborhood is yet in place, though some may be progressing. So the change is still ahead of us, and it is narrower and more permanent than “no more hearings.” Rezonings have always come with a hearing, and the one that converts a neighborhood to RN or RL is no exception. What differs is what that rezoning contains. Under the zoning Nashville has always had, a bigger building or change of type such as single family to multifamily required a different zone, so every step up in scale came back for another hearing. RN and RL hold the single house and the multi-unit building inside one zoning type, RN or RL, so once a parcel is adopted, every step up the ordinance such as residential to multifamily is permitted and is approved at the planning department, on staff’s finding that the design standards are met. No Planning Commission vote, no Council vote, no community meeting, and no role for the district council member. The hearing is not eliminated. It is spent.
What is already thinning or biasing the hearing in the meantime is older and quieter. Councilmanic courtesy, under which the council defers to the district member as a matter of ordinary good manners, decides most of this before anyone speaks, alongside community meetings, at both the project application and the district level, whose agendas leave no room for a dissenting question, and a hearing format in which residents get a few minutes at a microphone to answer a staff recommendation written and published so late that there is little time to read it before they arrive. Courtesy protects you when your member agrees with you. It is the whole conversation when they do not. What needs examining, though, is the first step, because the first step is the tell.
Step one, and the tell
Targets come first in the playbook for a reason: the target creates the urgency that carries every later step past its objections. So where did Nashville’s target come from? Not from the state. The UT Boyd Center, Tennessee’s official scorekeeper for population planning, puts Davidson County at 790,836 people in 2034. Metro’s consultant assumed 892,000, built on a jobs model that its own appendix describes, in writing, as “a more aggressive population forecast.” The difference is 101,164 human beings who exist in one spreadsheet and not in the other.
The University of Tennessee’s Neyland Stadium seats 101,915. Every person in Metro’s forecast who is missing from the state’s would fill that stadium and leave 751 seats empty.
And the phantom is not aging well. Measured from today, reaching the consultant’s number requires adding 16,233 people a year, every year, for nine straight years. The county just added 9,281 in a year lifted by an international migration surge that has already fallen by more than half, and the state’s projection calls for about 5,000 a year from here. The target does not just disagree with the census. It disagrees with the pace of reality.
And there is a simpler test, one that needs no outside data at all. The strategy asks for 91,288 net new homes by 2034 and describes that, on its own pages, as “about 9,000 homes annually.” Those two statements do not fit. The population the target rests on is an addition of 175,000 people measured from the 2020 census, not from any later year. Ninety-one thousand homes spread across the fourteen years from 2020 to 2034 is about 6,500 a year. The document computes its total over fourteen years and annualizes it over ten, so the annual figure quoted at hearing after hearing runs nearly forty percent above what the strategy’s own total supports. Either the yearly ask is too high or the total is. The strategy does not say which, because it never states the year it is counting from. And the deadline has since been restated in an enacted ordinance. BL2025-1008, the attainable housing bill the Mayor approved in February, recites the target as 90,000 new homes by 2035, and recites it as the reason for acting. The appendix says 2034. No document has ever said from when.
When the number was challenged
The record shows what happened next. Last August, after my arithmetic put the subsidized share of the demand near 22,500 units, a District 16 resident asked Planning to check the numbers. The written answer, from the manager of the study, reads: “I’m going to double his estimate of 22,512 in subsidized demand to 45,000 (to move back to the 90,000 unit forecast).” That is not the study’s method. It is arithmetic improvised in a reply: my number, derived to size the subsidized share, borrowed back at twice its value so the components would re-sum to a total the city had already published. Read that parenthetical twice. The input was chosen to restore the output. The same email chain concedes, twice, that the commute adjustment behind the forecast “is not explicitly stated in the methodology,” confirmed only in consultant materials the public has never seen. When the number was challenged, the number did not move. The evidence did.
The supporting cast
A pattern needs more than one exhibit. Start with the construction-savings story: the code changes were sold on cost reductions, and the flagship claim, savings of $220,000 to $344,000 per home, went into print in March 2025. When I asked for the model behind it a few weeks later, the written answer was “We don’t have the final pro forma model yet,” with a commitment to provide it once complete. It has not been provided. And there is a limit built into that kind of sheet a reader deserves in advance: a pro forma computes the lowest price at which a builder would agree to build. That is a floor, and a floor is not a price. What a home sells for is set in a market the sheet never enters, and no sale price appears anywhere on it.
The tax story is worse, because this one is on the record. At a Planning Department community meeting last October, a question from the floor asked whether property-tax increases have pushed up rents over the past decade. Metro’s planner answered honestly: he “would expect so,” and then, “it’s not something that we have looked at.” The state constitution assesses commercial property at 40 percent of value against 25 percent for a home, and state law places any dwelling containing two or more rental units in the commercial class, so the identical building carries 60 percent more taxable base the moment it is fully rented. The multiplexes this policy exists to produce land squarely in that class. The cost engine at the center of the affordability promise was never studied by the people making the promise.
The benefit engine fares no better. Presenting to Council, the same staff conceded that filtering, the process by which new expensive homes are supposed to age into affordable ones, “has reversed in Nashville,” with older homes filtering up and becoming more expensive. The strategy then leans on filtering to deliver the benefit anyway.
The safeguard that was supposed to catch it
The Housing and Infrastructure Study cites two outside reviews. The first, a February 2025 memo by Interval LLC, the consultancy of the planning director for Memphis and Shelby County, was scoped to review “barriers and opportunities related to middle-scale housing,” which is to say, how to enable the formula, never whether the formula fits this city’s actual problem as the strategy itself identifies it. It concedes in passing that “displacement is happening today,” then states that the review “does not address the substance of equity, and gentrification.” It never tests the population target. It never checks the shortage against the census. It is a peer review of the recipe that saw the meal, named the harm, and declared the harm out of scope.
The second review, credited only to a national firm, remains unpublished on the city’s open portals. A review scoped to the program’s effectiveness for affordability would test the target against the state’s projection, the shortage against the count, and the affordability promise against the tax code. The first says in its own words that it was not. Whether the second was is not something a reader can check, because it has never been posted. The review Metro did not commission has since been written. You read it in Part One. And it is not new: a version of the same arithmetic reached Metro a year ago, was dismissed as a model the managing planner could not support, and the questions it raised were never worked through. A published study belongs to the body that published it, and answering a documented objection is part of publishing one. No answer has come.
The review that does exist, in full. Exhibit A: Behind the 90,000 publishes alongside this piece for paid subscribers. Every step of the chain reproduced from the appendix pages that hold it. The county’s count, year by year, against the forecast. Four levers isolated and tested one at a time, each one starting from Metro’s own figures and changing exactly one input. The consultant’s feasibility sheet with the rows the published range left out. And a run-forward test that grants Metro every assumption it asked for and still lands on a work plan already running ahead of schedule. If any figure in it fails your replication, write me, and the correction publishes in full.
The whole board
Step back and look at it all at once. A forecast chosen for aggression, the consultant’s word. A demand count frozen at 2020 while the supply model was updated to 2024, erasing four years of building from the need column. A vacancy pad on top. New jobs created in Davidson County counted as if all roads end at the county line. An affordability chart from 2022 carried into an emergency declared in 2025. Tax consequences never examined, by the staff’s own public testimony. A subsidized-demand estimate doubled, in writing, to restore the published total. And a peer review that grades conformance to the playbook rather than fit to the city. Any one of these choices could be defended as a judgment call. But all eight lean the same direction, and choices that all lean one way are not scattered errors. They are a pattern. A pattern that always, reliably, produces the same output: more urgency, more units, more speed, and less scrutiny.
Here is what that costs, and it is Part One's ledger read back. While the machine builds for a phantom stadium, the 15,300 households the study itself counts as genuinely short still wait, because the playbook has no step for them. Those are two different jobs sitting in two different documents. The deep-affordability work belongs to the housing strategy and the subsidy programs. The zoning changes govern new construction, which arrives at the top of the market. Metro's own chart of its housing tools shows the seam: not one of the policy tools reaches the bottom of the income range where the deficit lives. Deep affordability is not produced by aggressive forecasts in a growth city. It is produced by protections, preservation, and subsidy aimed where the deficit actually lives, not by products that, as Part One read from the consultant's own sheet, price at roughly 230 percent of the area median income. I am not against the playbook's authors having ideas. I am against a city grading itself on compliance with them while its own numbers go unread.
There is also a version of this reform done in the right order, and it is worth thirty seconds, because it shows what Nashville skipped. In 2019 Oregon passed statewide renter protections, rent stabilization and just-cause eviction, and legalized middle housing statewide in the same legislative session. Shield first, then supply, as one package. Tennessee moved the opposite direction: by the Unified Housing Strategy’s own account, 2024 state legislation cut the window a tenant can request an eviction delay from fifteen days to seven, one of the shortest in the country. Nashville adopted the supply half of the experiment inside a state running the shield half in reverse. The strategy says on page 44 that supply without protections drives displacement. It was describing its own operating conditions.
One acknowledgment before the close, because fairness requires it. There is a place where the city is aiming at the deficit: the East Bank. On Metro-owned land beside the new stadium, a negotiated planned community will carry hundreds of income-restricted homes priced mostly below 60 percent of area median income and held there by 99-year ground leases, with the first 323 units already under construction. It is a completely different kind of project, a full plan delivering the deed-restricted housing the Unified Housing Strategy itself calls for, not a by-right permit. My research there has only begun, and it has earned a future paper of its own. For now, the observation that matters: when Nashville actually houses the people in the deficit, it does it with a plan, public land, and covenants. The playbook contains none of the three.
Ahead in this series
The pattern leaves the spreadsheets and walks into a hearing room. A neighborhood asked for a modest protective overlay. The professional planning staff studied it for a year and recommended approval. The elected council member stood with her constituents. And the machine overrode all of them, in public, on the record, in a way that raised the bar for the community’s survival to a supermajority. Watch the move. It will teach you more about who is conducting than any org chart ever could.
Until then, the question from Part One still stands, sharper now.
Who is representing the community?
New here? Start with Part One. “More Homes Than Households: Nashville Already Passed Metro’s 2034 Forecast” (link above) is the count, free to every reader, and this piece is the pattern that produced it.
Publishing 8-17-2026 Exhibit A: Behind the 90,000 is the working file underneath both, for paid subscribers. Free readers get every finding. Paid readers get the arithmetic, and they are the reason the arithmetic gets done.
Make sense of the decisions shaping our places, communities, and daily lives. Subscribe to receive new Built to Think essays and support independent civic writing.
Thanks for reading! This post is public so feel free to share it.
Article Source Note. Sources for Part Two: “The Nashville Housing Hustle: Unpacking the Missing Middle Playbook, Part II” (Built to Think, October 2025), which documents the eight steps and Nashville’s implementing legislation, principally BL2025-1005 (the RN and RL zones and their by-right framework), BL2024-559 (DADU expansion), BL2024-187 (adaptive residential), BL2025-898 (single-stair egress), BL2025-1008 (the voluntary attainable housing incentive), and RS2024-234 (pattern book funding); the University of Toronto School of Cities, “Enabling the Missing Middle” (November 2024); Harvard Joint Center for Housing Studies, “Unlocking the Missing Middle” series (2025); UT Boyd Center 2022–2070 Population Projections, Davidson County, released August 7, 2024 and superseding the 2020–2070 series of March 2022, accessed this week; Metro’s Unified Housing Strategy, Appendix B, pages 144 through 146; the Housing and Infrastructure Study, page 33, and its Appendix 4, the Interval LLC “Peer Advisor Memorandum: Middle-Scale Housing Policy Review” (February 20, 2025); the East Bank Master Development Agreement record (BL2024-258) and Metro’s East Bank affordable housing announcements; U.S. Census Bureau Vintage 2025 estimates; the August 2025 email record between Metro Planning and District 16 residents, in the author’s possession and quoted verbatim, and the April 2025 pro forma correspondence from the same record; the March 24, 2025 joint committee presentation to Metro Council; Oregon Senate Bill 608 and House Bill 2001 (2019); Unified Housing Strategy page 44 on the 2024 eviction-window change; and Metro Planning’s community meeting of October 27, 2025 at James Lawson High School, reported by Megan Podsiedlik in The Pamphleteer, “War Zone III: Shut Up and Talk,” October 28, 2025. The full reconstruction, with every lever isolated and tested one at a time, is in Exhibit A: Behind the 90,000, for paid subscribers.
About Built to Think · Chris Remke
Built to Think is a working laboratory for civic sensemaking, founded by Chris Remke, RA (Lic. Ret.). It follows evidence across the full life cycle of place-building, from public promises and development rights through finance, design, construction, operations, market price, infrastructure, taxation, and neighborhood life. Drawing on more than forty years of leadership across those disciplines, Chris tests whether promised outcomes survive the handoffs, who creates and captures value, who carries the costs, and what each decision preserves, consumes, or leaves others obligated to repair. The work is strengthened by professionals, scholars, nonprofit leaders, and neighborhood stewards whose knowledge helps reveal what no single report, dataset, or discipline can see alone.
Built to Think follows not only what a decision says, but what it sets in motion.
Original text and analysis © 2026 Chris Remke, Built to Think. Quotation with attribution and a link is welcome and encouraged. Republication in whole or in substantial part, in any medium, requires written permission. Material quoted or reproduced from government documents is cited in full and remains the property of its sources.
Decode the City. Stay Informed.

click image
Comments
Nothing yet. Say the first thing.
Sign in to join the conversation.