
In today’s lesson, we will review discounted cash flow models and how they can be used to value companies.
Remember, as discussed in a previous lesson, it’s important to identify what stage a company is in the Business Growth Cycle before determining the best method to value that company.
Discounted cash flow models can be tremendously helpful for companies in Stage 5, or the Capital Return phase, but are not nearly as helpful for companies in other stages.
Once you’ve determined that a company is in the capital return phase, you can then move on to building your discounted cash flow model.
Discounted Cash Flow Overview
Discounted cash flows value a company by projecting cash flows into the future by a specific number of years.
That value is multiplied by an exit multiple (e.g., P/E or P/FCF ratio) that you believe the company will trade at the end of that cash flow period.
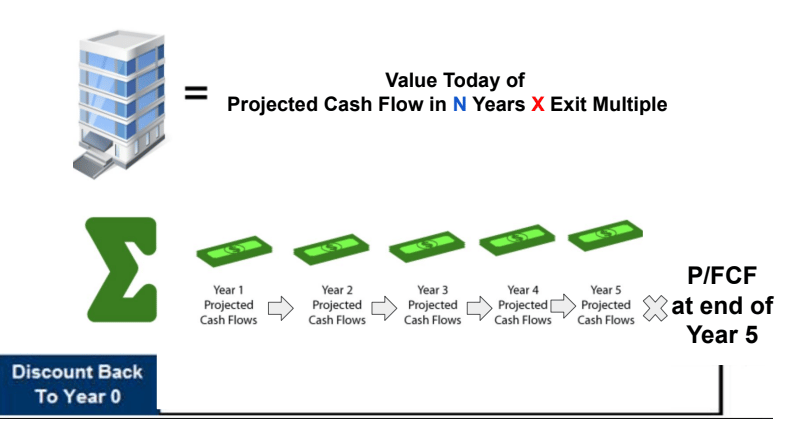
This is one of the simplest forms discounted cash flow models can take, but they can also be much more complex.
For instance, discounted cash flow models can use figures such as total cash flow, net present value, and terminal value instead of exit multiples.
Just as with other forms of valuation, this is a multi-step process.
Shameless promotion: Those who sign up for our Valuation Explained Simply course receive an accompanying tool that automates much of this process. If you’re interested, use the link in the footer to get the course material.
You just walked a full DCF through six steps and put Alphabet through it start to finish. That’s the whole idea here: take one intimidating investing concept each week and make it simple enough to actually use.
If you’re not on the list yet, that’s an easy fix. One lesson like this every week, free.
Yes, send me the weekly lesson
Let’s go over these steps a bit more carefully:
Step 1: Find the company’s trailing twelve-month (TTM) free cash flow.
Using the company’s free cash flow statement, you can calculate free cash flow by subtracting capital expenditures from operating cash flow.
There are also several investment research platforms, such as fiscal.ai, that provide this information. If you need a refresher, review the lesson on the Cash Flow Statement.
Step 2: Estimate the free cash flow growth rate for a specific number of years.
No one knows with certainty how fast a company’s free cash flow will grow over the next five to ten years.
However, analysts who cover companies estimate these growth rates regularly.
This information can be found on the web for free.
For instance, if you enter a company’s ticker in Yahoo! Finance, you can click on the Analysis tab and scroll to the bottom of the page to find analysts’ free cash flow growth rate estimates for any covered stock.
Step 3: Estimate exit multiple.
Again, much of this is guesswork.
We recommend finding the current price-to-free cash flow multiple and using a lower multiple to be conservative.
Step 4: Estimate an appropriate discount rate.
The discount rate is the annual return you wish to realize by owning company shares.
There are many ways to calculate a discount rate, some of which get complex.
As a rule of thumb, the riskier the cash flow is from a company, the higher the rate of return you should demand from owning it.
Conversely, companies that generate more predictable cash flow streams should be expected to produce lower rates of returns.
Here is a very rough guide for finding the proper discount rate:
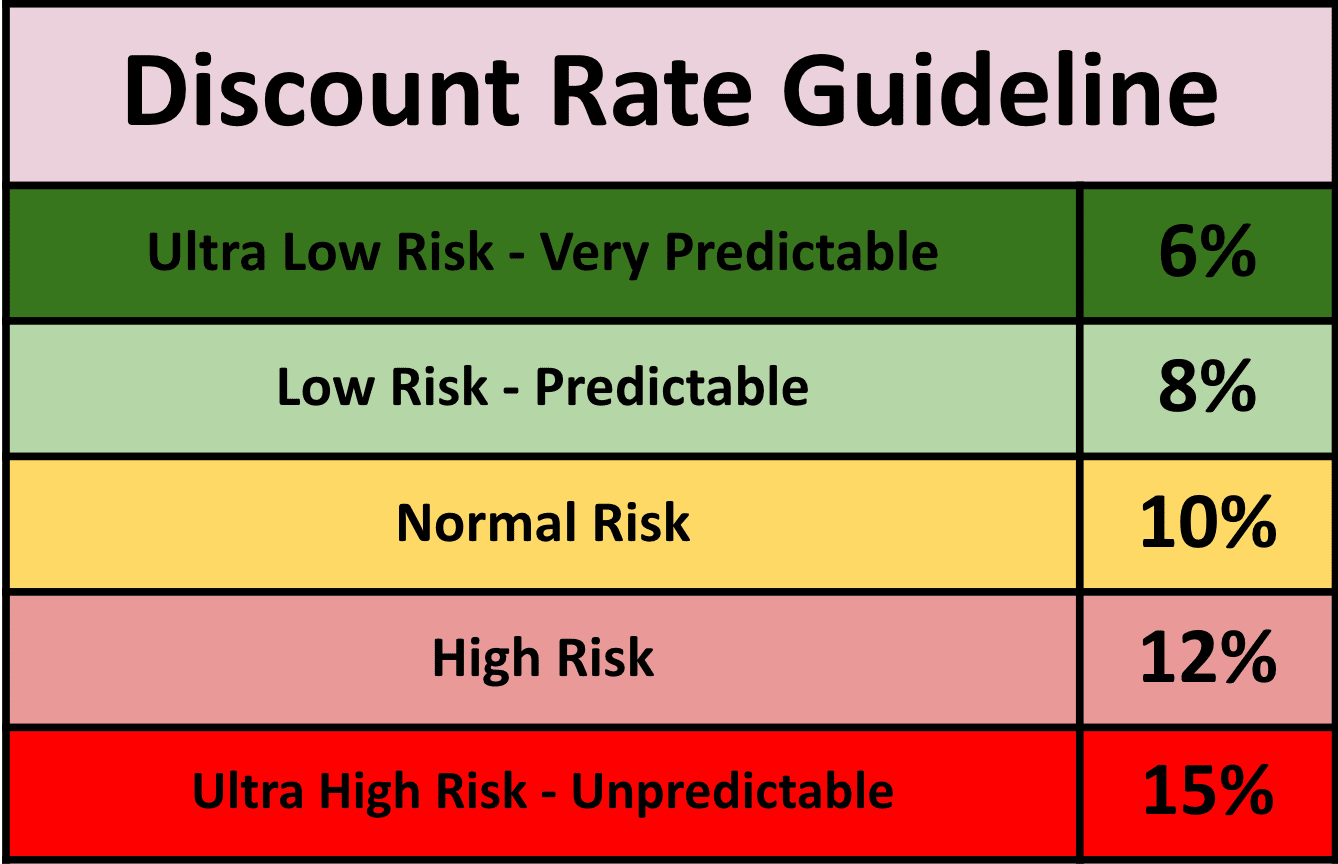
In other words, investors might use an 8% discount rate when valuing Coca-Cola but a 12% discount rate for a hot cybersecurity stock.
Step 5: Bull and bear cases.
As you can see, we’re working with many assumptions when building out a discounted cash flow model. Working in bull and bear cases is essential to see what will happen if these assumptions are off.
This can give investors a much more realistic picture by showing a range of outcomes.
Step 6: Compare to market price.
Once you assign values and make assumptions in the steps above, you have calculated your estimate of the “fair market value” of the stock.
Compare this number to the current share price.
If the stock is below your calculated fair market value, we say the stock is “undervalued” and might be a good time to buy shares.
With these factors, you can now estimate a company’s share price in five years and if the current share price reflects a good enough value to allow you to realize your desired discount rate.
Putting Alphabet Through a DCF Analysis
Let’s use Alphabet as a quick example to see how all these steps come together to determine a fair value for a stock.
Note that these numbers may be dated when you receive this email, but it’s still a good example to walk through.
With just one quarter remaining, Alphabet’s full-year 2023 free cash flow is projected to be $76.6 billion.
Using Yahoo! Finance, we see that its free cash flow is expected to grow at a 17.6% CAGR for the next five years.
Using a compound interest calculator, we see that if Alphabet’s free cash flow grows by 17.6% for the next five years, it will reach approximately $172 billion.
If we assign Alphabet a price-to-free cash flow ratio of 18, we find its share price in 2028 is estimated to be $248.89.
Using a discount rate of 10%, its estimated present value per share is $154.54, about 9% above its current price.
Now, work in bull and bear case outcomes by seeing what Alphabet’s fair value would be if its free cash flow grows more or less than analyst estimates.
This is how analysts use discounted cash flow models to find the fair value for companies.
Next week, we’ll look at the reverse discounted cash flow valuation tool that inverts some of the processes we used here.
Wishing you investing success,
Brian
No posts
Comments
Nothing yet. Say the first thing.
Sign in to join the conversation.