
One of my kids asked me at dinner how you know if a company had a good year.
I said you look at the profit.
Bad answer. I pulled up Meta that night and it took about four minutes to prove me wrong.
Meta’s revenue in 2025 was $201.0 billion. In 2024 it was $164.5 billion. The company added $36.5 billion of sales in twelve months. That’s roughly a Starbucks, bolted on top of what was already there.
Meta’s net income in 2025 was $60.5 billion. In 2024 it was $62.4 billion.
Record revenue. Record operating profit. Lower bottom line.
Net income is the most quoted number on the income statement and the least reliable one. Every line above it is more honest, and each answers a different question.
Meta’s last five years make the case better than I can. Start at the top.
Look at 2022. Revenue fell. Only about 1%, but it fell, and it was the first annual decline in company history.
Revenue is the cleanest line on the whole statement. Hardest to manipulate, easiest to understand. It answers one question: do customers want this?
For Meta, the answer has been yes in four of the last five years.
Cost of revenue is what it costs Meta to deliver the product. Servers, data centers, the people who keep them running.
In 2025 that was $36.2 billion against $201.0 billion of sales. Gross profit of $164.8 billion. A gross margin of 82%.
That number is why software businesses trade where they trade. Meta keeps 82 cents of every dollar before it spends a nickel on overhead. Costco keeps about 13.
Meta’s gross margin has sat between 78% and 82% for five straight years. Boring in the best possible way.
Flat is what you want. A gross margin that drifts down year after year usually means the company is cutting price to hold customers, or the cost to deliver the product is climbing faster than it can charge for it. Both are early warnings. Both show up on this line long before they show up at the bottom of the page.
This is the line that broke Meta in 2022, and it’s the best lesson on the statement.
R&D, sales and marketing, and G&A totaled $48.5 billion in 2021. In 2022 they totaled $62.4 billion.
Revenue went down 1%. Operating expenses went up 29%.
Operating leverage works in both directions. When most of your costs are fixed and revenue ticks down, profit doesn’t tick down with it. Profit falls off a shelf.
In 2022 operating income dropped 38% on a 1% revenue decline. Operating margin went from 40% to 25%.
Then Zuckerberg cut. Headcount, projects, the metaverse budget, all of it. By 2024 the margin was back to 42%.
Operating income is the number I trust most. It’s what the business earns from doing the thing it exists to do, before financing decisions and tax accounting muddy the water.
In 2025 it hit $83.3 billion. Up 20%. Best year the company has ever had.
One thing that number hides, and it’s worth knowing. Meta’s Family of Apps segment (Facebook, Instagram, WhatsApp, Messenger) produced $102.5 billion of operating income in 2025. Total company operating income was $83.3 billion.
The $19.2 billion difference is Reality Labs, which generated $2.2 billion of revenue and lost $19.2 billion trying. That’s roughly nine dollars burned for every dollar collected.
You can argue that’s a smart bet on the next platform. You can argue it’s the most expensive hobby in corporate history. Either way, the consolidated income statement doesn’t tell you it’s happening. The segment note does.
So how does the bottom line go down?
Meta’s provision for income taxes in 2024 was $8.3 billion. An effective rate of 12%.
In 2025 it was $25.5 billion. An effective rate of 30%.
That’s $17.2 billion of extra tax expense in a year the business earned $13.9 billion more from operations.
The 12% rate was the anomaly, not the 30%. But if you lined up the two bottom lines and stopped there, you’d conclude Meta got worse in a year it got substantially better.
That is the entire argument for reading down instead of jumping to the end.
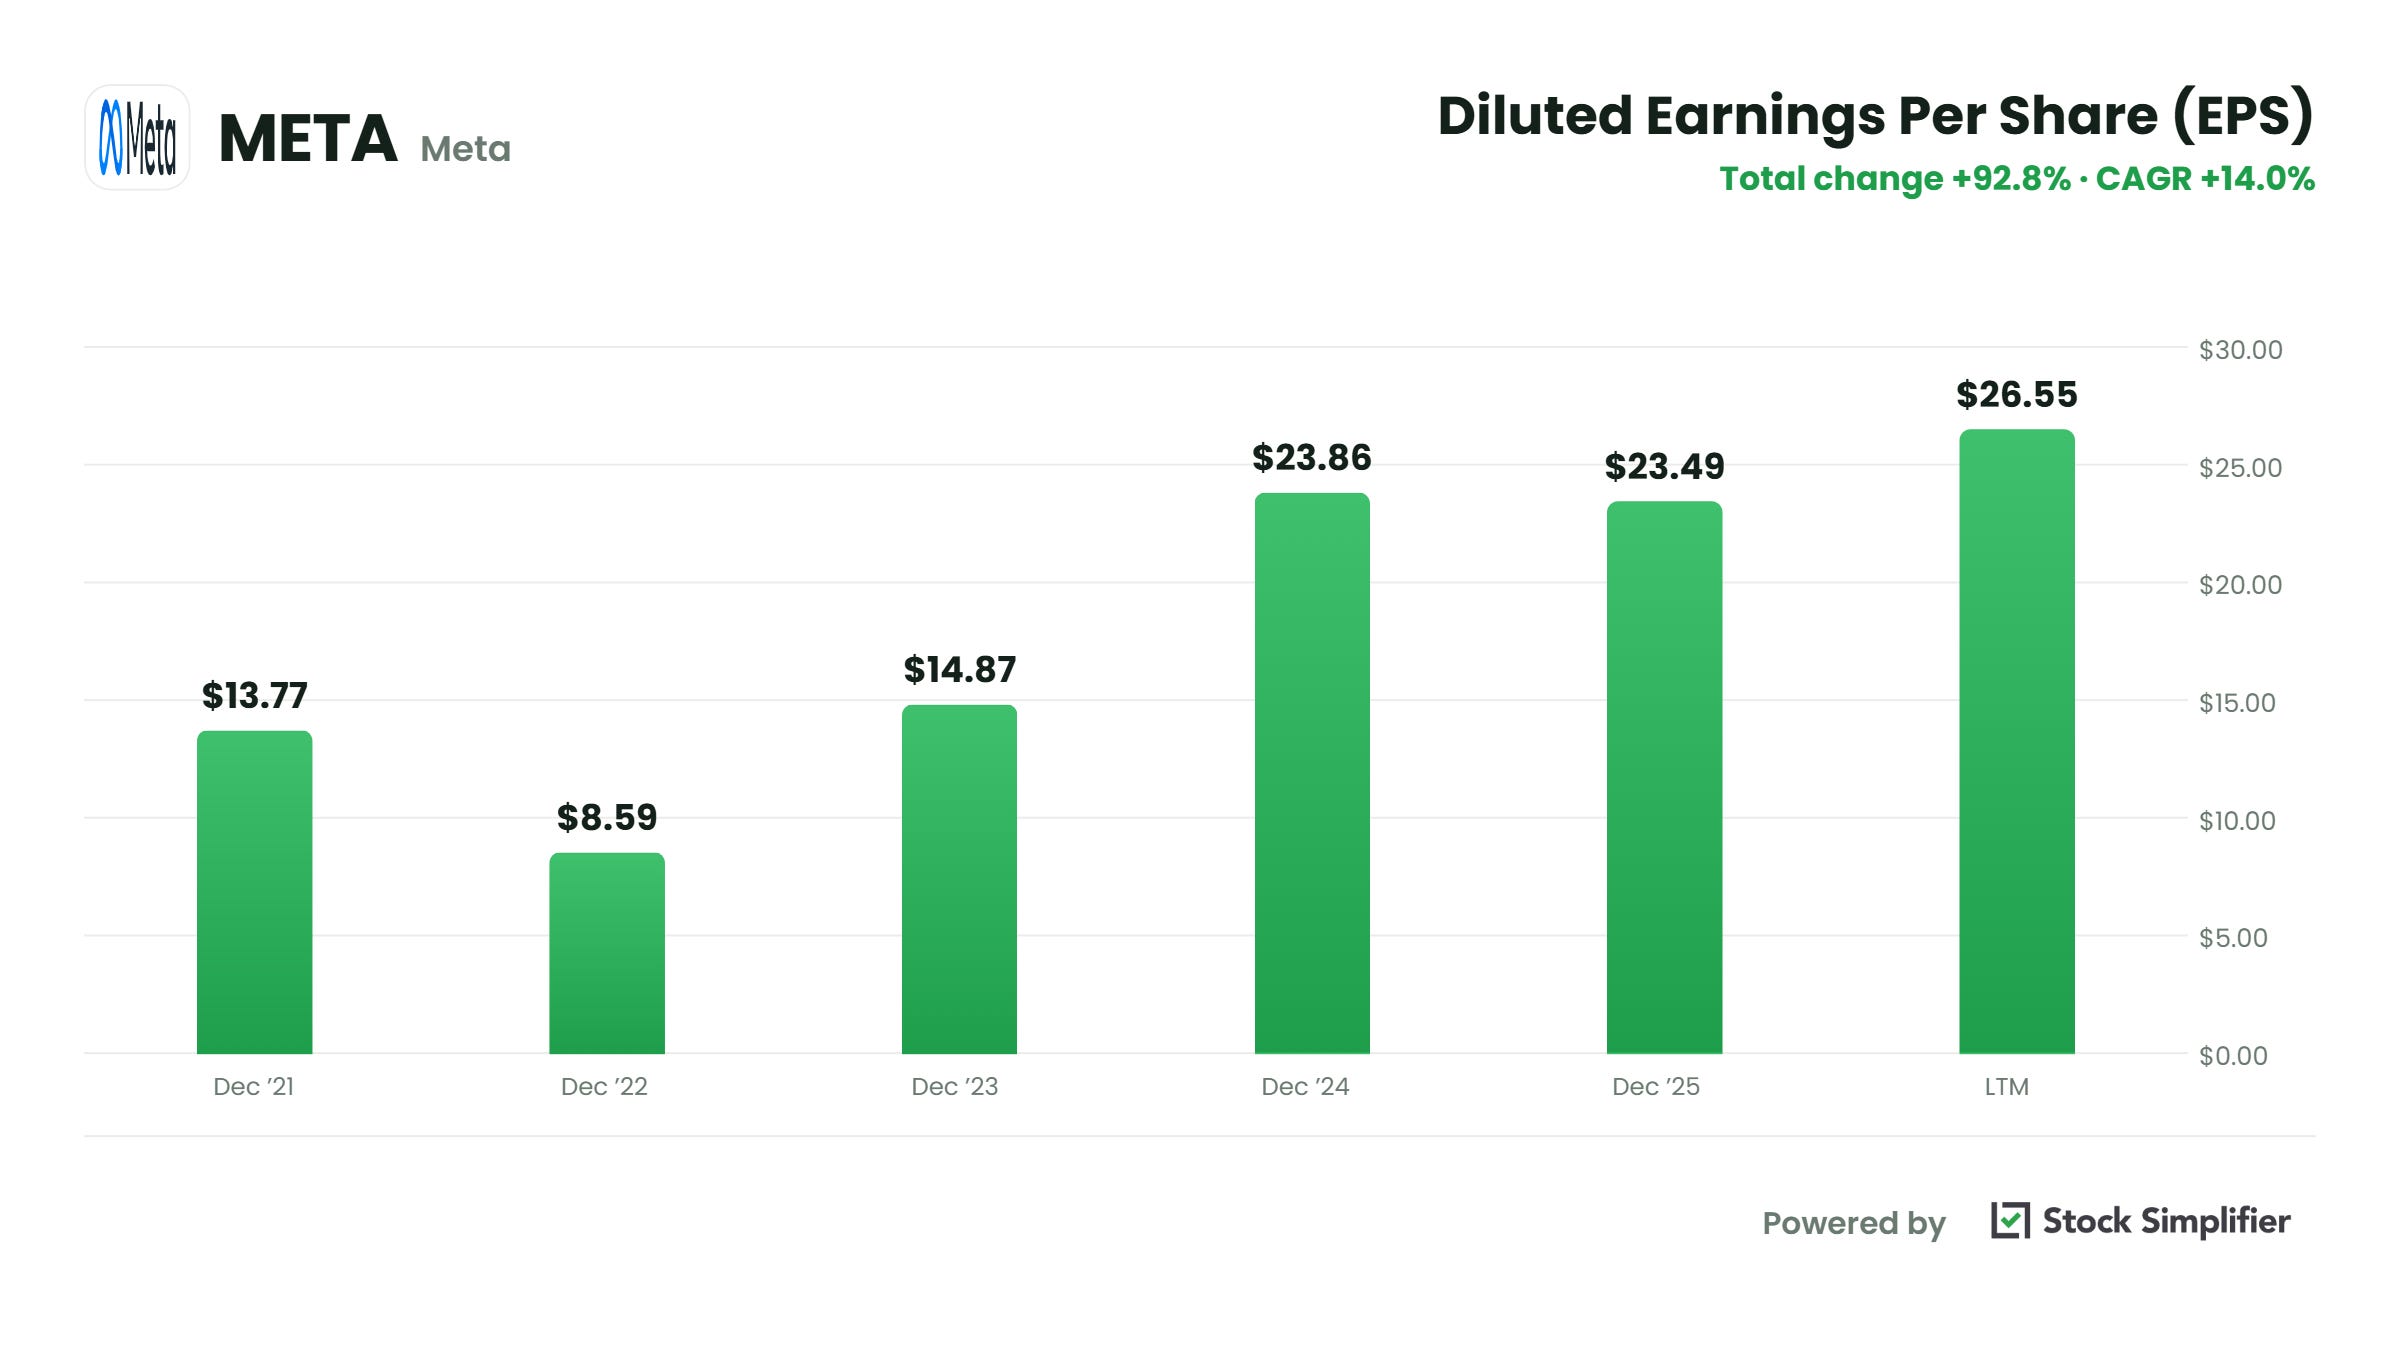
Net income fell 3% in 2025. Earnings per share fell 1.6%, from $23.86 to $23.49.
The gap is share count. Meta’s diluted share count went from 2,614 million to 2,574 million, because the company spent $26.2 billion buying back its own stock.
Stretch it across five years and it gets louder. Net income is up 54% since 2021. EPS is up 71%.
Same profits. Fewer owners.
EPS is the only line that accounts for how many people you’re splitting the pie with. If I could keep one number, I’d keep that one.
The honest answer to my kid’s question is that there isn’t one number.
There’s a funnel. Revenue asks whether anyone is buying. Gross margin asks what kind of business you own. Operating income asks whether the core engine works. EPS asks what’s actually yours.
Net income sits in the middle of all that, and in 2025 it was the least informative line Meta printed.
Pick one company you own. Don’t pull the whole statement. Just put revenue and operating income side by side, five years. If those two lines are heading in different directions, you’ve found something worth an hour of your time.
Wishing you investing success,
Brian
No posts
Comments
Nothing yet. Say the first thing.
Sign in to join the conversation.