
The 4 balance sheet ratios I check before I trust a company
My daughter asked me a question at breakfast.
“How do you know if a company is going to be okay?”
She’s 11. She was asking about a lemonade stand.
But it’s the same question I ask about every stock I own. Can this business survive a bad year? Or is it one slow stretch away from real trouble?
The income statement won’t answer that. Revenue and profit can look wonderful right up until the day a company runs out of cash.
The balance sheet answers it. And you can read the important parts in about 2 minutes with 4 ratios.
I’ll walk through all 4 using Microsoft. Real numbers, from the quarter that ended December 31, 2025.
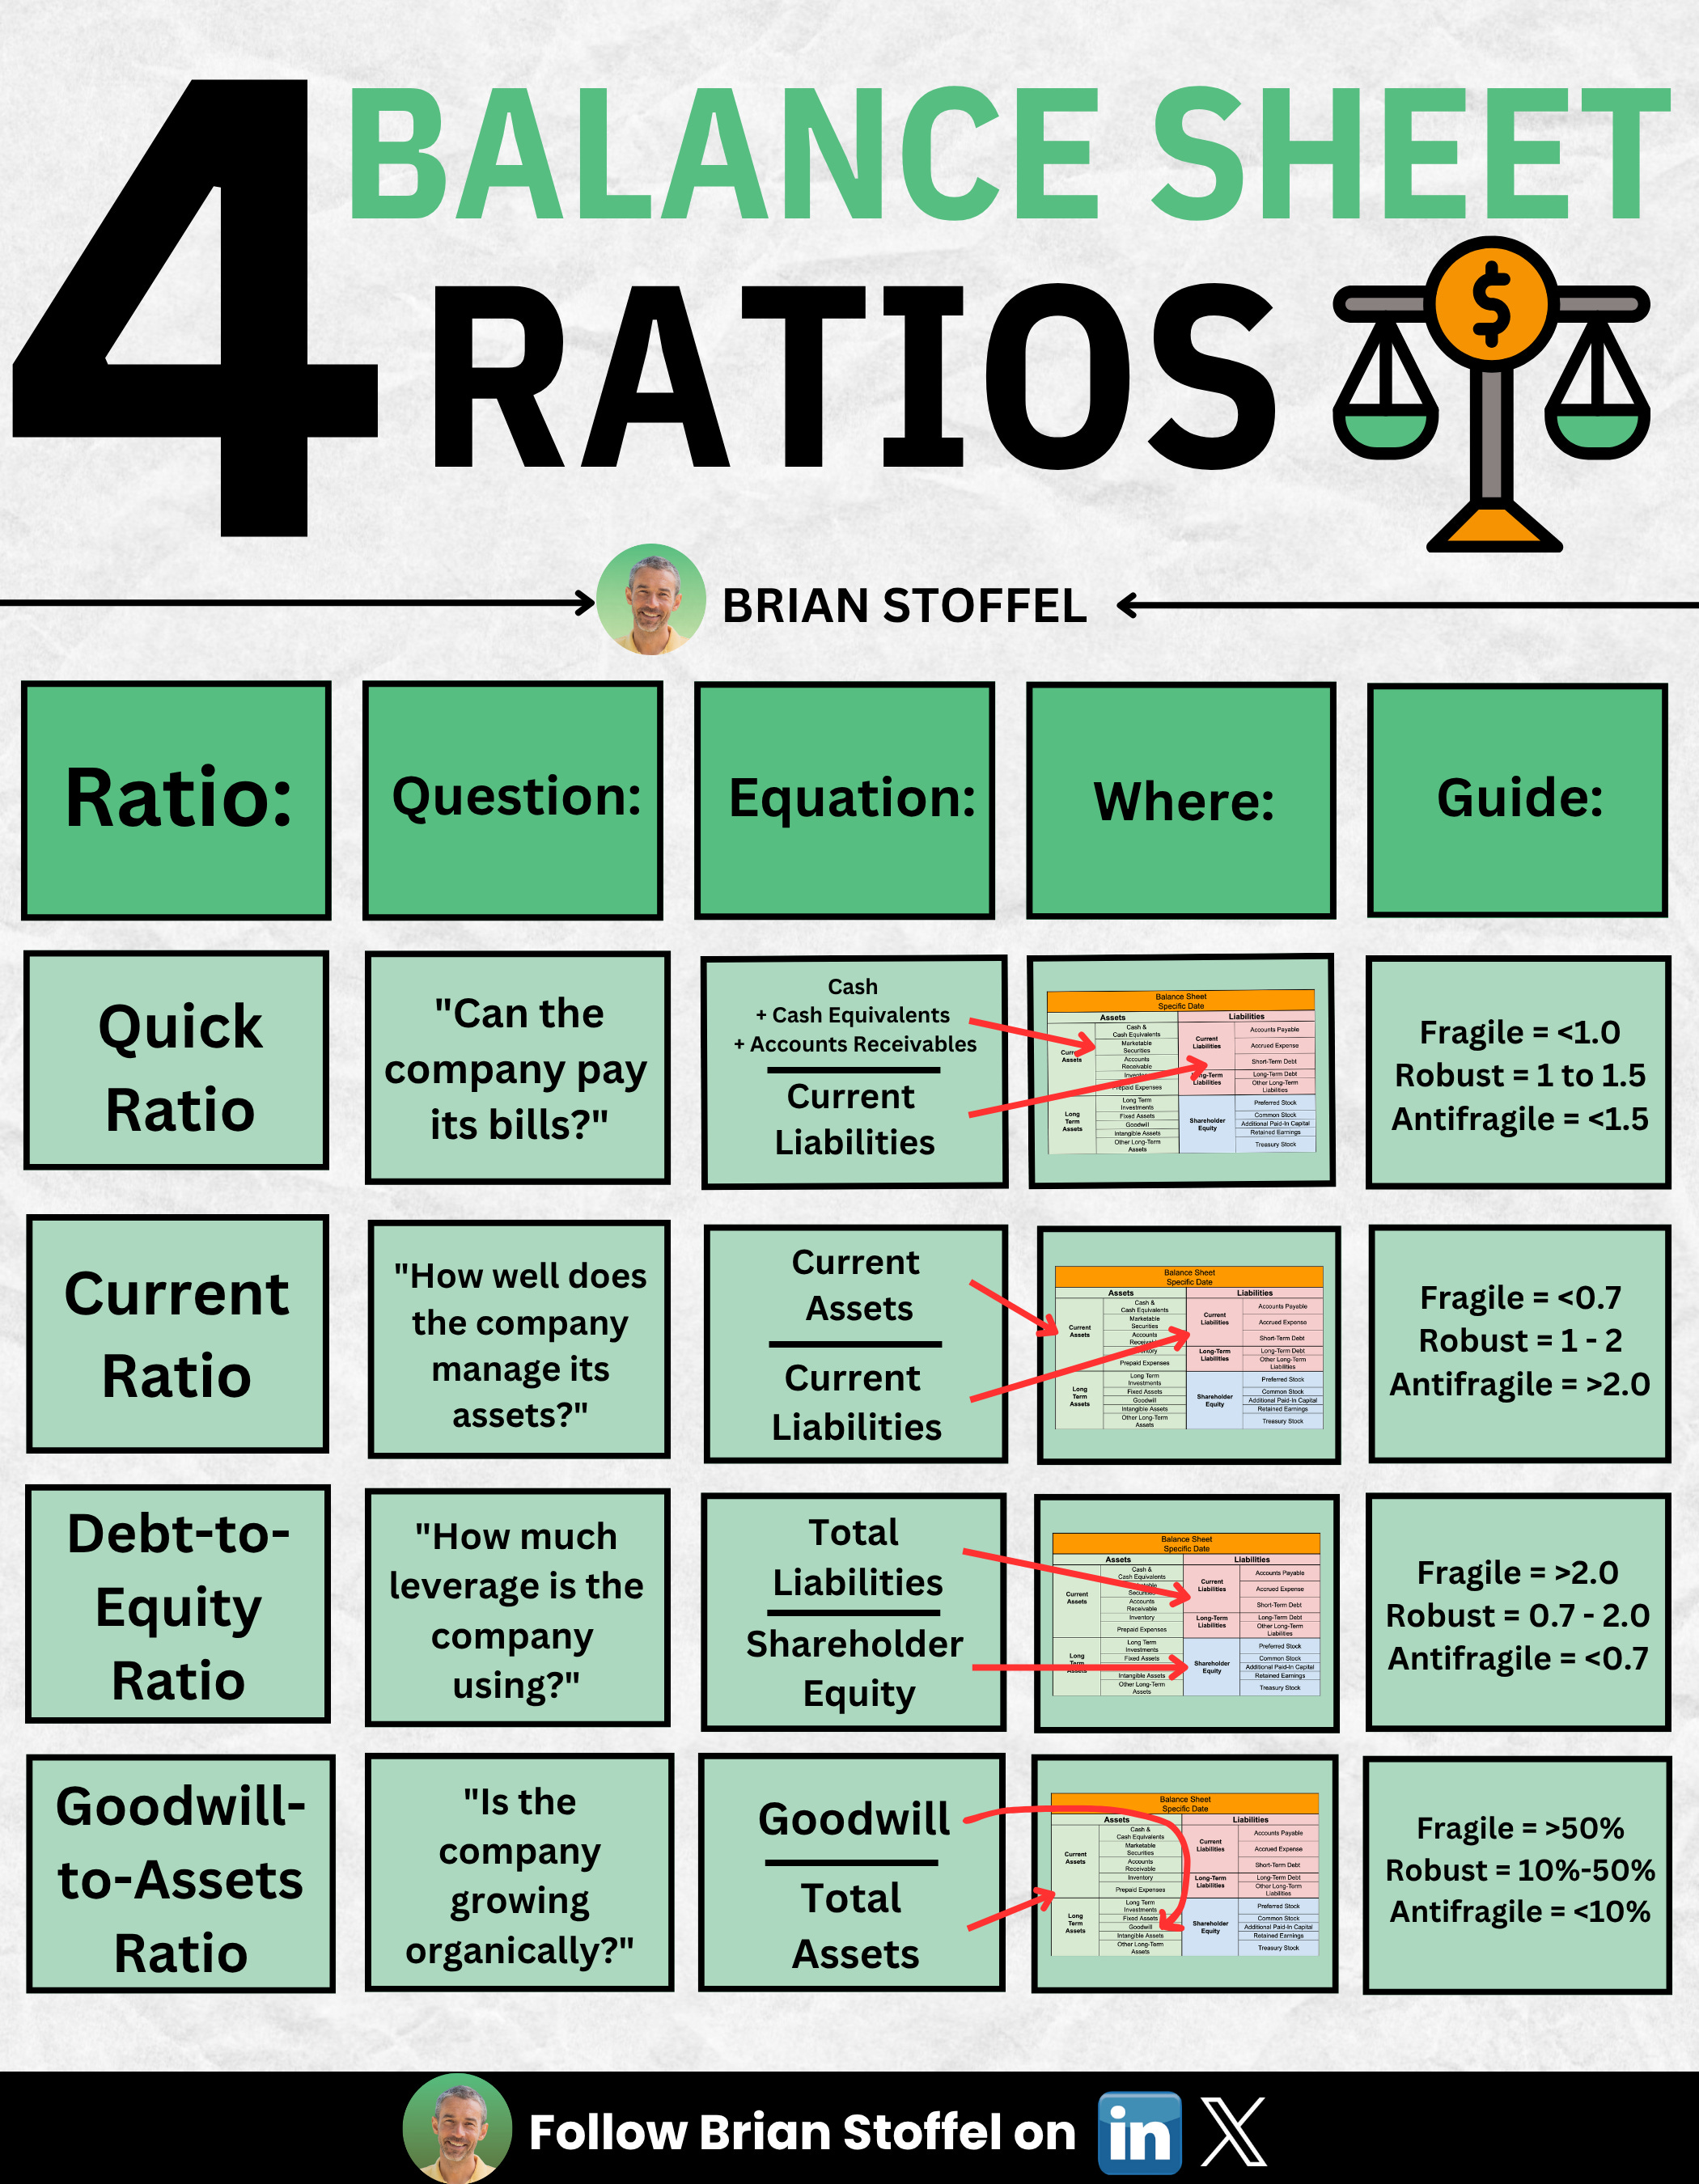
1. Quick ratio: can it pay its bills?
Take the assets a company can turn into cash fast. Cash, short-term investments, and money customers already owe. Divide by the bills due within a year.
Microsoft’s near-cash: $24.3 billion in cash, $65.2 billion in short-term investments, and $56.5 billion in receivables. About $146 billion.
Bills due within a year: $130 billion.
Quick ratio: 1.12.
Anything above 1 means the company could pay every short-term bill without selling a single product. Microsoft clears it.
One note. The textbook version of this ratio leaves out short-term investments. For most companies, fine. For Microsoft, no. That $65 billion sits mostly in government bonds. It’s as good as cash. So I count it.
2. Current ratio: widen the net
Same idea, bigger scoop. Every current asset over every current bill.
Current assets: $180 billion. Current liabilities: $130 billion. Current ratio: 1.39.
Comfortable. Under 1 is where I start asking questions. Under 0.7 is where I get nervous.
3. Debt-to-equity: how much leverage?
Total liabilities divided by shareholder equity.
Microsoft owes $274 billion. Owners have $391 billion in the business. Debt-to-equity: 0.70.
For every dollar the owners have in, the company owes 70 cents. That’s conservative for a business this size.
Debt cuts both ways. It juices returns in good years and sinks companies in bad ones. I’ve watched profitable businesses die because they borrowed too much and the timing went against them. Microsoft isn’t reaching here.
4. Goodwill-to-assets: built or bought?
Goodwill is the premium a company pays over book value when it buys another company. A little is normal. A lot tells you the growth came from the checkbook, not the factory.
Microsoft’s goodwill: $119.6 billion. Total assets: $665 billion. That’s 18%.
This is the interesting one.
In June 2023, Microsoft’s goodwill was $67.9 billion. A year later it was $119.2 billion. It nearly doubled.
What happened? Activision Blizzard. Microsoft paid about $69 billion for the maker of Call of Duty, and roughly $51 billion of that landed on the balance sheet as goodwill.
18% is not a red flag. Under 50% is fine by me. But it’s a reminder. A real slice of Microsoft’s growth over the years was bought, not built. LinkedIn. Nuance. Activision. If a big deal ever sours, the goodwill gets written down, and writedowns land straight on earnings.
The report card
Four numbers. Two minutes. Here’s how Microsoft scores:
Quick ratio: 1.12. Fine.
Current ratio: 1.39. Fine.
Debt-to-equity: 0.70. Conservative.
Goodwill-to-assets: 18%. Worth watching, not worth worrying about.
Nassim Taleb has a scale I keep in my head for this: fragile, robust, antifragile. Fragile breaks under stress. Robust survives it. Antifragile gets stronger from it. On its balance sheet, Microsoft lands solidly in the middle. It won’t break in a downturn. It’s built to take the hit.
Notice what these 4 ratios are not. They’re not a valuation. A rock-solid balance sheet tells you a company can survive. It says nothing about whether the stock is cheap. Those are two different questions, and people mix them up constantly.
Back to the lemonade stand.
My daughter’s question was never really about lemons. She was asking whether the thing had enough cushion to make it through a slow week. That’s the whole job of a balance sheet. Whether it’s an 11-year-old’s card table or a company sitting on $665 billion in assets, the math is the same.
Pick one stock you own. Run these 4 numbers. Takes 2 minutes. You’ll understand its staying power better than most people who own it.
Wishing you investing success,
Brian
Comments
Nothing yet. Say the first thing.
Sign in to join the conversation.