
Meta generated $124 billion in operating cash flow over the last twelve months.
I had to check that number twice.
That’s more cash from operations, in one year, than most great companies produce in a decade. And it flows through a single app family that a billion people open out of habit.
Here’s what took me too long to learn. Net income can be massaged. Earnings per share can be engineered. Cash flow is much harder to fake. It’s the closest thing to truth on a financial statement.
So I stopped starting with the income statement. I start with cash.
Below are 7 cash flow ratios I run on any business. I’m going to walk each one through Meta’s most recent numbers so you can see how they actually work. All figures come from Meta’s Q1 2026 10-Q and full-year 2025 report. Flow numbers are trailing twelve months (April 2025 through March 2026). Balance sheet numbers are as of March 31, 2026.
Grab your coffee. Let’s run the company.
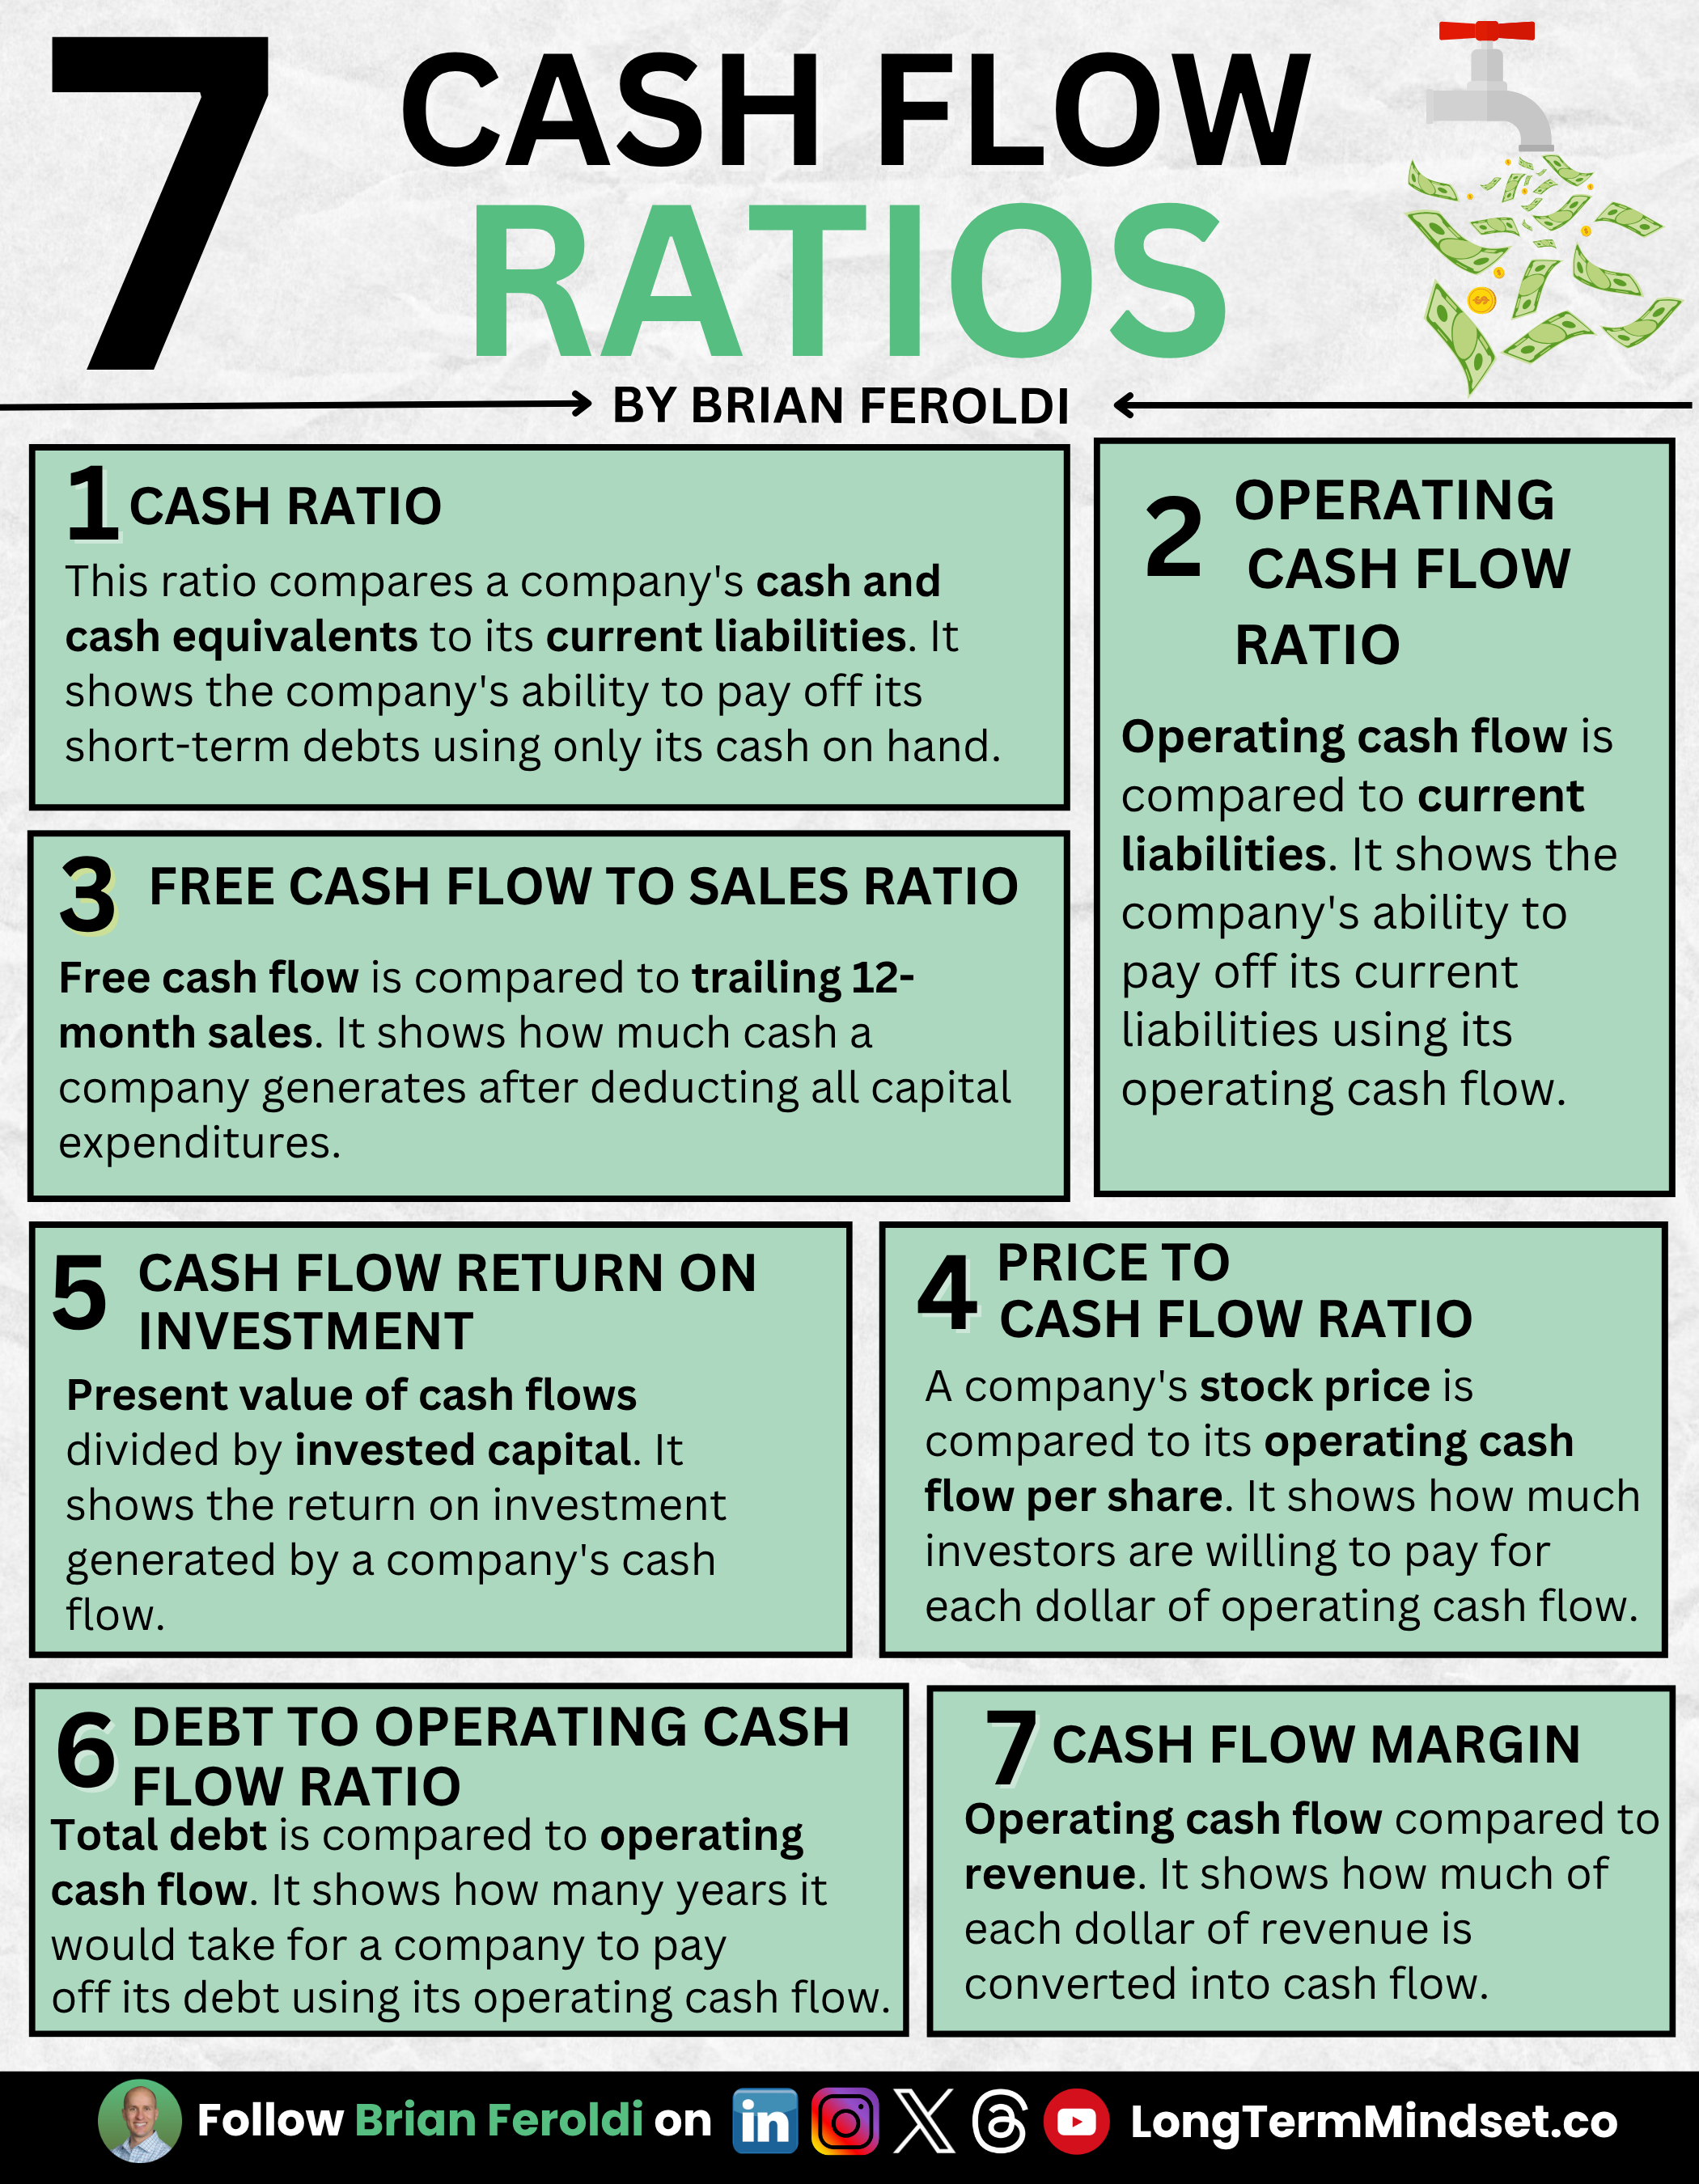
Cash and cash equivalents divided by current liabilities. It answers one blunt question: if the bills came due today, could you pay them with cash on hand?
Meta held $23.4 billion in cash and equivalents against $46.8 billion in current liabilities.
Cash ratio: 0.50.
At a glance, that looks tight. It isn’t. Meta parks most of its liquidity in marketable securities, another $57.8 billion. Add those in and the picture flips to 1.74. The lesson: the cash ratio is the most conservative liquidity test there is, and it often undersells a company that keeps its money in short-term bonds instead of a checking account. Read it, then check what’s sitting one line below.
Operating cash flow divided by current liabilities. Same question as the cash ratio, better answer. It asks whether the cash the business actually produces can cover its short-term obligations.
Meta’s trailing operating cash flow was $124 billion. Current liabilities were $46.8 billion.
Operating cash flow ratio: 2.65.
Meta’s engine throws off enough cash to clear every short-term bill more than two and a half times over, every single year. Anything above 1 is healthy. Meta is not sweating its rent.
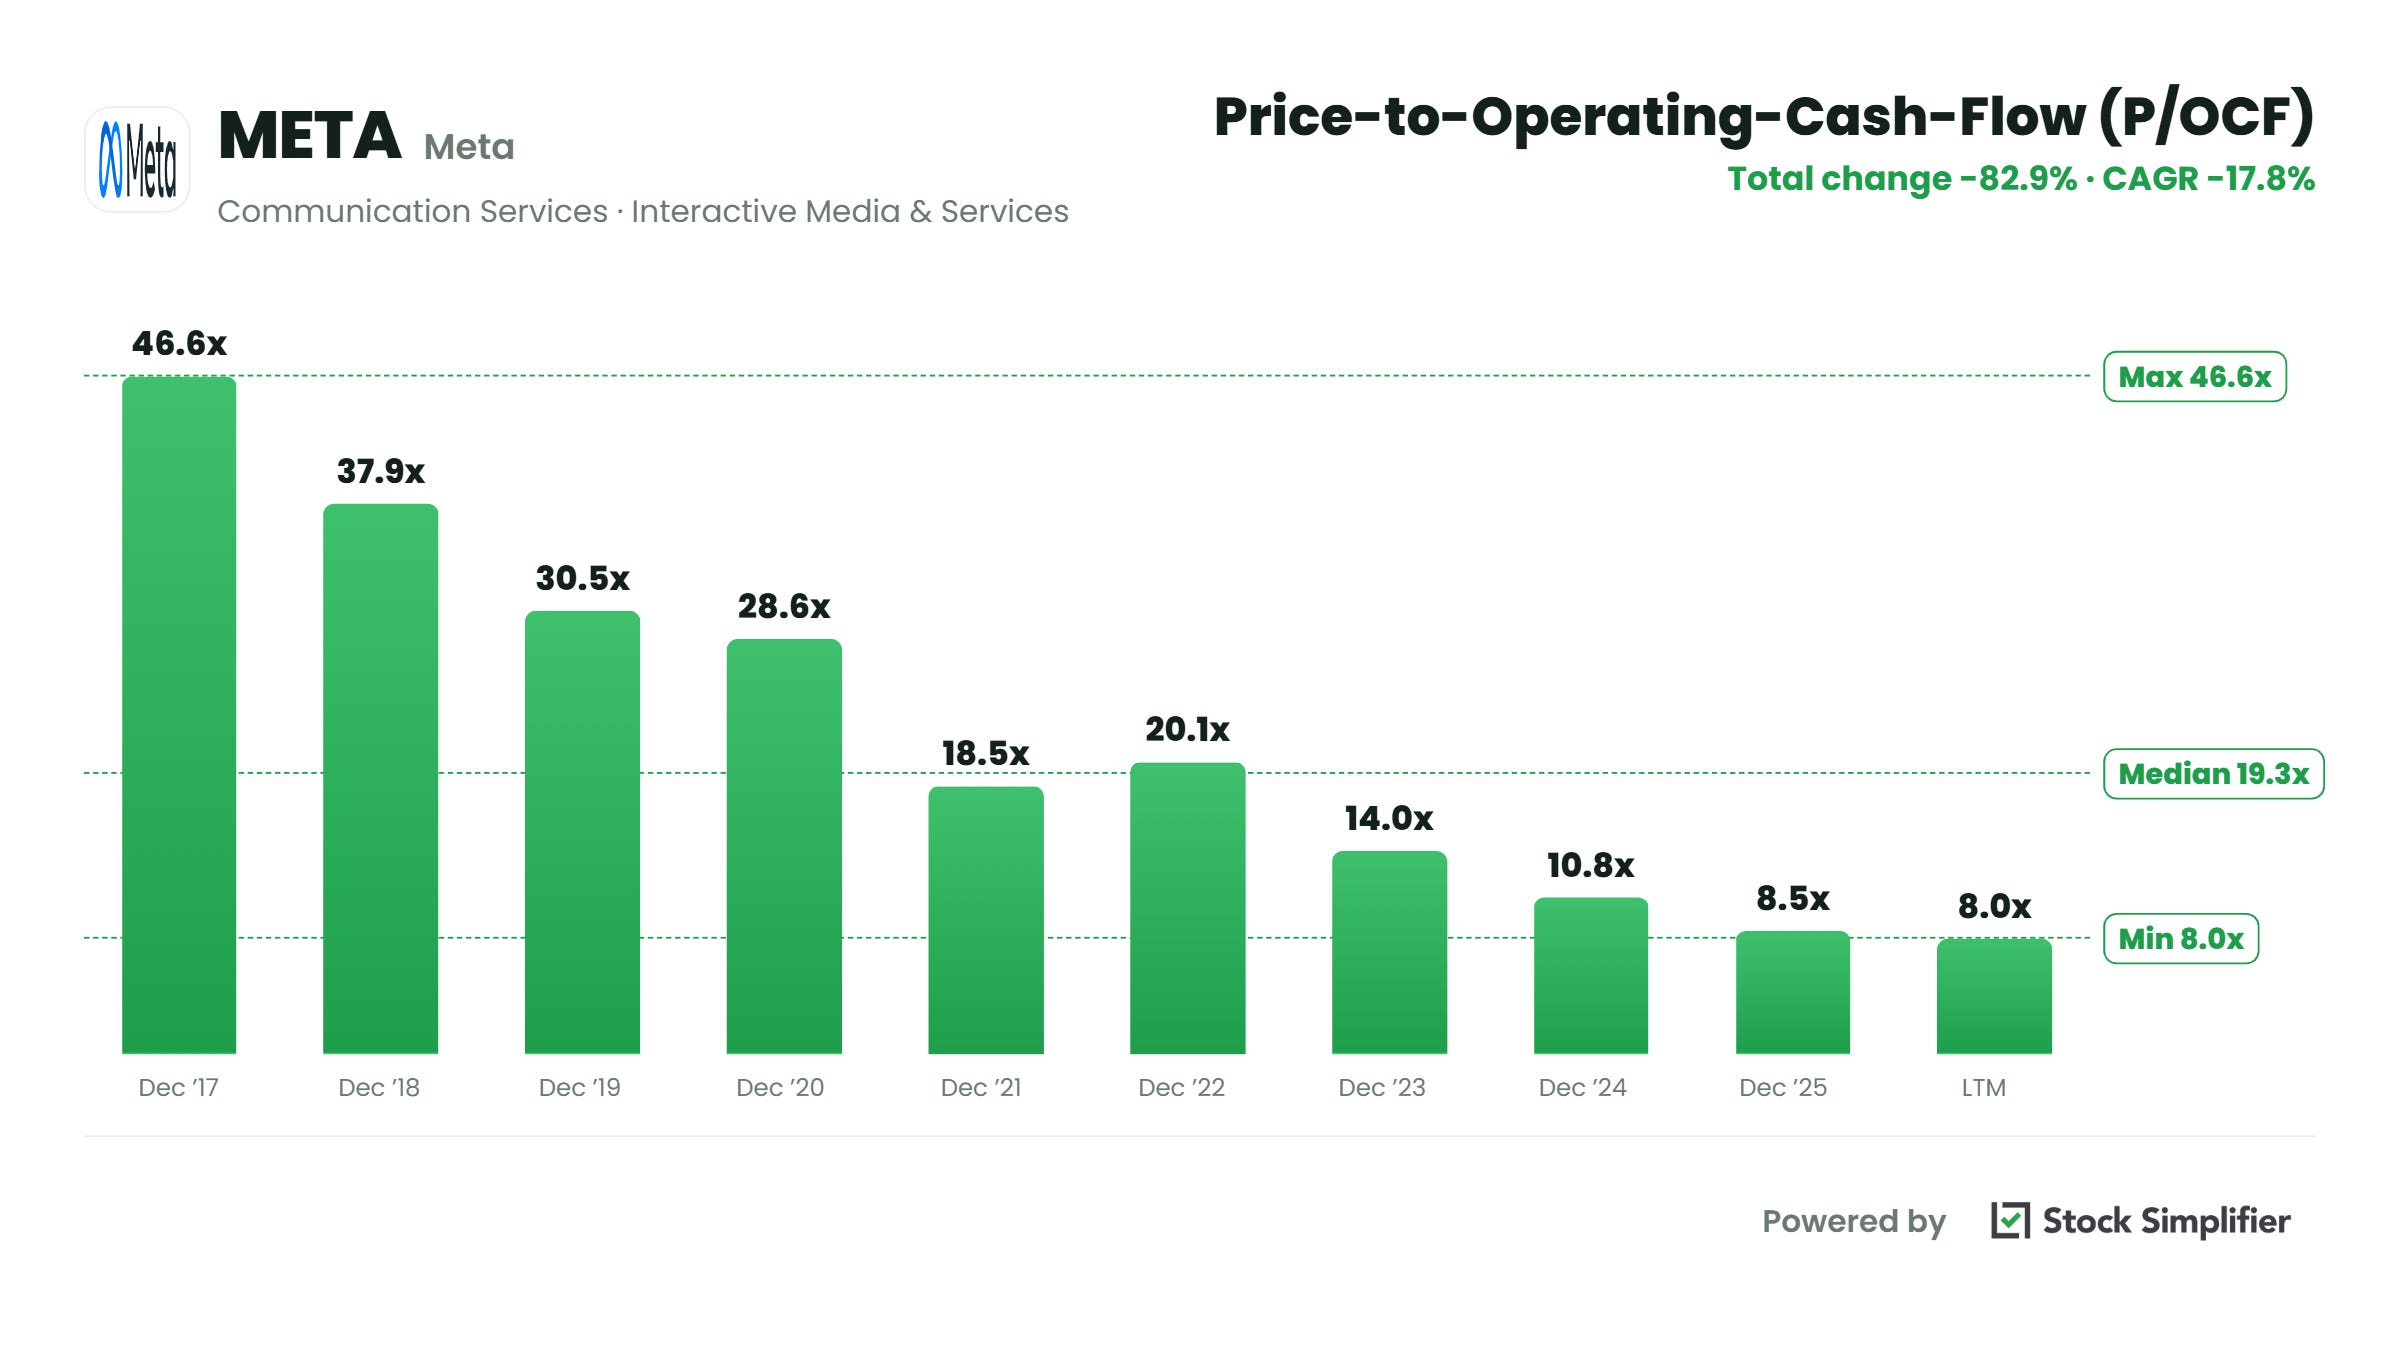
Free cash flow divided by trailing revenue. Free cash flow is what’s left after the company pays for the property, equipment, and data centers it needs to keep running.
This is the one I want you to sit with.
Meta’s trailing free cash flow was $45.6 billion on $215 billion in revenue.
Free cash flow to sales: 21%.
Still excellent. But look at the trend, because this is where the cold analysis lives. In 2024, Meta converted $52 billion into free cash flow. In 2025, with revenue up 22%, free cash flow fell to $43.6 billion. Cash from operations rose. Free cash flow dropped. Why? Capital spending nearly doubled to fund AI infrastructure.
Operating cash flow tells you the business is booming. Free cash flow tells you how much of that boom is being poured back into the ground. Watch this number as Meta guides 2026 capex toward $115 to $145 billion. The gap between the two is the whole story.
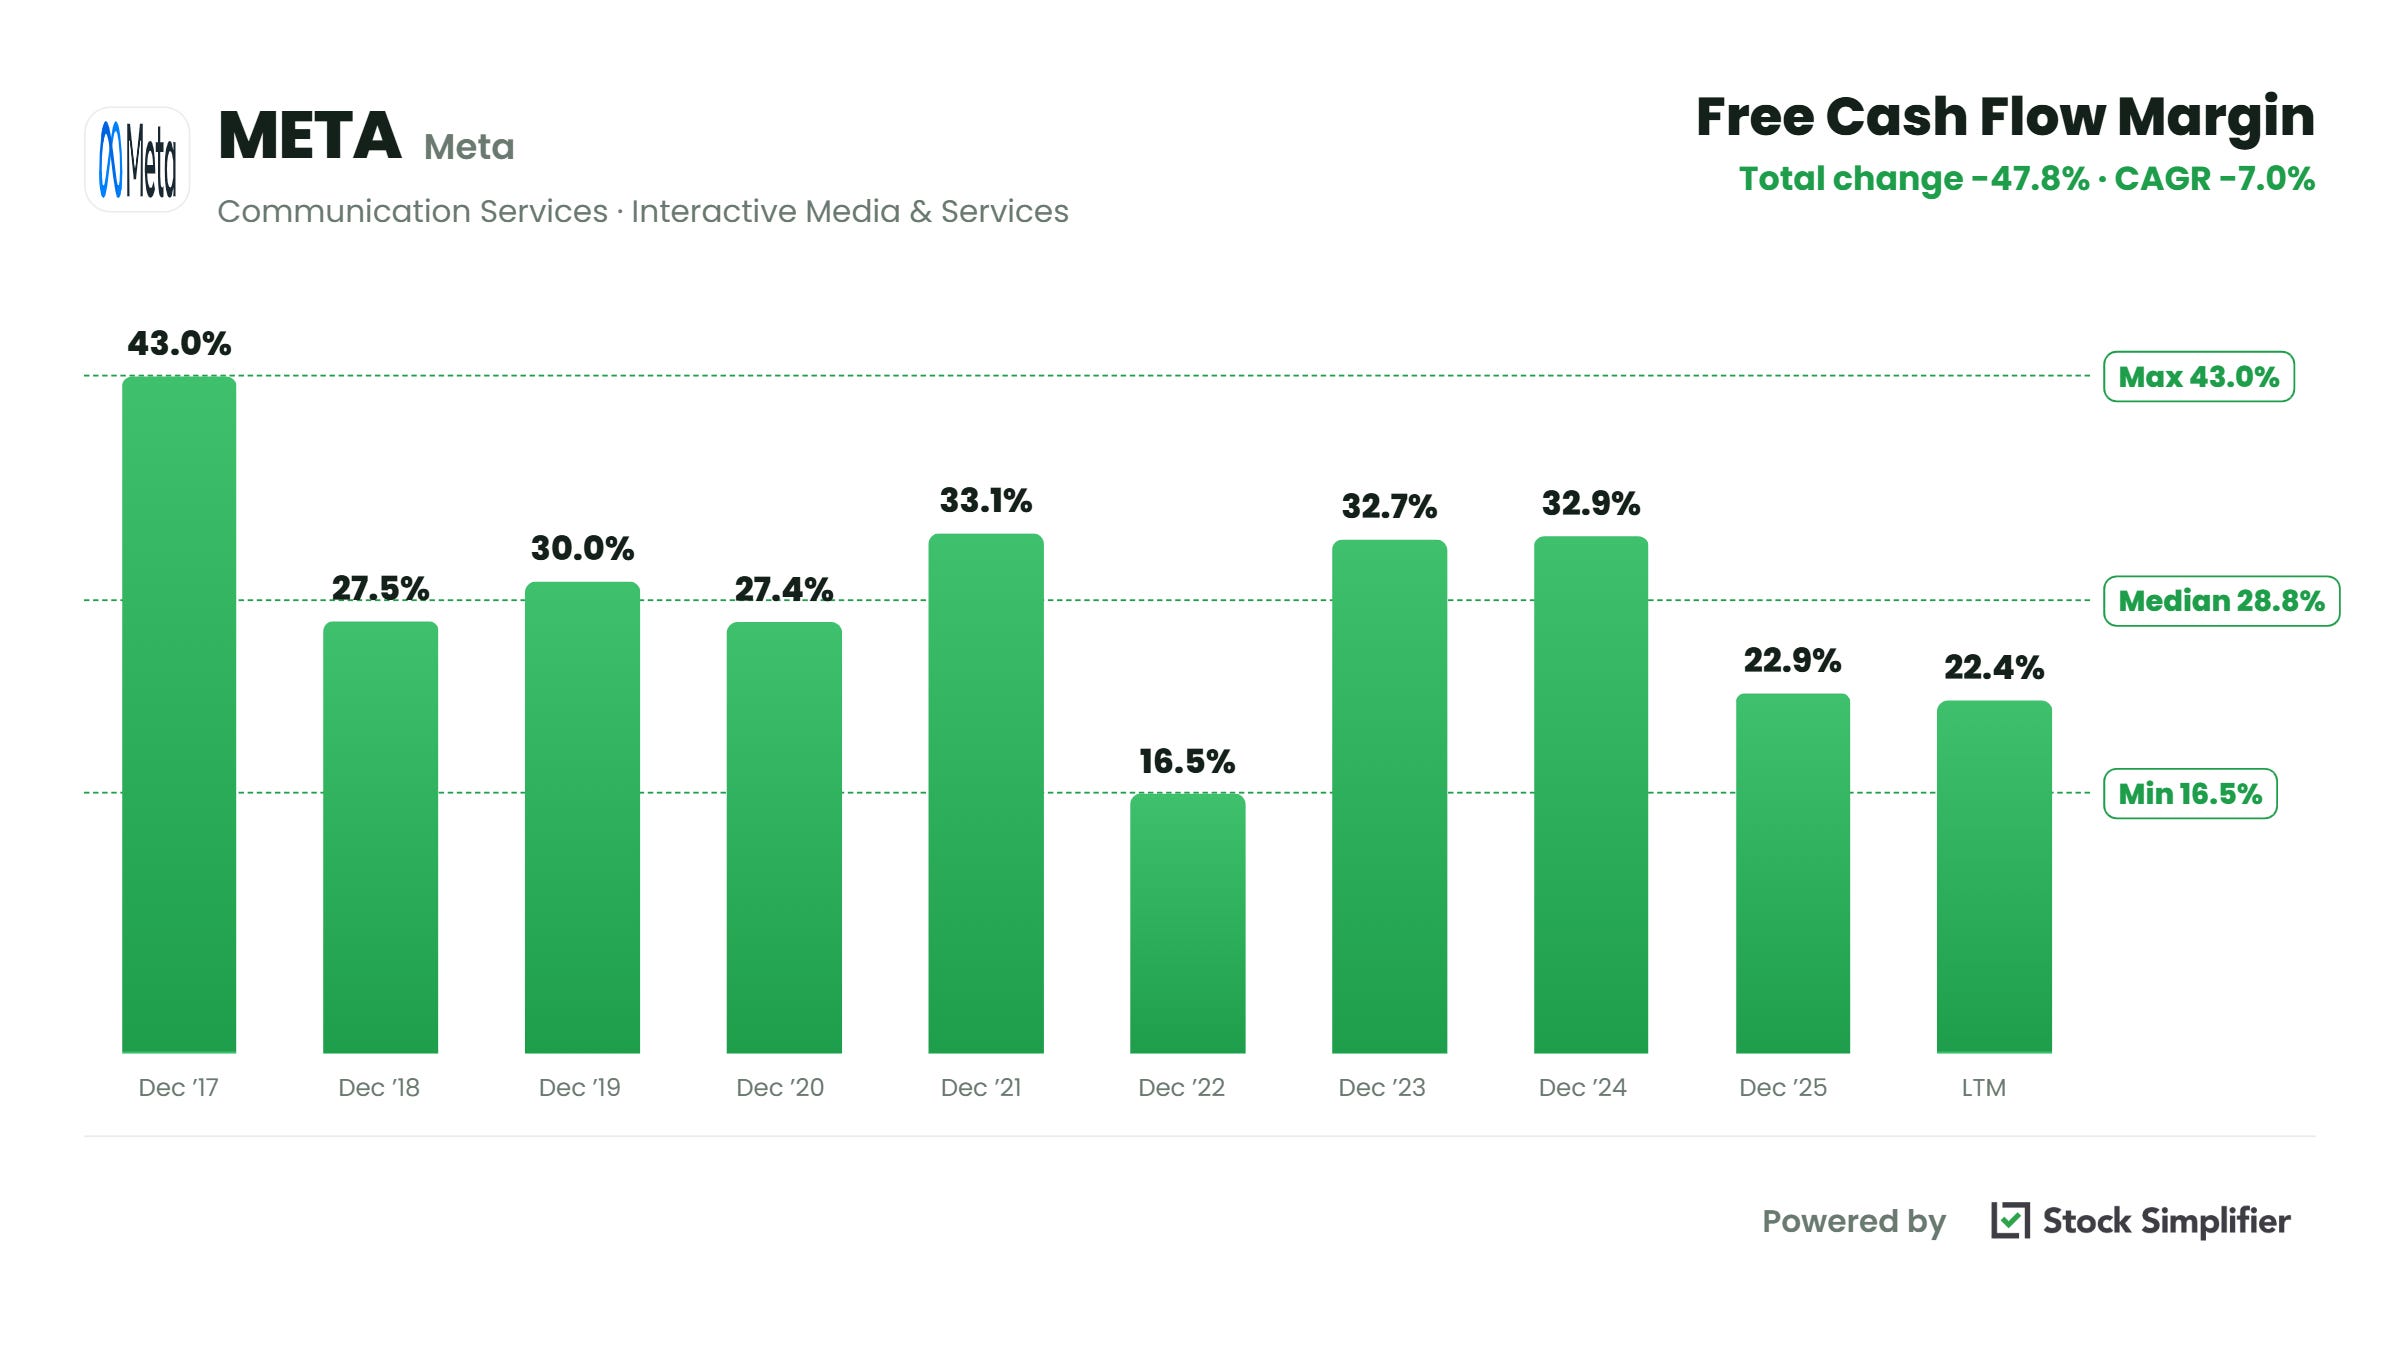
Stock price divided by operating cash flow per share. A valuation check that ignores accounting noise and asks what you’re paying for a dollar of cash generation.
Meta produces roughly $48 of operating cash flow per share. The stock trades around $651.
Price to cash flow: about 13.5.
For a company compounding revenue north of 30% last quarter, paying 13 to 14 times cash flow is not expensive. That doesn’t make it a buy. It makes it a starting point. The bull case rests on that cash flow holding up while capex peaks. The bear case is that the spending never stops paying off. Name what has to be true before you decide.
The textbook version compares the present value of a company’s cash flows to the capital invested to produce them. I use a simpler proxy: operating cash flow divided by total debt plus equity.
Meta’s invested capital sits near $302 billion. Trailing operating cash flow was $124 billion.
Cash flow return on investment: roughly 41%.
For every dollar of debt and equity funding the business, Meta returns about 41 cents in operating cash a year. That is elite. It’s the number that separates a real compounder from a company that grows revenue while lighting money on fire.
Total debt divided by operating cash flow. It tells you how many years of cash it would take to wipe out the debt.
Meta carries $58.7 billion in long-term debt. Trailing operating cash flow was $124 billion.
Debt to operating cash flow: 0.47.
Meta could pay off all of its debt in under six months of cash generation. Worth noting: Meta raised roughly $30 billion in new debt in late 2025 to help fund the AI build-out. Even after that, the balance sheet barely notices. This is what financial strength looks like.
Operating cash flow divided by revenue. How much of every sales dollar turns into actual cash.
Meta’s trailing operating cash flow was $124 billion on $215 billion in revenue.
Cash flow margin: 58%.
Fifty-eight cents of every revenue dollar becomes operating cash. I’ve studied a lot of businesses. A margin like that is rare air, and it’s the quiet reason Meta can spend $100 billion-plus on AI and still return cash to shareholders.
Run them as a group and a clear read emerges. Meta is a cash machine with a fortress balance sheet, trading at a reasonable multiple of the cash it produces.
The single thing I’d watch is ratio number 3. Operating cash flow is enormous and growing. Free cash flow is shrinking because capital spending is exploding. If those data centers earn their keep, today’s price looks cheap. If they don’t, the free cash flow gap widens and the story changes.
Here’s my one takeaway. Pick a company you own. Run these 7 ratios on its latest filing. It takes about 10 minutes, and it will teach you more about the business than any headline ever will.
Wishing you investing success,
Brian
No posts
Comments
Nothing yet. Say the first thing.
Sign in to join the conversation.