
In today’s lesson, we will continue looking at ways to value companies, specifically at common multiples, which are almost used as a valuation shortcut.
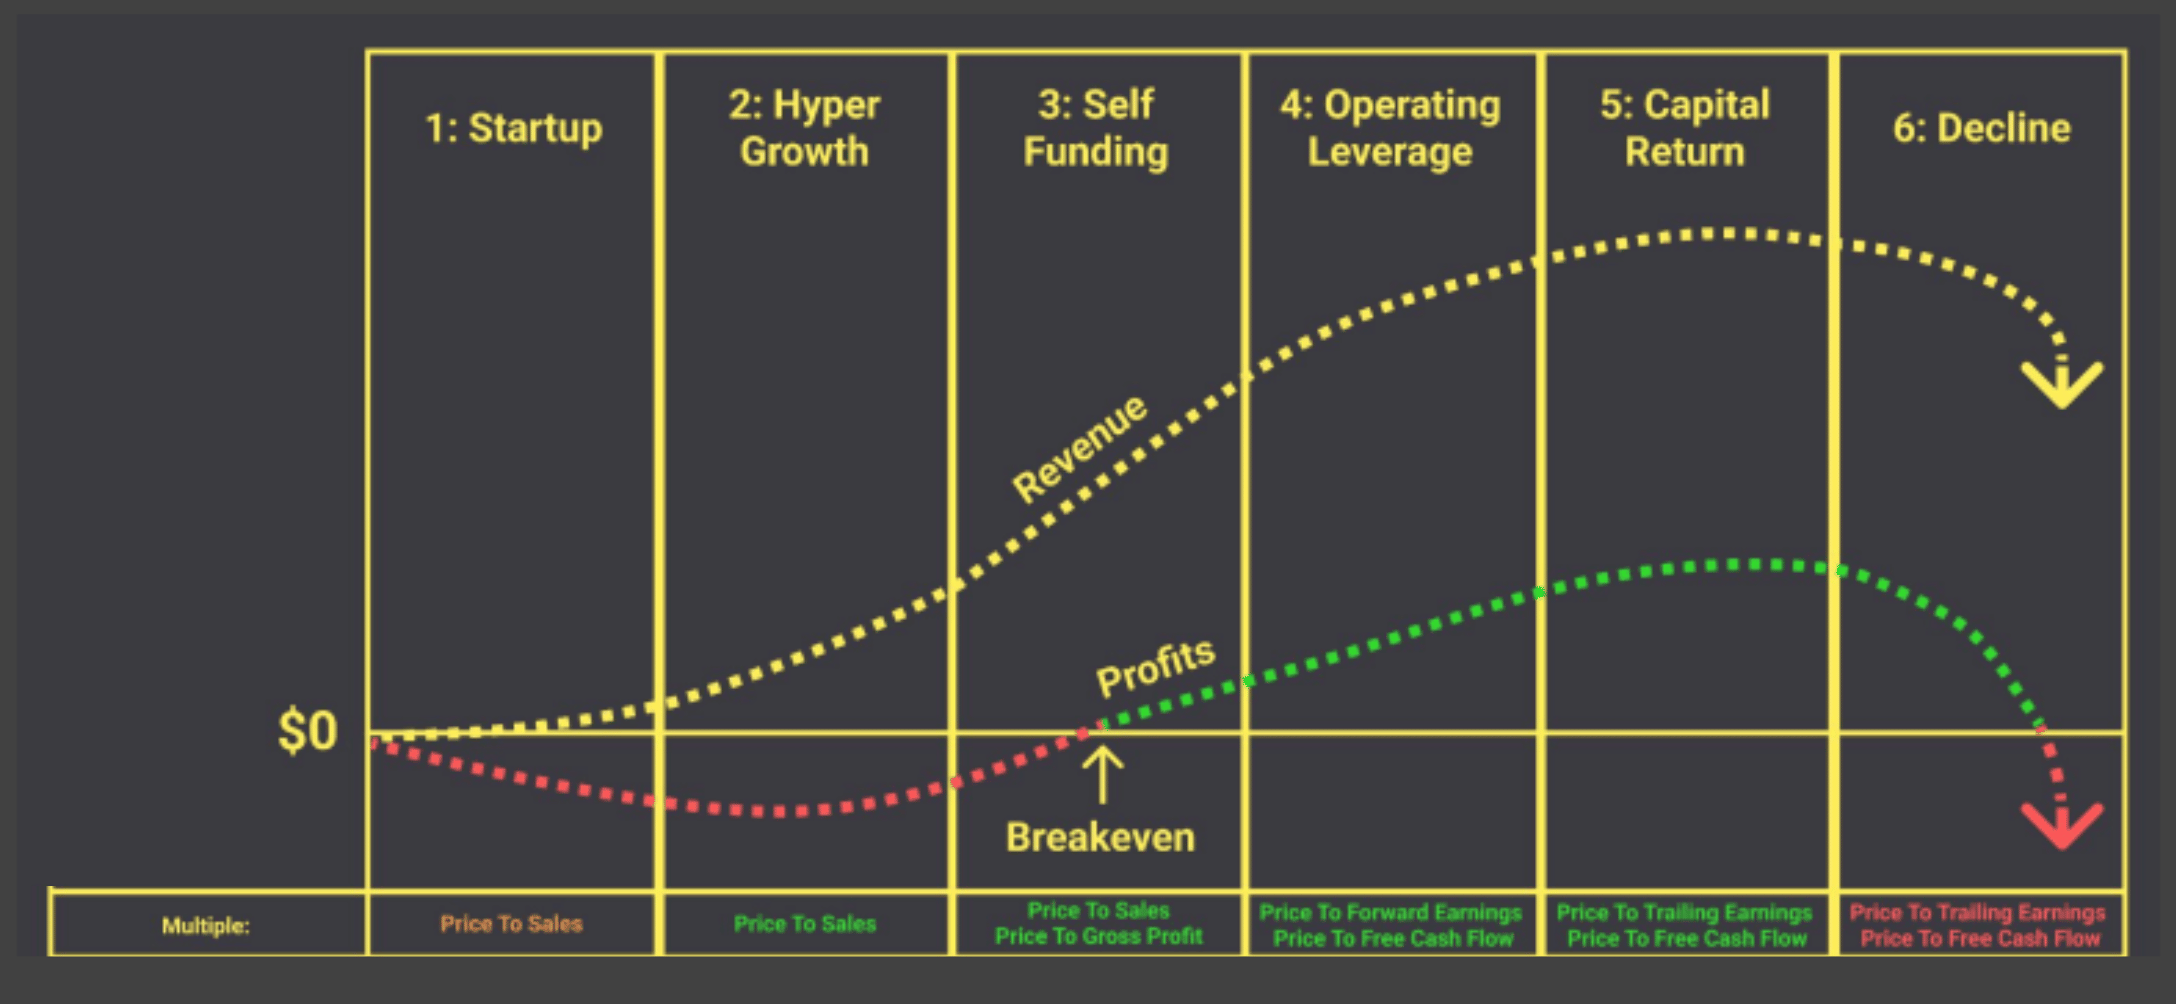
Multiples are ratios that compare a company’s current market value to a financial metric. These are especially useful for Stage 2 through Stage 5 companies on the Business Growth Cycle.
Depending on which stage the company is in, however, will determine the best metric to use to value the company.
Two primary ways to define a company’s current market value are market capitalization and enterprise value.
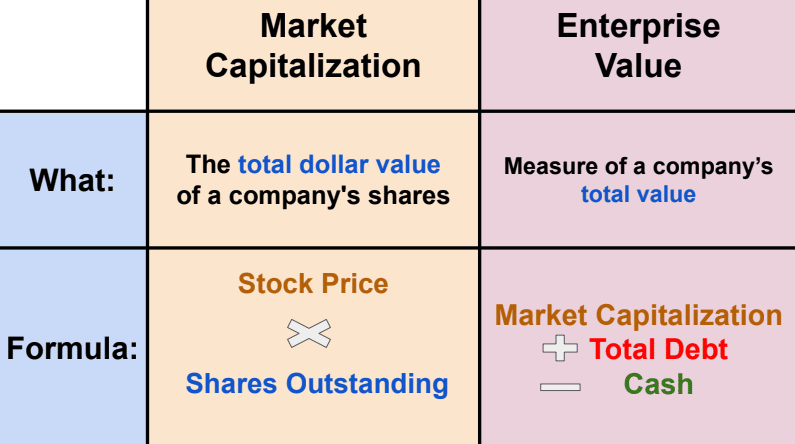
A company’s market capitalization, or market cap, is the total equity value of a company. It is figured by multiplying the current stock price by the number of shares outstanding.
The enterprise value is another measure of a company’s total value, considering the company’s debt and cash. It is figured by taking the market cap, adding its debt, and subtracting its cash.
The multiples we review today use a company’s market cap, but the enterprise value can easily be substituted.
Before the next section, a quick one. I send a free lesson like this every week, one investing idea made simple. If you want the next one in your inbox, the link's here. And if you've ever stared at a P/E ratio and not known if it was cheap or expensive, hit reply after you subscribe and tell me. I read every one.
The math used to calculate these ratios is relatively straightforward, primarily dividing a company’s market cap by different figures from the financial statements.

While there are several ratios investors can use to value a company, today, we will be highlighting four.
1 - Price-to-sales (P/S) ratio
By dividing a company’s market cap by its trailing twelve months’ sales, we get the price-to-sales (P/S) ratio.
When a company is a startup or is still in the first stage of the business growth cycle, the P/S ratio might not be valuable due to the company earning so little revenue.
When a business begins to generate sales but before it earns profits, the P/S ratio becomes one of the ideal ways to value a company.
2 - Trailing price-to-earnings (P/E) ratio
By dividing a company’s stock price by earnings per share (EPS), we arrive at the price-to-earnings (P/E) ratio.
This is probably the most common valuation multiple used, though it is most helpful for companies in the capital return phase (Stage 5).
3 - Forward price-to-earnings ratio
Remarkably similar to the P/E ratio, the forward P/E ratio is calculated by dividing the company’s stock price by the estimated EPS (what analysts think) it will earn over the next twelve months.
The estimated EPS comes from analyst consensus, but this usually is pretty close to management’s guidance.
The forward P/E ratio is usually lower than the trailing P/E ratio, as earnings for most companies in Stage 5 tend to grow over time.
This ratio is also an excellent way to value a company in Stage 4, the operating leverage phase, since those companies are just on the verge of generating normalized profits.
4 - Trailing price-to-free cash flow
The price-to-free cash flow (P/FCF) ratio is calculated by dividing a company’s market cap by its free cash flow.
This is one of our favorite multiples and is one of the few that comes from the cash flow statement, not the income statement.
Free cash flow is revealed by subtracting capital expenditures (capex) from operating cash flow.
How to use these ratios
Sadly, no magic formula tells you when a stock is cheap or expensive, even these helpful ratios.
If only it were as easy as saying when a company has a P/E ratio over 20, it’s expensive, or when it has a P/S ratio under 5, it’s cheap.
These ratios should be compared to:
the company’s history,
peers, and
the S&P 500’s averages.
These comparisons will give us a better idea of whether the stock is cheap or expensive.
For instance, let’s say a cybersecurity company you’re interested in has a P/E ratio of 30. A quick comparison to the S&P 500 shows the index trades at 22 times trailing EPS.
This shows the company is more expensive than the average company in the S&P 500 index.
However, comparing the company to others in the same industry is usually more appropriate. After all, car manufacturers are vastly different businesses than cybersecurity services.
A comparison to its industry shows that cybersecurity peers trade at 40 times trailing EPS.
If the company we’re researching shows characteristics similar to those of its peers (e.g., growth rates, margins, quality of earnings, etc.), it might be an attractive valuation to buy shares.
As always, there is a lot of nuance when it comes to valuing companies. It is rarely a black-and-white exercise, even when using these common valuation multiples!
Wishing you investing success,
Brian
Comments
Nothing yet. Say the first thing.
Sign in to join the conversation.