
Today, we’ll continue our lessons on valuation.
Specifically, we will explain how to determine potential upsides for companies in Stage 1 (Startup) or Stage 2 (Hypergrowth). While this imprecise method involves some guesswork, it is still valuable when considering companies early in the Business Growth Cycle.
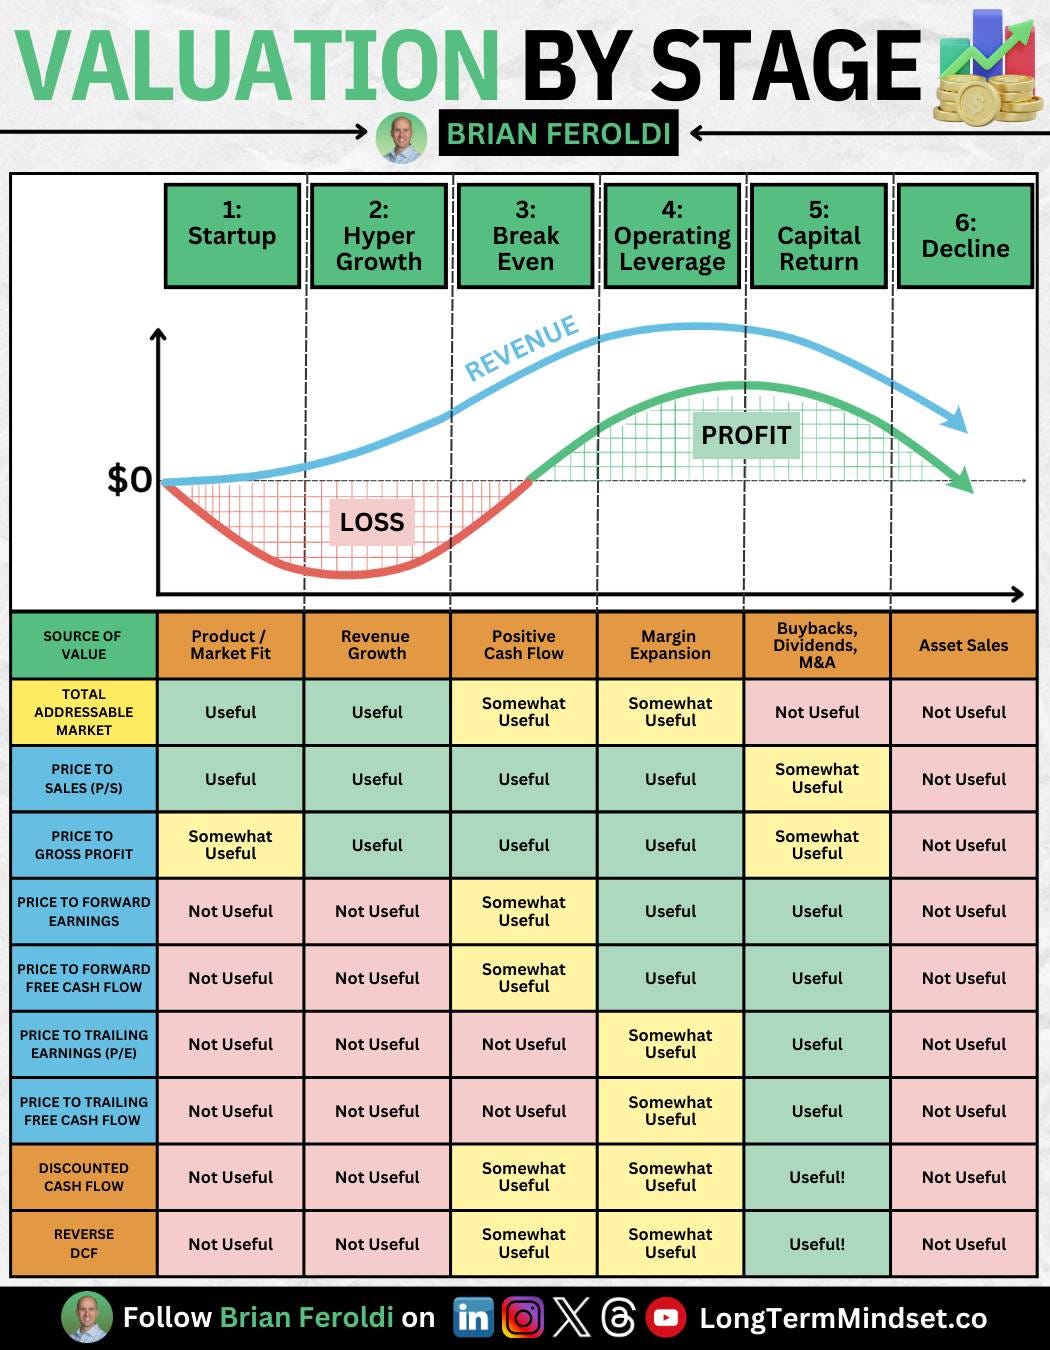
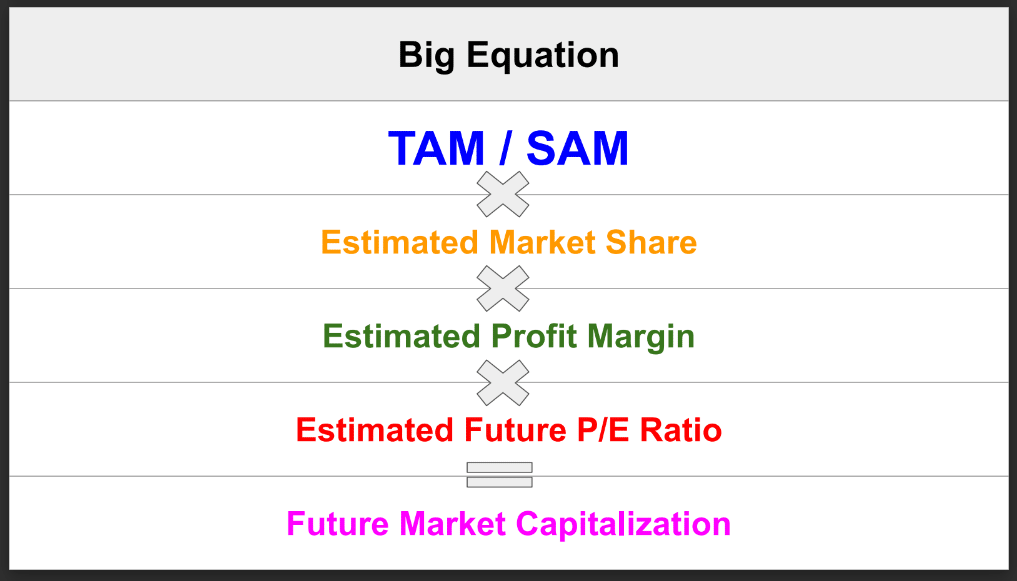
When doing this type of valuation work, the most important thing investors need to know and understand is this equation:
TAM * market share * profit margin * future P/E ratio = future market cap
Let’s take a closer look at each of the factors in this equation:
TAM/SAM
TAM (or total addressable market) is the annual spending in the markets where the company operates. In other words, it is the yearly revenue opportunity that the company is pursuing.
TAM is useful because investors usually need more concrete data to work with for Stage 1 and Stage 2 companies. Often, these companies need to generate revenue and are still trying to establish market fit.
Investors in these early-stage companies should already know that they come with a lot of risk.
TAM is important because it allows investors to see if companies also come with a lot of potential upside, possibly making it worth taking such risks.
We estimate TAM by multiplying the number of potential customers by the average annual spending per customer in that market.
For instance, there are approximately one million patients with Type 1 diabetes in North America. These patients spend about an average of $8,000 annually on their condition. If a company was pursuing this market, investors could roughly estimate that its TAM would be about $8 billion (the product of 1 million patients * $8,000 spent per year).
Of course, few TAMs are static. Most markets are either growing or shrinking.
In our above example, the number of North Americans with Type 1 diabetes is expected to grow to 1.5 million patients by 2027. By then, patients are expected to spend $9,000 per year. This means a company in this market could expect its TAM to increase to $13.5 billion by 2027.
Even more crucial than TAM is SAM (serviceable addressable market). SAM is essentially the specific portion of the market you’re targeting.
Staying with our example above, if our hypothetical company were specifically targeting juveniles with Type 1 diabetes, the SAM of the company would be a much smaller market than the $8 billion TAM.
Estimated Market Share
Next lesson we turn this around and value mature, established companies, the ones with real numbers to work with. It's free, every issue lands in your inbox. Drop your email and follow along.
Estimated market share is exactly what it sounds like. It’s the portion of the TAM/SAM that a company can realistically capture. No company will ever capture a 100% market share outside of strictly regulated industries, such as utilities. Thus, we must make assumptions about how much of the company’s TAM/SAM it can capture.
One technique when doing this is to look at the market share the industry leaders currently occupy. Then, investors can calculate a few different assumptions, such as what it would look like if the company captured half or all of that share.
Essentially, this is a way to slice down the market to a revenue number that the company can pursue.
Estimated Profit Margin
The profit margin is the percentage of the company’s total revenue converted into profits.
When looking at these early-stage companies, investors must determine the profit margin the company could achieve once it’s optimized for profits.
This number will be very different depending on its business model and industry. Mature coffee shops, car manufacturers, and software companies all come with very different profit margins!
One way to do this is to look at the current players in that industry and find the average of their profit margins.
Estimated P/E Ratio
If you recall our past lessons on valuation, you’ll remember that a stock’s P/E ratio is calculated by dividing its price by its earnings per share.
The 100-year average P/E ratio for companies in the S&P 500 index rests between 15 and 16.
Another thing to consider is the average P/E ratio of the companies in its industry.
Again, because so much of this is guesswork, it can be helpful to make a few optimistic and pessimistic assumptions to see how this can impact your range of results.
Future Market Capitalization
A company’s market capitalization, or market cap, is the total equity value of a company. It is figured by multiplying the current stock price by the number of shares.
You can estimate a young company’s future market cap by multiplying the above factors.
If a lot of the above work sounds imprecise, that’s because it is!
Because there are so few concrete numbers, valuing young companies is risky. Exercise caution and run through optimistic and pessimistic scenarios before investing.
Our next lesson will examine common methods used to value more mature companies.
Wishing you investing success,
Brian
No posts
Comments
Nothing yet. Say the first thing.
Sign in to join the conversation.