
Two numbers off the same financial statement, same company, same five years.
Cash from operating activities: up 125.9%.
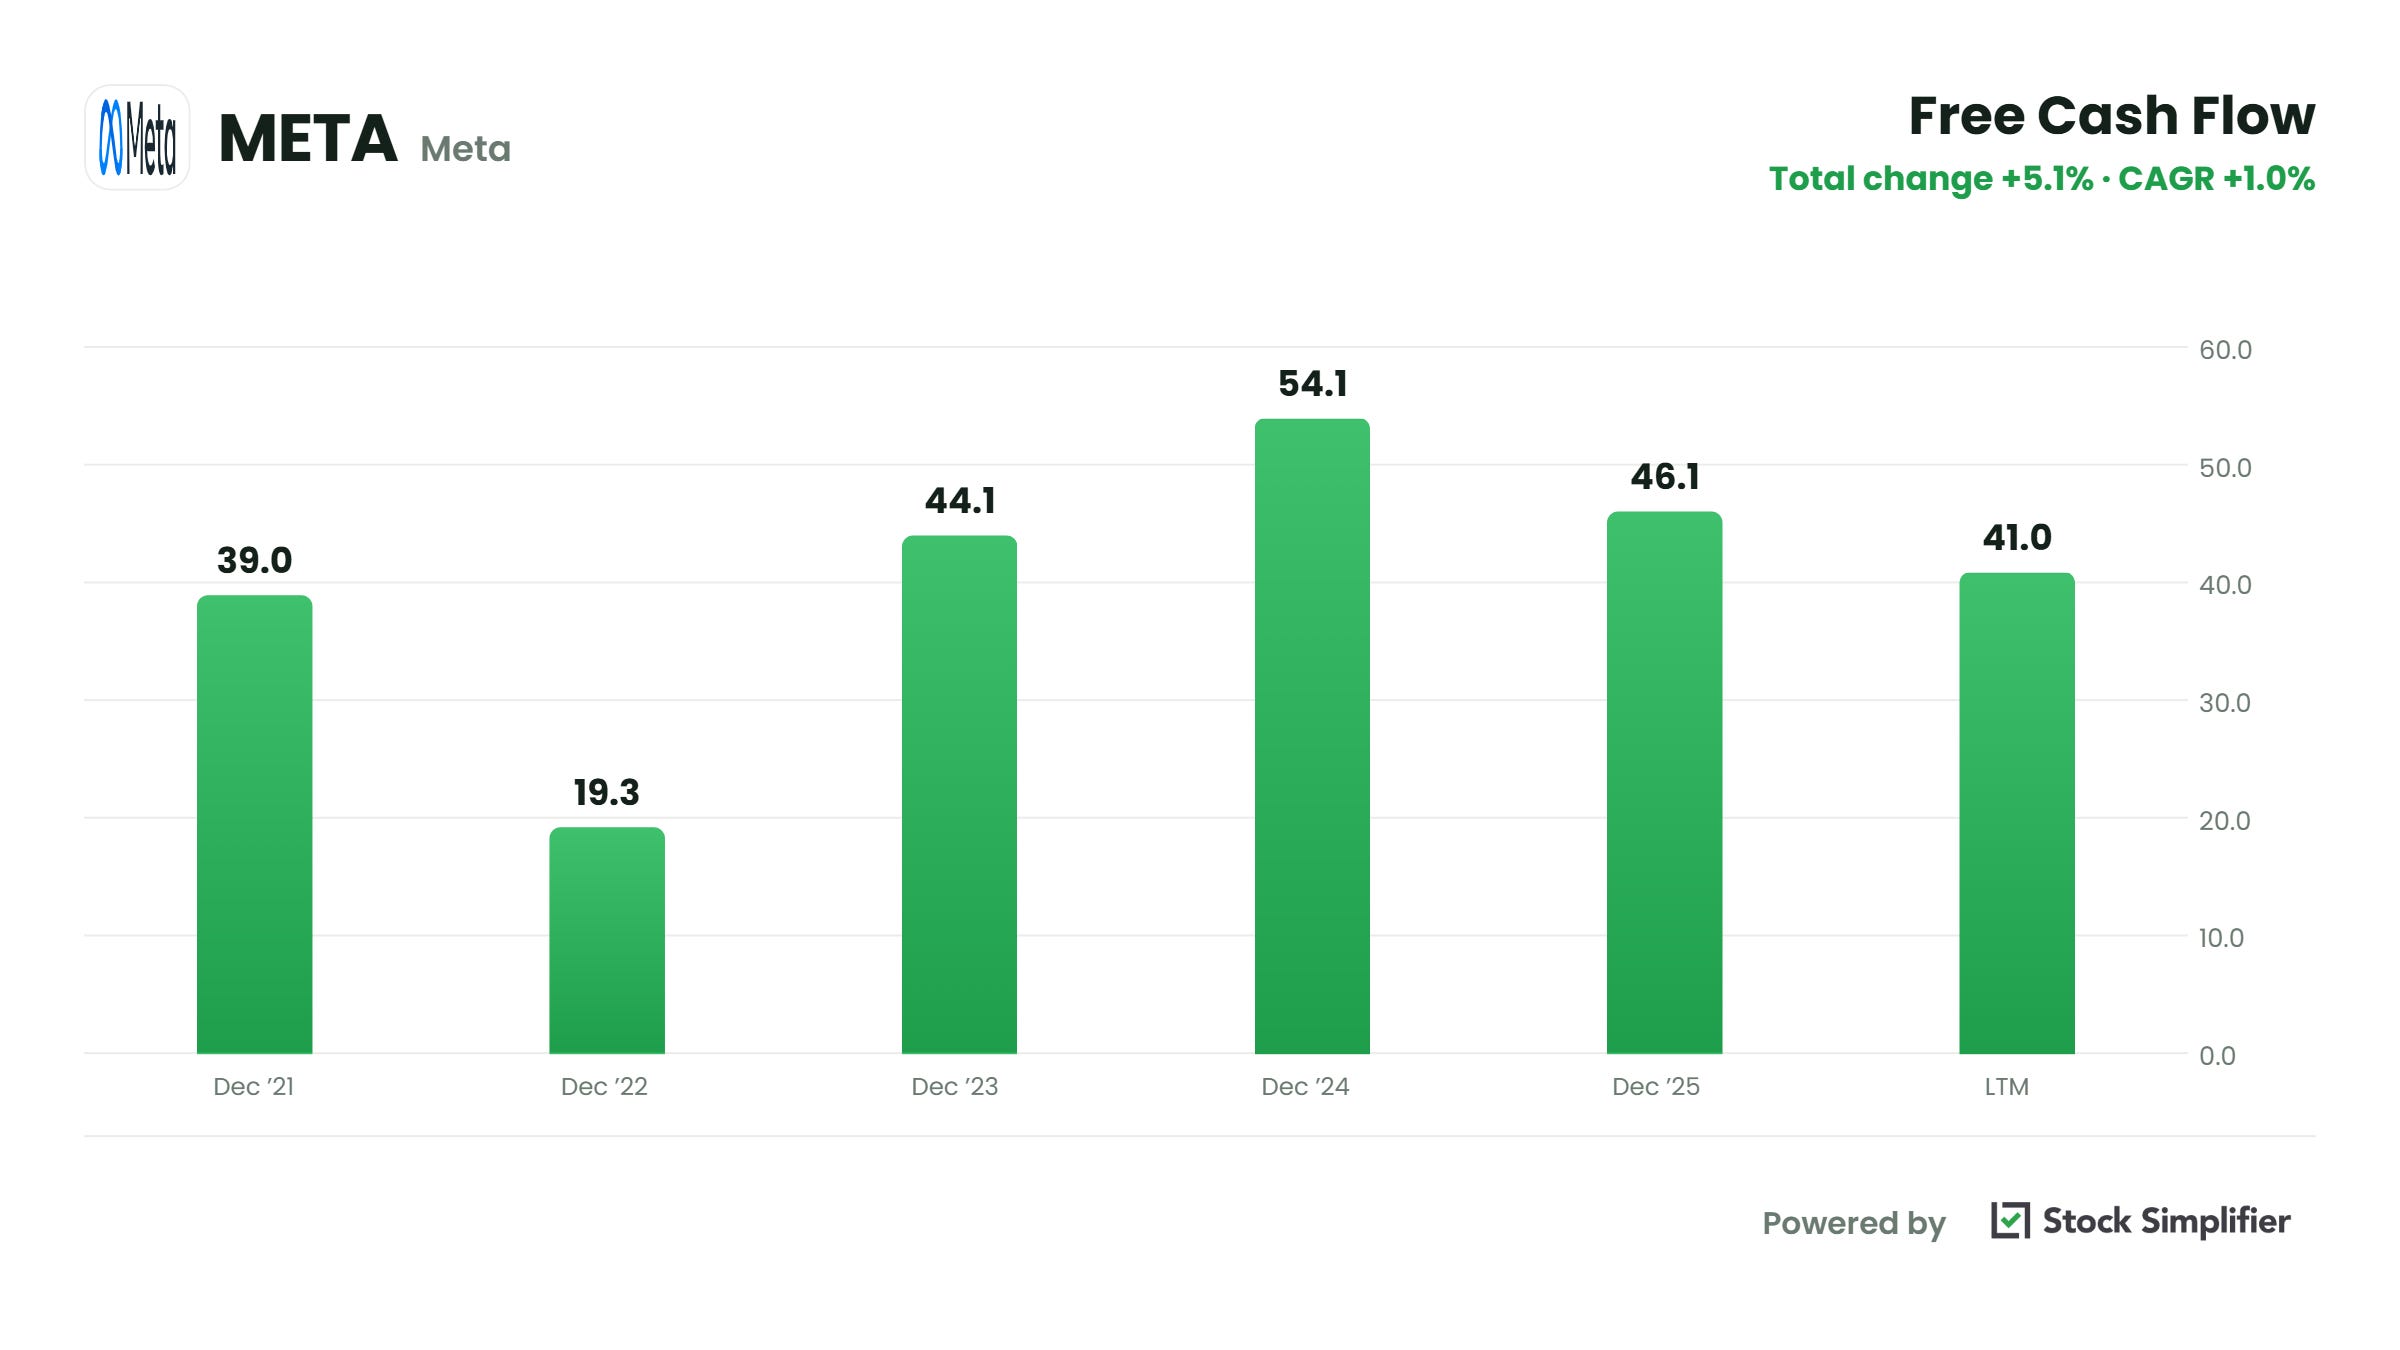
Free cash flow: up 5.1%.
Everything worth knowing about Meta right now lives in the space between those two numbers, and the cash flow statement is the only place you can see it.
I ignored this statement for the first several years I invested. I assumed net income was the answer and cash flow was the accountant’s version of the same thing. Some of the worst businesses I’ve ever owned had lovely net income and lousy cash.
Why the statement exists
The income statement uses accrual accounting. Revenue gets booked when the sale happens, not when the money arrives. Expenses get booked when they’re incurred, not when the check clears.
The cash flow statement uses cash accounting. It’s your checking account. Money in, money out, nothing else.
That difference is why accounting fraud almost always surfaces here first. You can book revenue for a sale the customer hasn’t paid for. You can capitalize a cost instead of expensing it. You can stretch out how long you claim a piece of equipment will last. All of that flatters net income. None of it puts a dollar in the bank.
Three sections, three questions.
Operating: does the business generate cash?
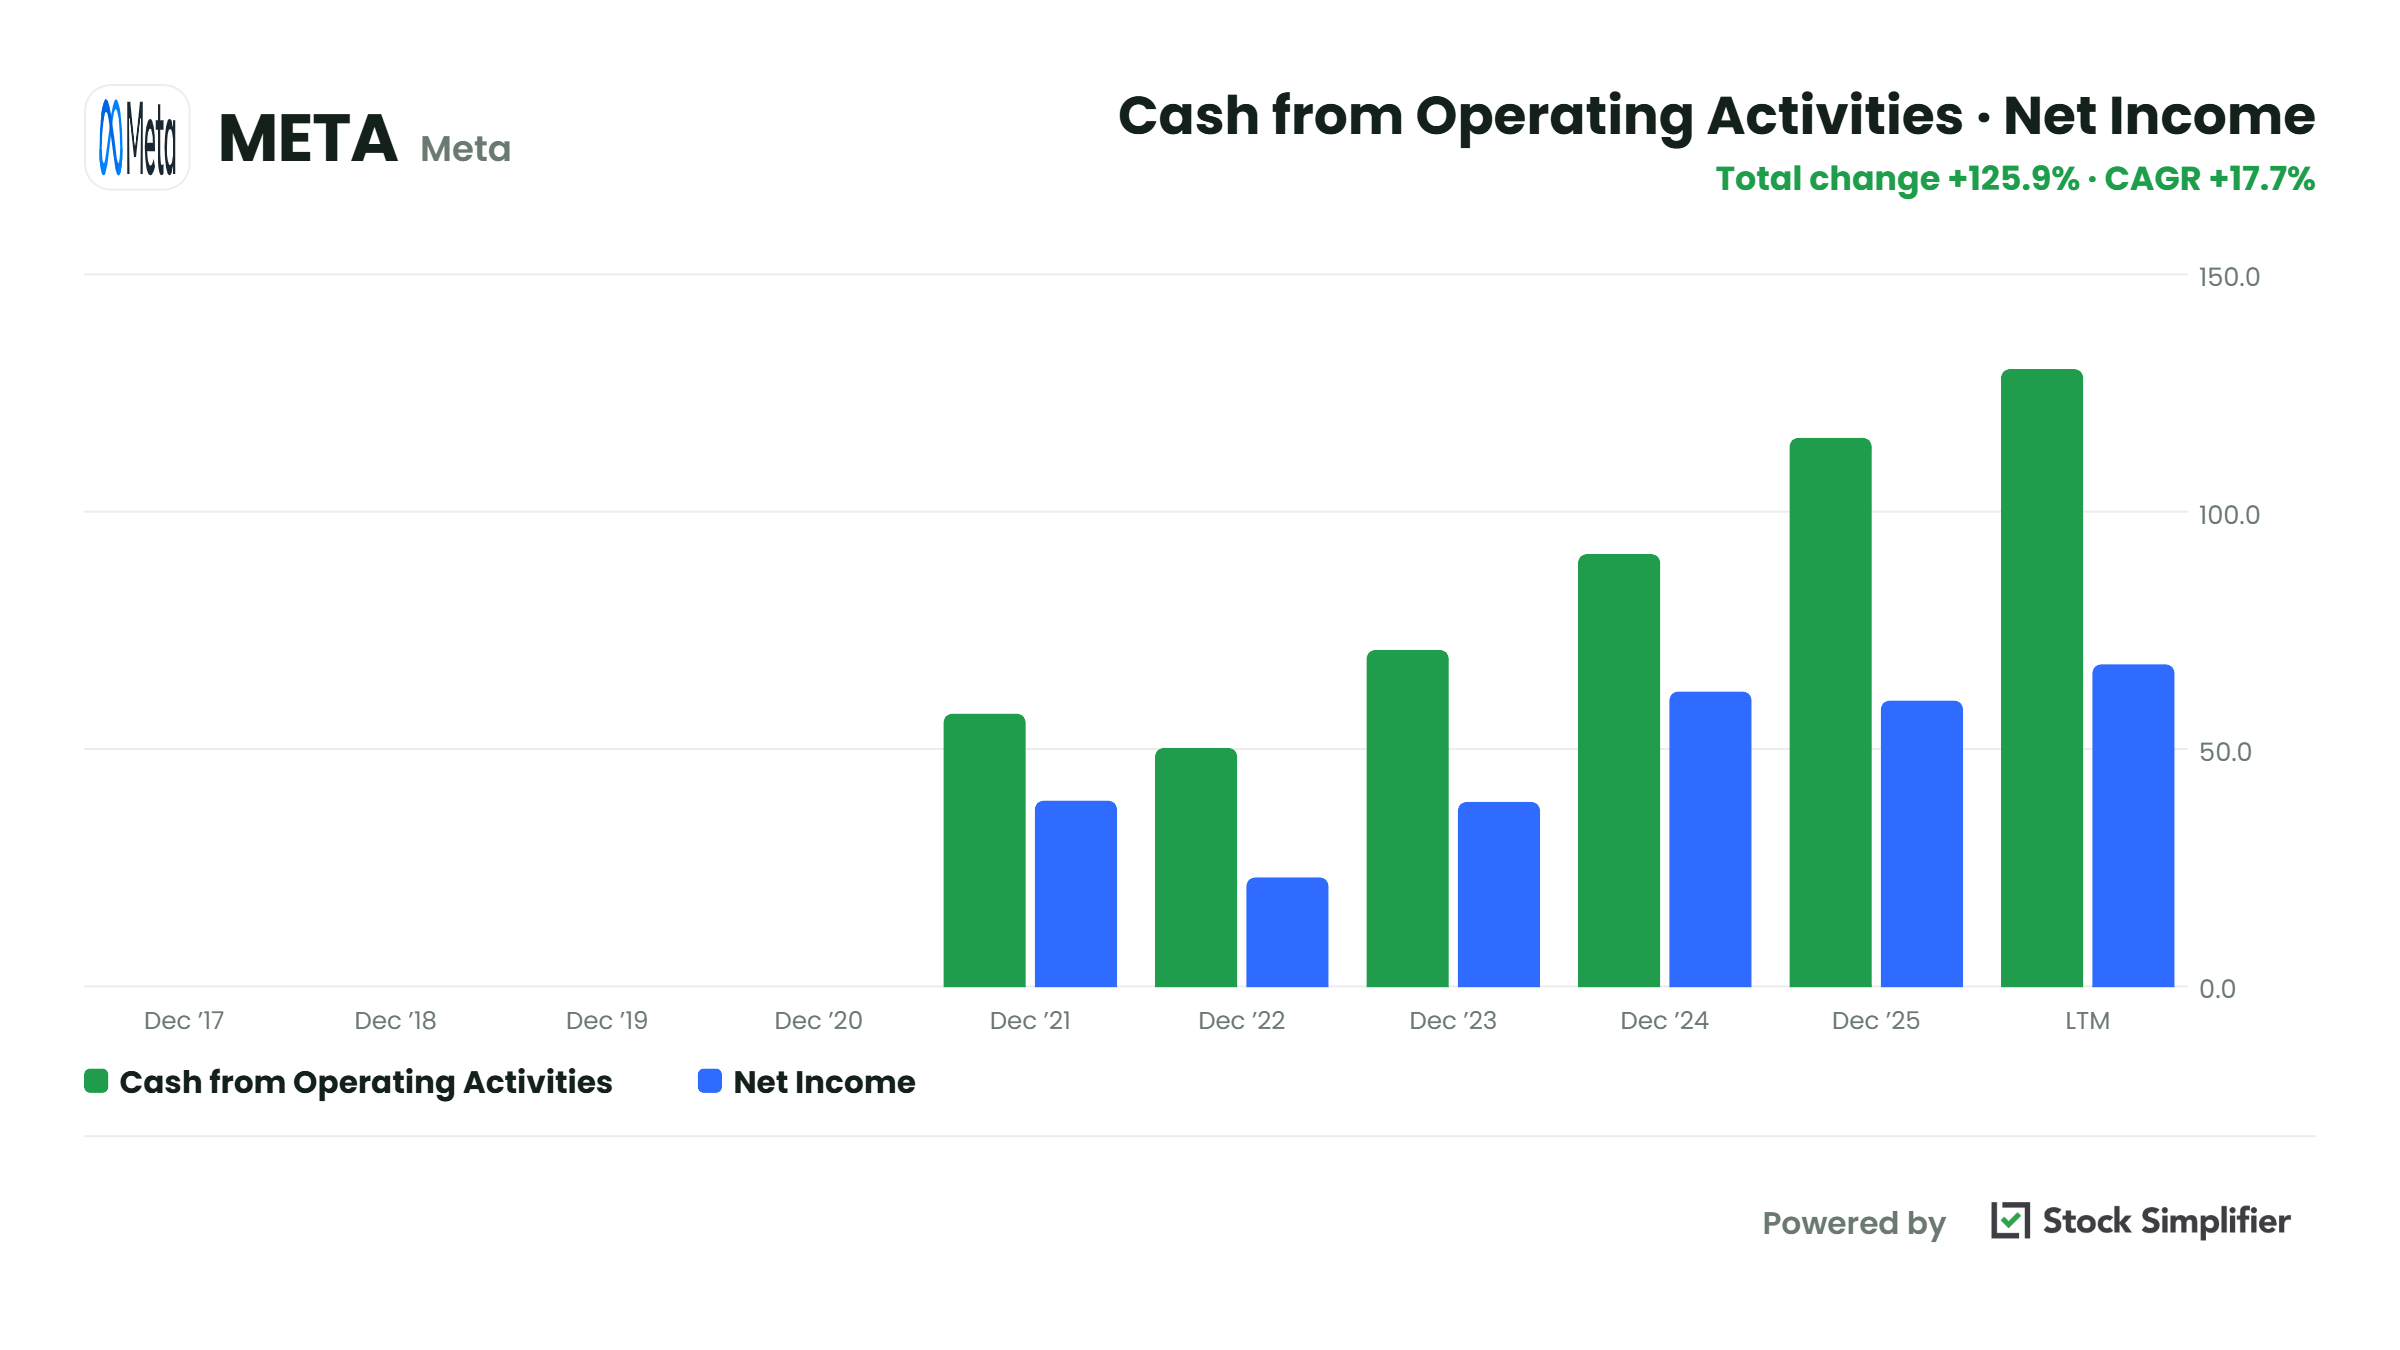
Green bars are cash from operations. Blue bars are net income. The green bar is taller every single year, and in 2025 it was nearly double: $115.8 billion of cash against $60.5 billion of profit.
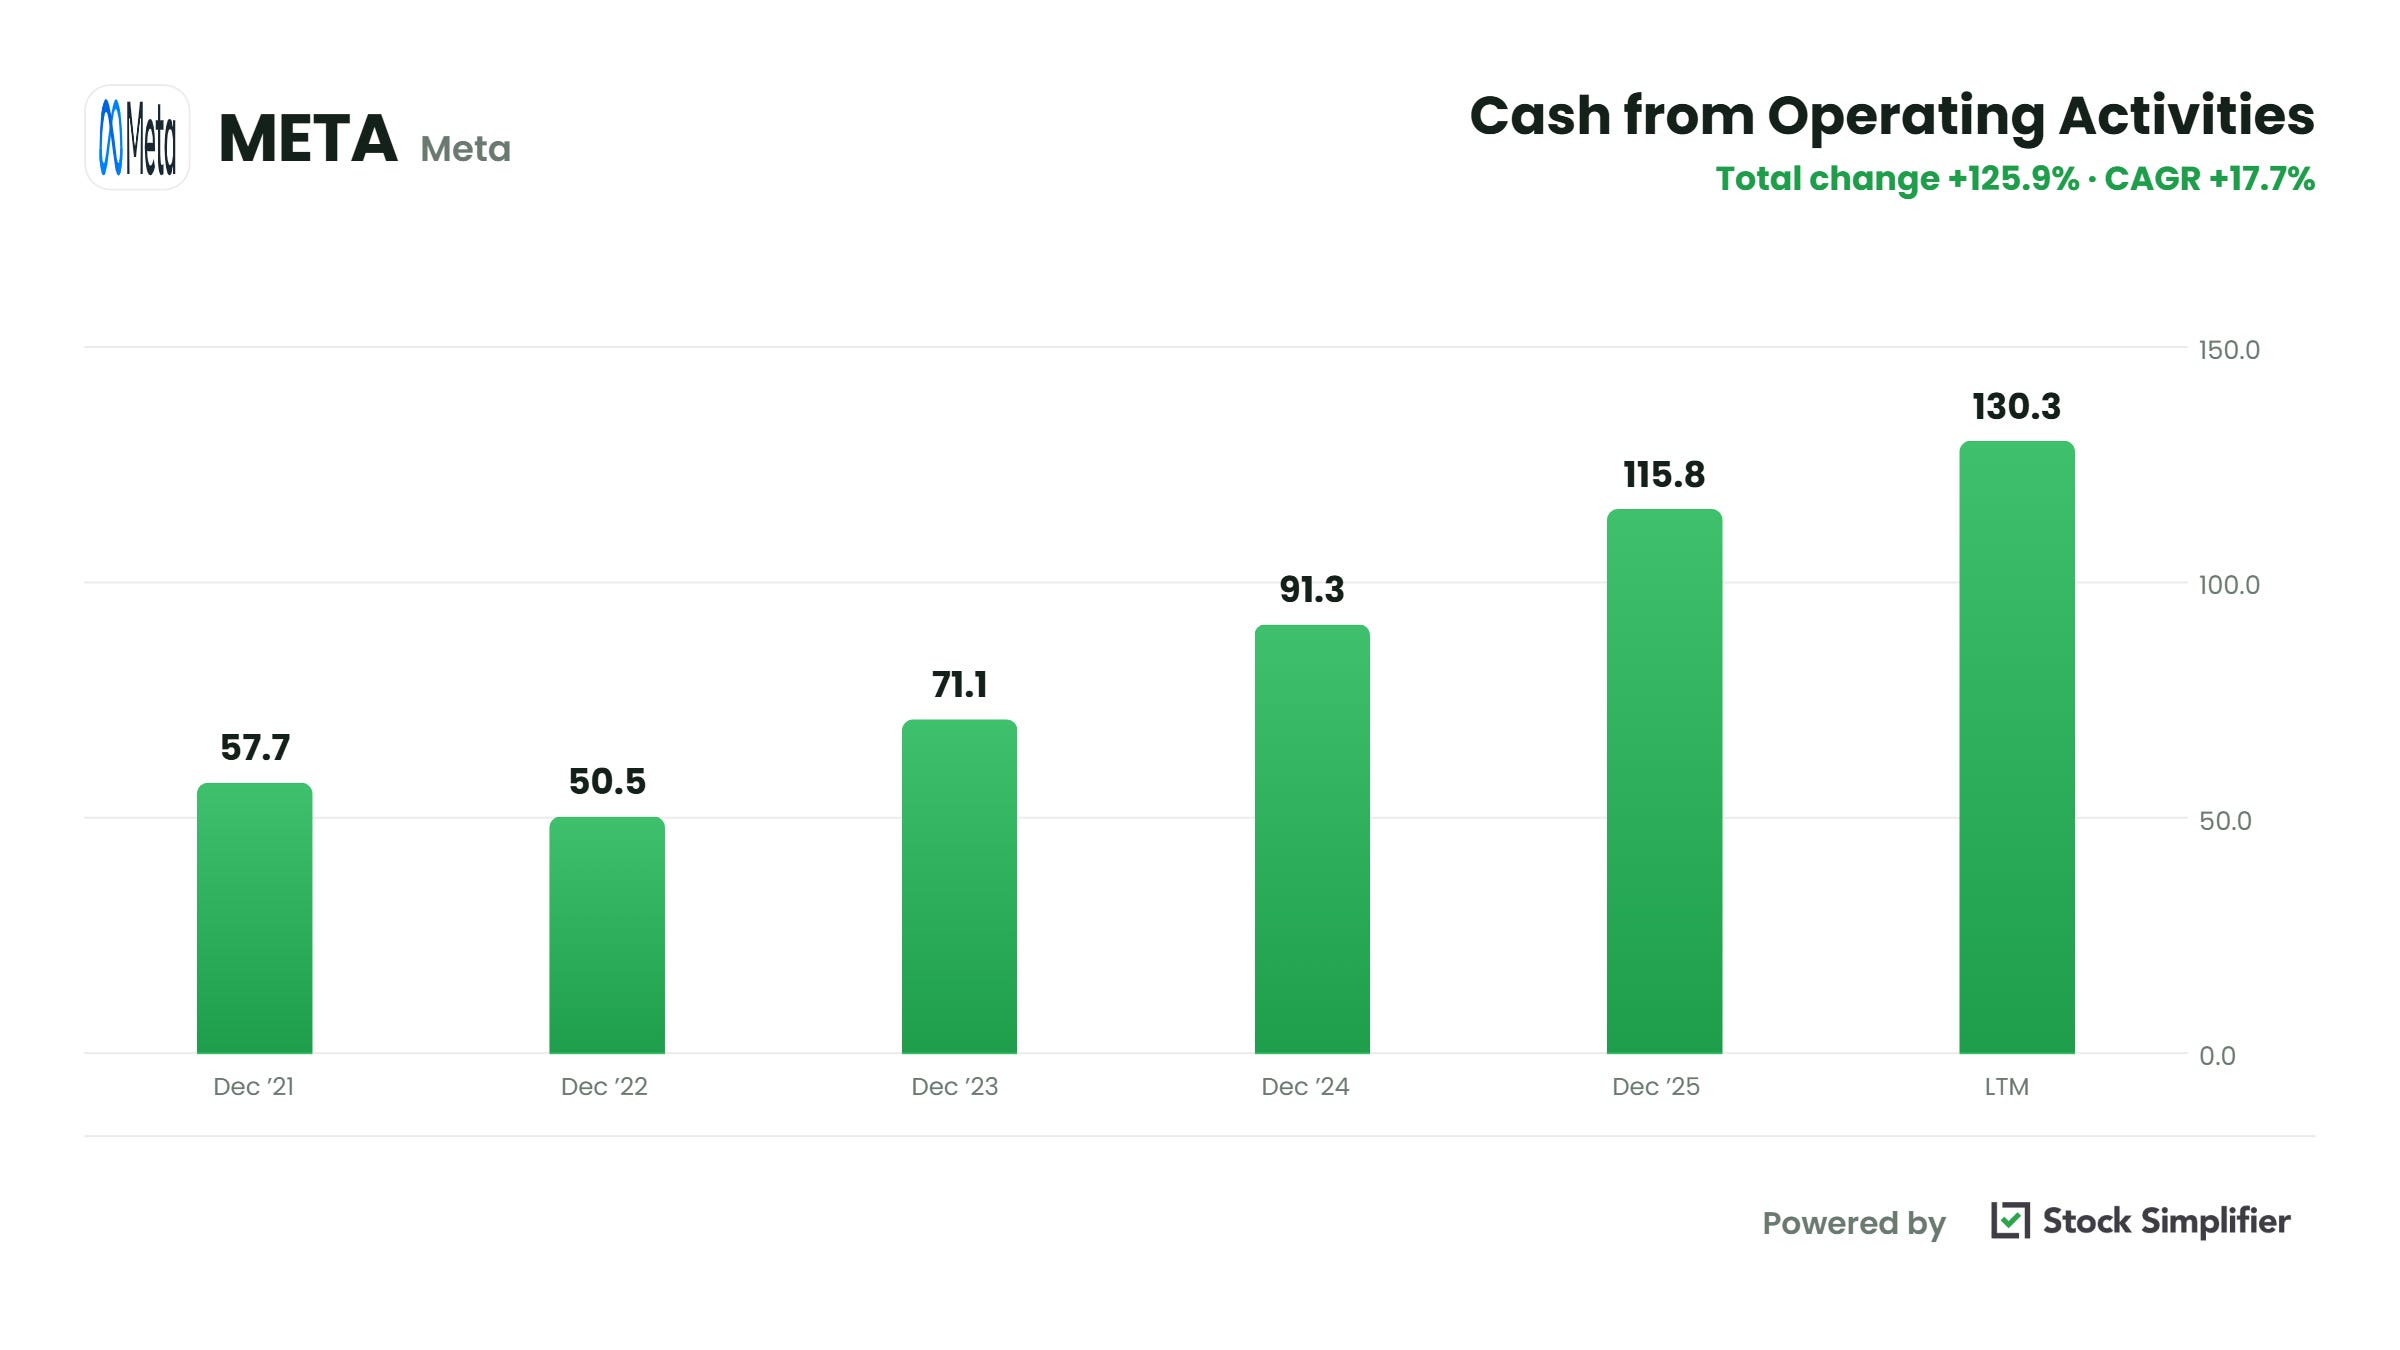
The section starts at net income and adds back everything the income statement subtracted that never left the building.
Two add-backs did most of the work in 2025.
Depreciation and amortization: $18.6 billion. Meta bought servers in prior years and paid cash then. Accounting spreads that cost over the years the servers get used. Real expense, old cash.
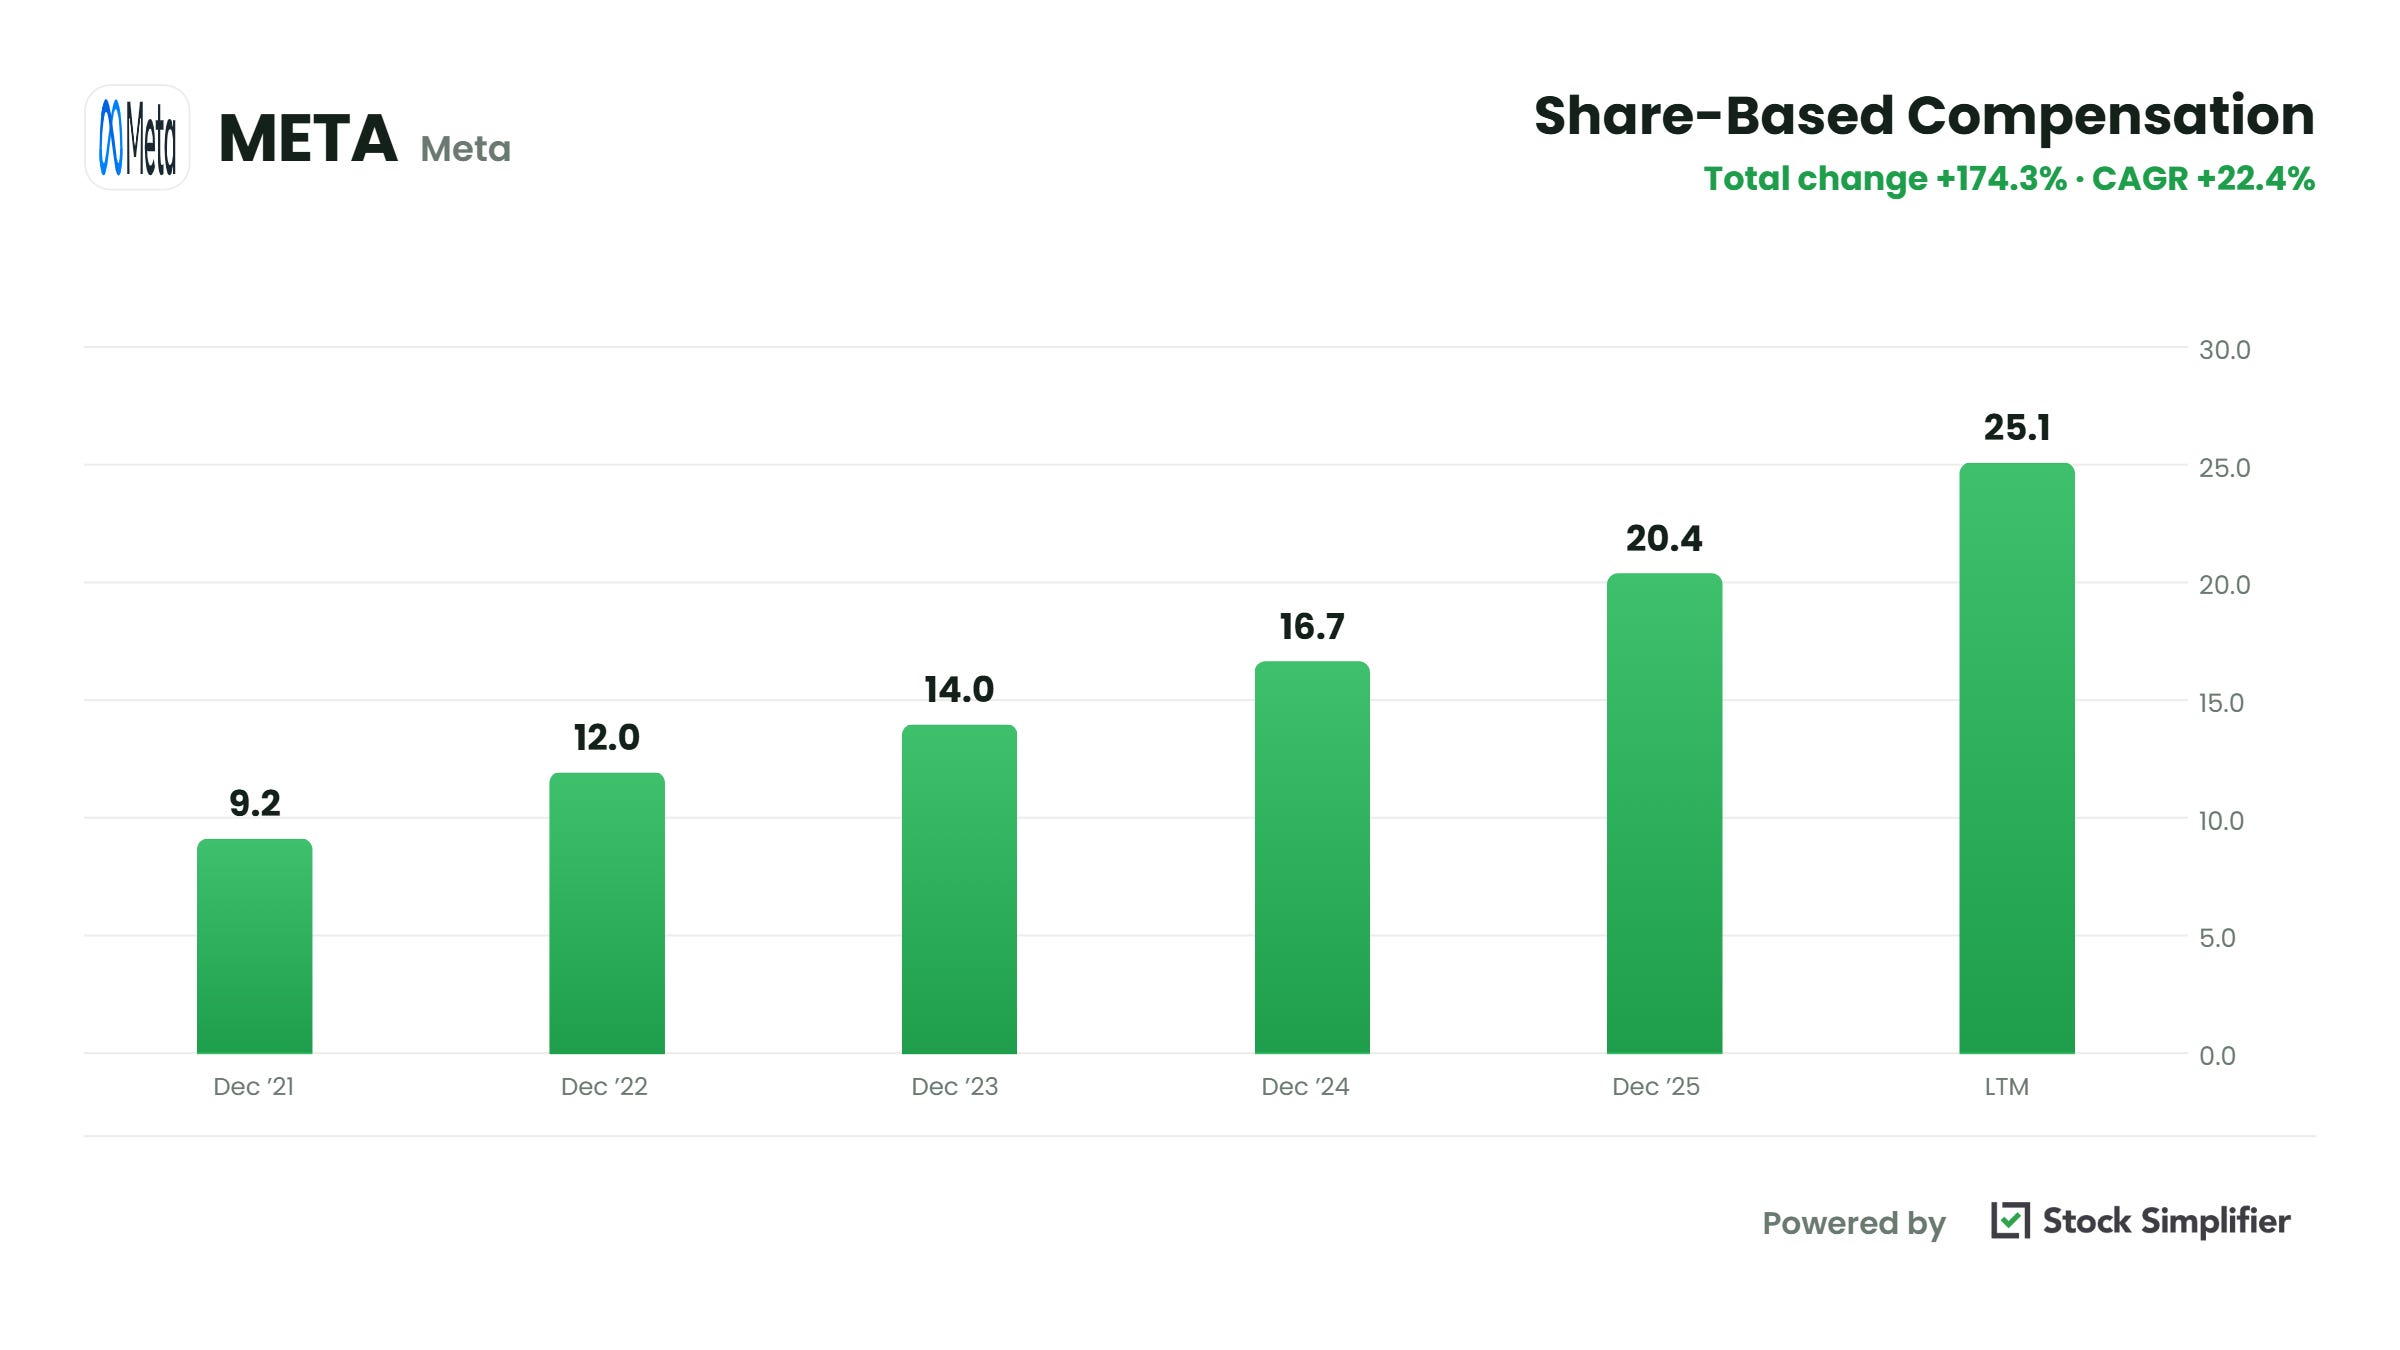
Stock-based compensation: $20.4 billion. Meta paid employees in shares. No cash moved.
Start at $60.5 billion, add those two, and you’re at $99.5 billion. The remaining $16 billion or so is deferred taxes and working capital.
Now a warning on that second add-back, because it’s the one that fools people.
Stock comp gets added back because it isn’t cash. It is still a cost. And look at the trend: $9.2 billion in 2021, $20.4 billion in 2025, $25.1 billion on an LTM basis. Total change of 174% over a span when revenue grew 94%.
Meta’s employees are being paid in ownership, and that bill is growing roughly twice as fast as the business. Companies that lean hard on “adjusted” earnings love to pretend this expense doesn’t count. It counts. I’ll show you the receipt in a minute.
Investing: what does it cost to stay in business?
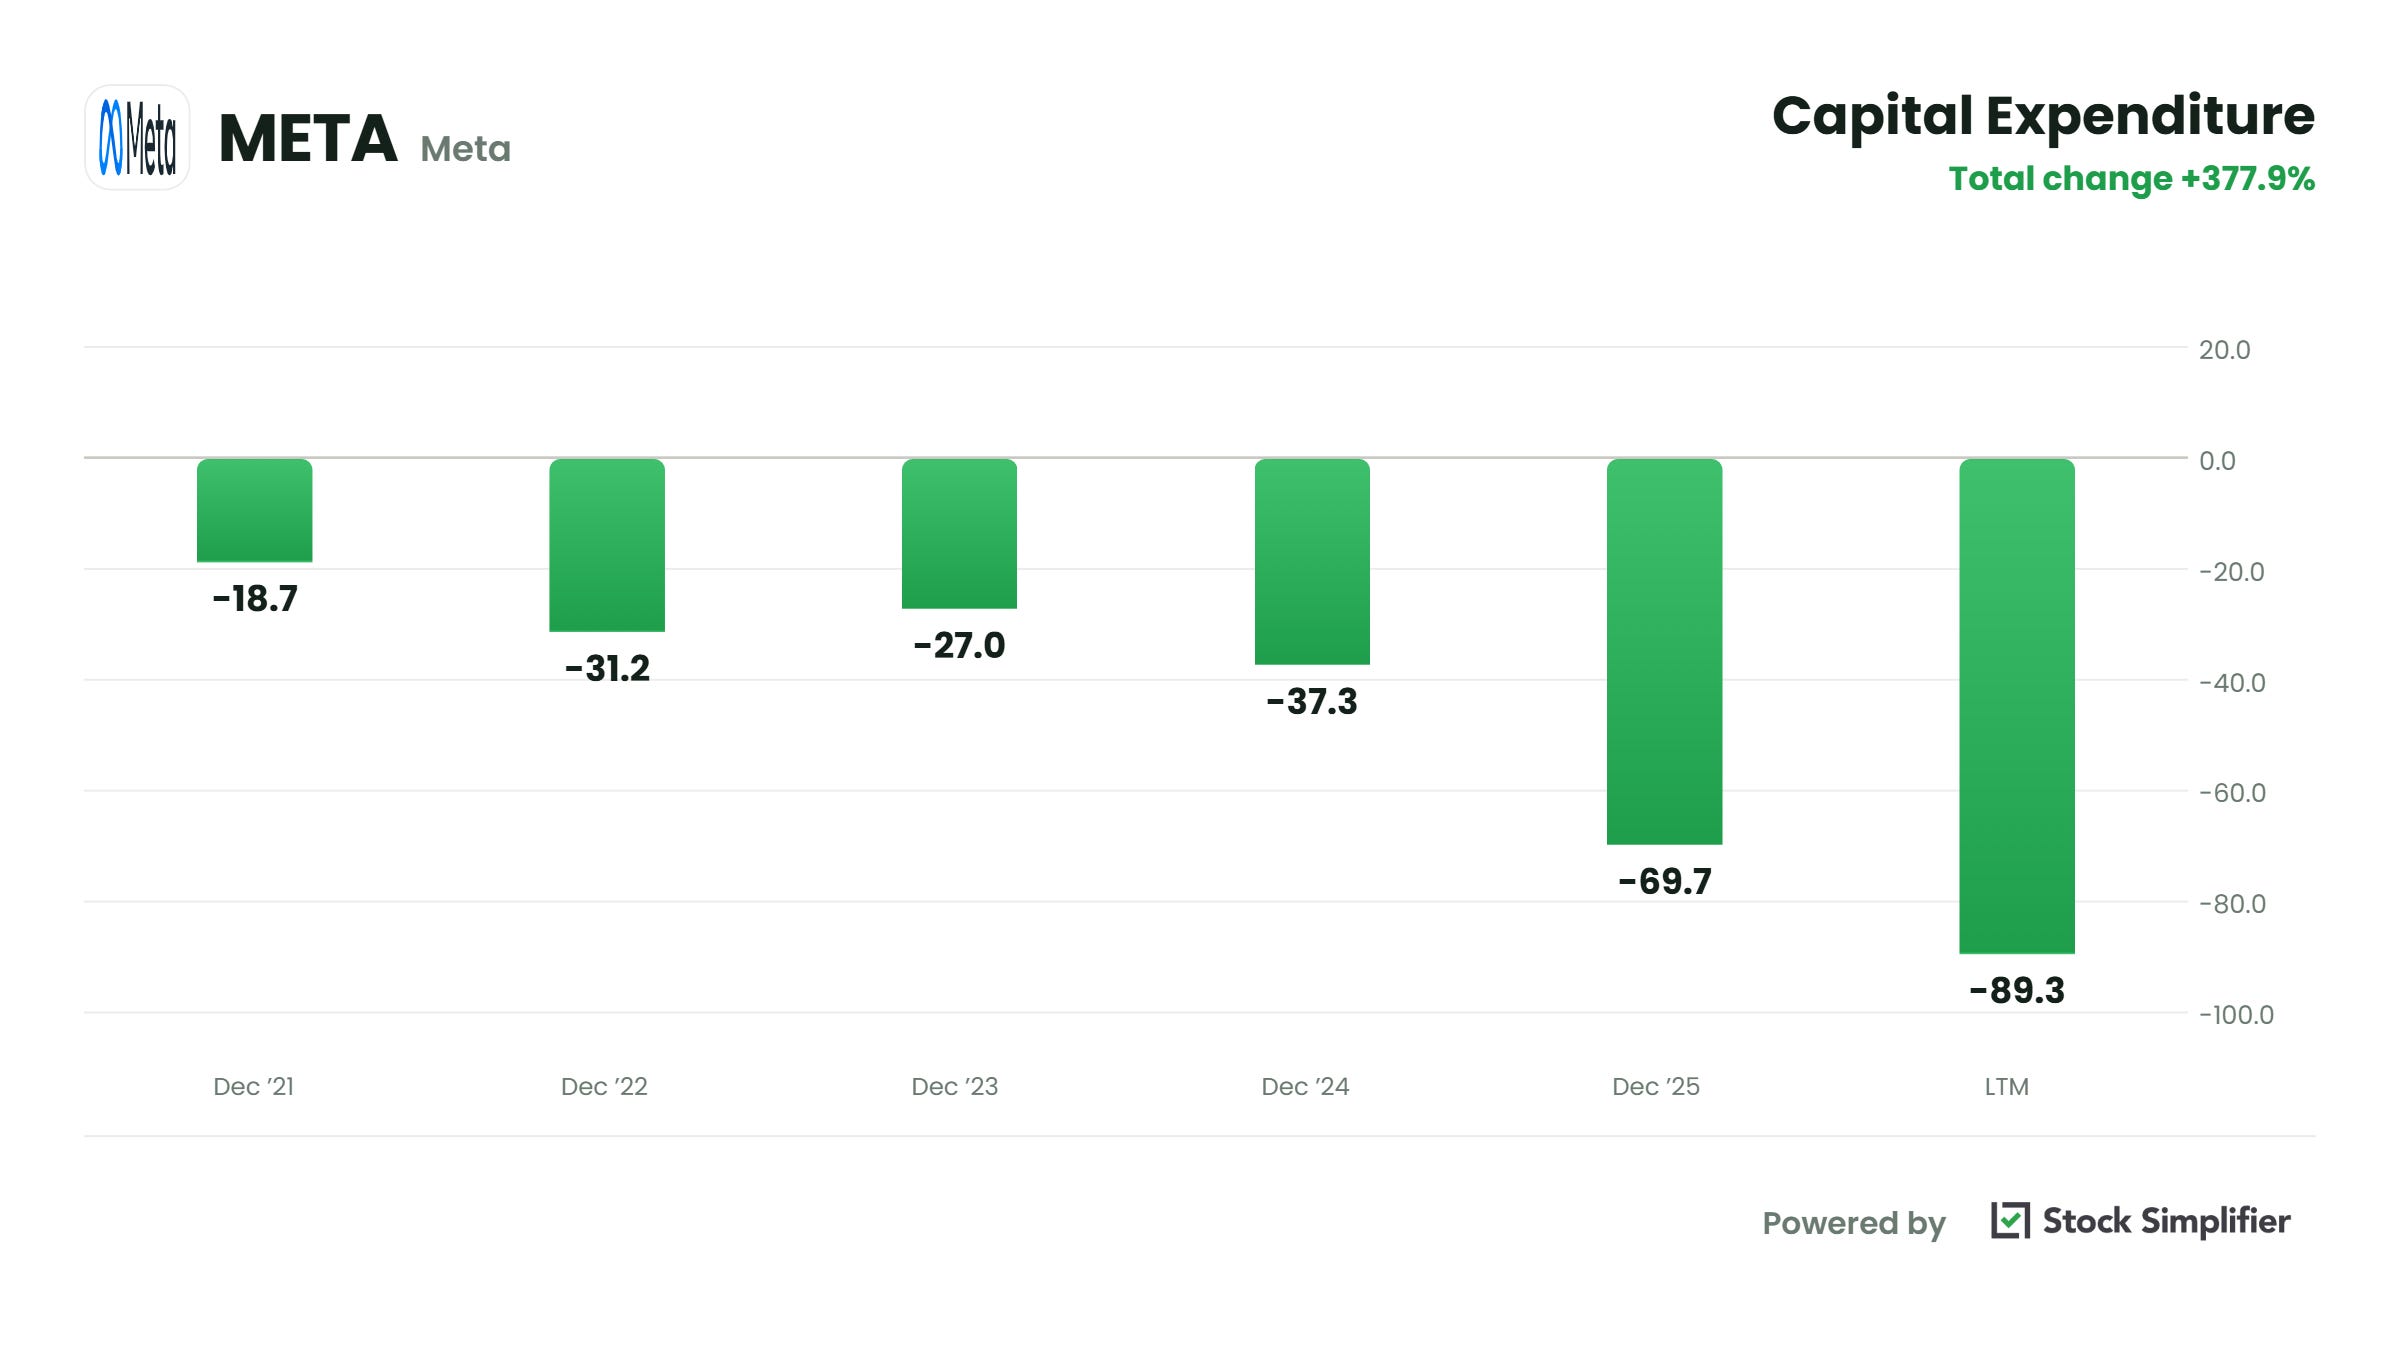
Capital spending nearly doubled in 2025 and is still climbing. AI data centers, chips, power.
Operating cash flow tells you the business generates cash. This section tells you how much of it goes straight back out the door to stay in the game.
Every business has a version of this. My Tesla needs new tires whether I’ve planned for them or not. That cost never shows up in how I think about my income. It shows up in my bank account.
Free cash flow: what’s left
Operating cash flow minus capital spending.
In 2025, operating cash flow rose $24.5 billion and free cash flow fell $8.0 billion. Capex ate the difference and then some, $32.4 billion more than the year before.
Worth knowing: free cash flow isn’t a GAAP-defined number, so definitions differ. This chart uses operating cash flow minus capex and gets $46.1 billion for 2025. Meta’s own press release also subtracts finance lease payments and reports $43.6 billion. Neither is wrong. When you see free cash flow quoted, find out which version you’re looking at.
Free cash flow is the money available for dividends, buybacks, acquisitions, and paying down debt. It matters more to me than net income, more than EBITDA, more than anything on the income statement.
Whether Meta’s AI spending pays off is unknowable today. What’s knowable is that this is the pool everything else gets funded from, and it’s smaller than it was in 2024.
Financing: where does the leftover go, and did it work?
In 2025 Meta spent $26.2 billion buying back stock and $5.3 billion on dividends. Roughly $31.6 billion returned against $46.1 billion of free cash flow. About 69% out the door.
Now the receipt.
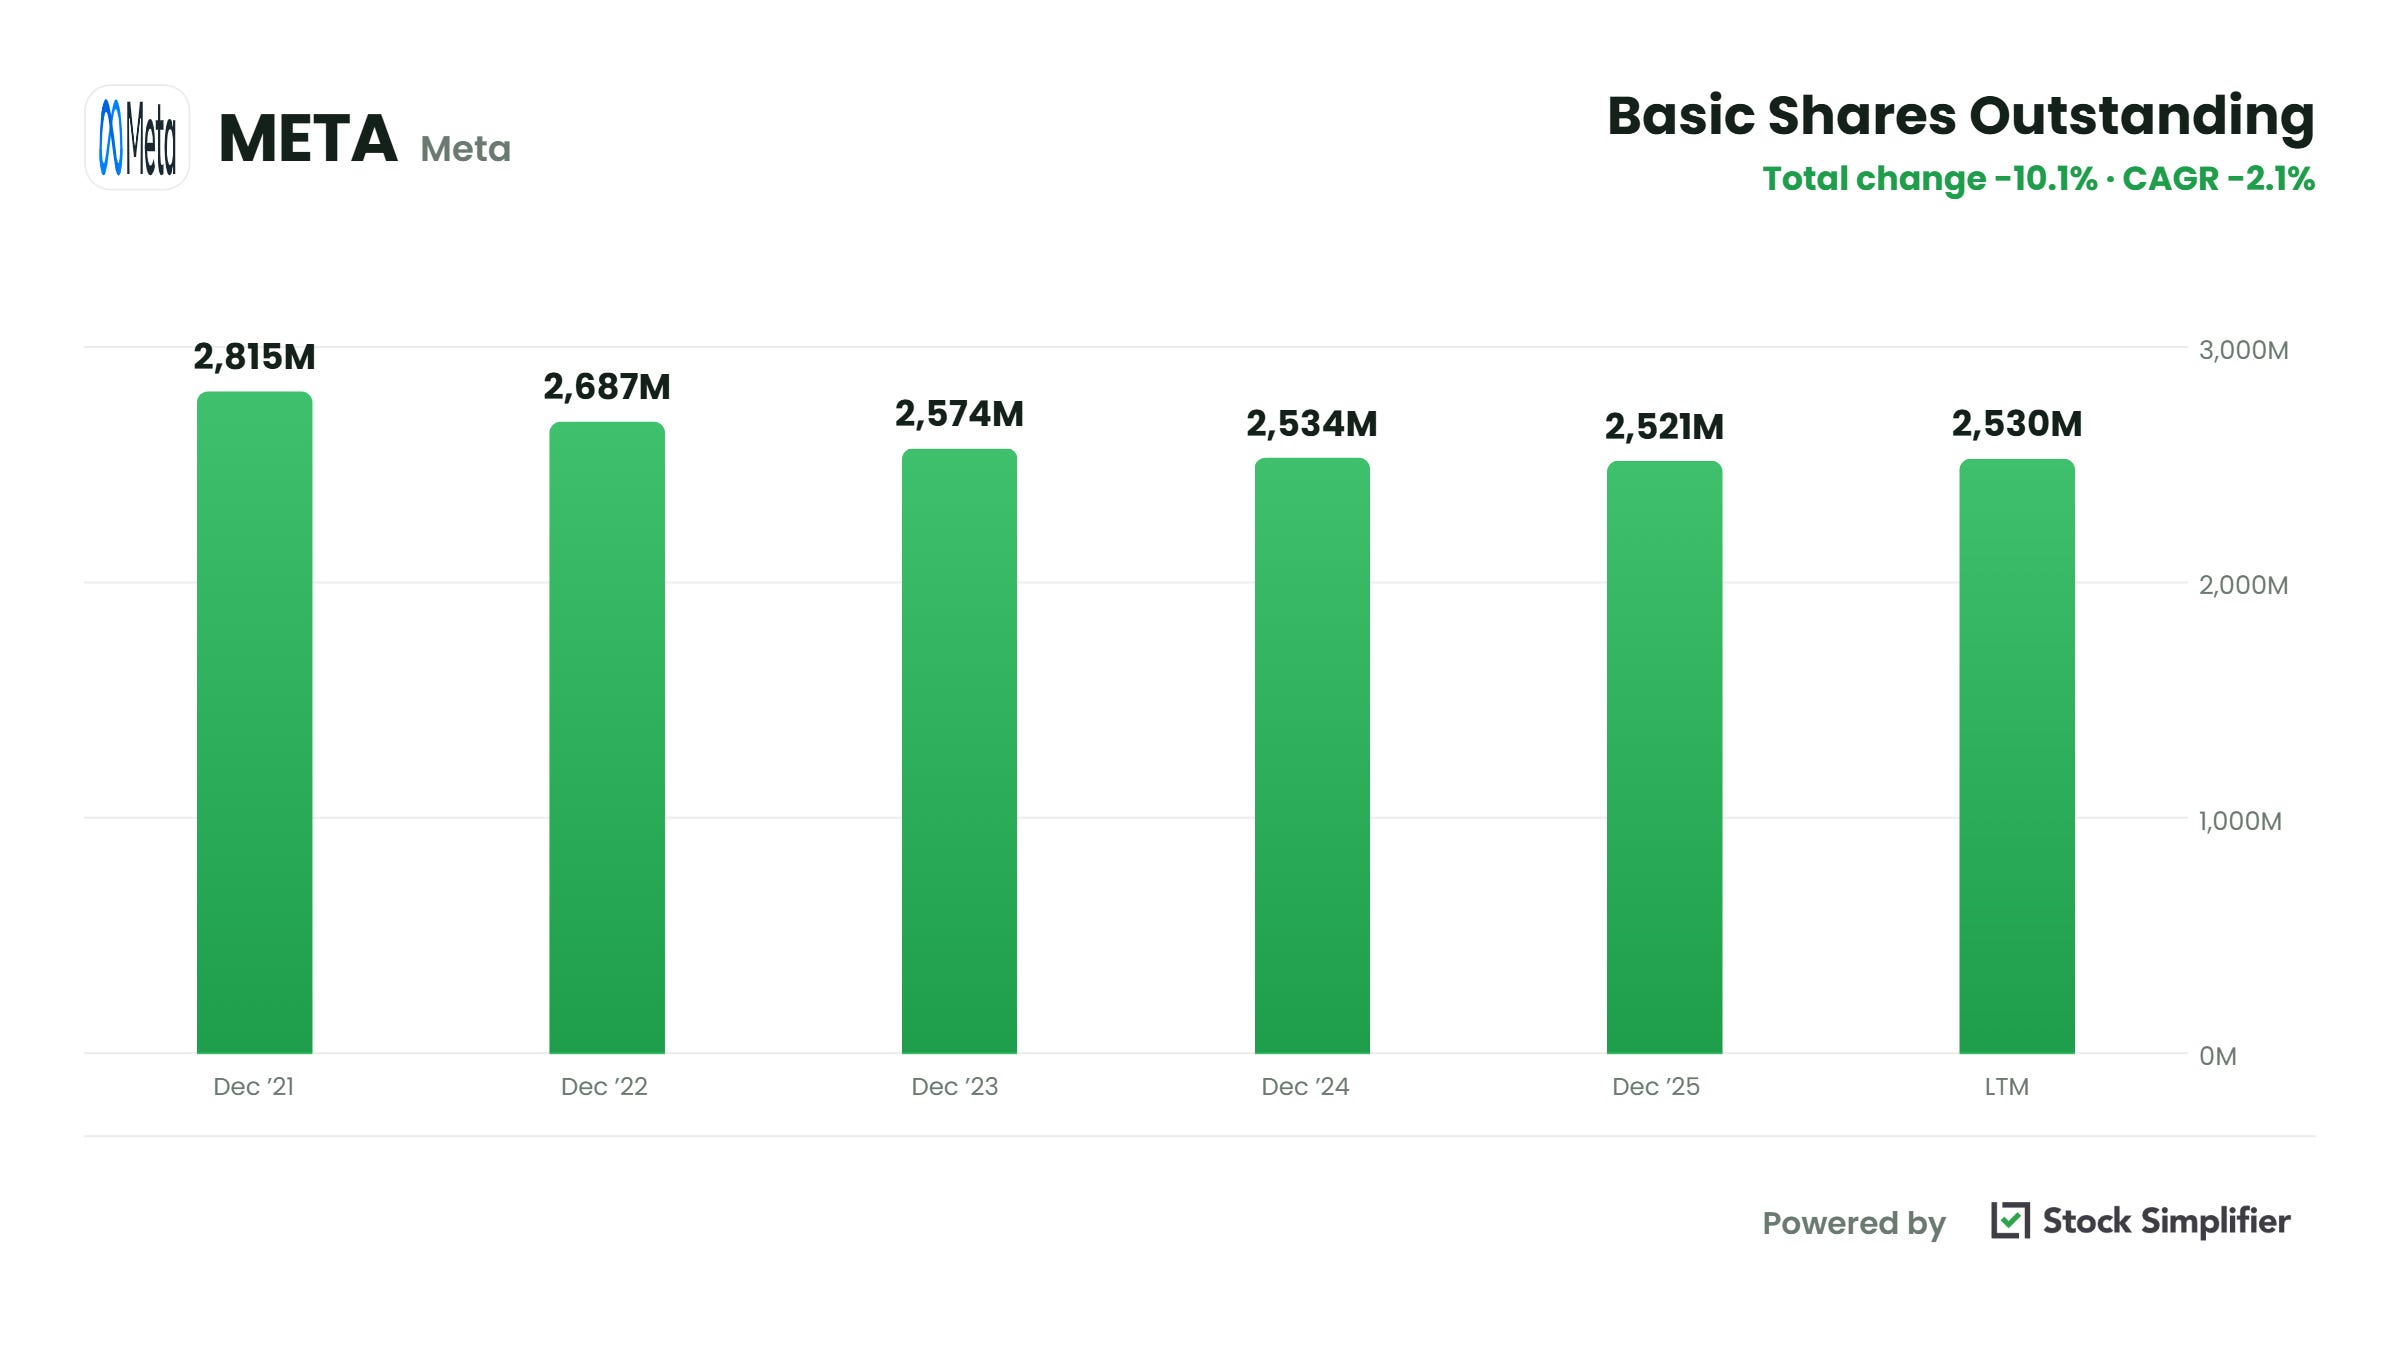
Basic shares outstanding went from 2,815 million in 2021 to 2,521 million at the end of 2025. Down about 10%. Fewer owners, same company.
But look at the last two bars. Between 2024 and 2025, $26.2 billion of buybacks moved the share count from 2,534 million to 2,521 million. Thirteen million shares. Half a percent.
And the LTM bar goes back up, to 2,530 million.
That’s what a $25 billion stock comp bill does. Meta is buying shares back with one hand and issuing them to employees with the other, and the issuing hand has caught up.
This is the check I run on every company that announces a buyback. Ignore the press release. Look at share count. Plenty of companies spend billions repurchasing stock and dilute you anyway.
One more comparison, because the financing section is also where you catch overreach. In 2022 Meta’s free cash flow was $19.3 billion. It bought back $28.0 billion of stock. It returned $8.7 billion more than it produced.
Meta could absorb that. It was sitting on a mountain of cash and the stock had fallen 64%, so in hindsight it was a great trade. A company with $3 billion in the bank and $2 billion of debt coming due cannot, and that’s exactly the company that keeps buying back stock right up until the morning it announces a capital raise.
One check to run this week
Pull up a company you own. Find net income. Find free cash flow. Put both on the screen, five years.
If free cash flow roughly tracks net income, the earnings are real.
If net income keeps climbing and free cash flow doesn’t, you have a question to answer, and it’s almost always the most important question about that business.
Meta’s answer is $89 billion of capital spending. Yours might be worse.
Wishing you investing success,
Brian
Comments
Nothing yet. Say the first thing.
Sign in to join the conversation.