
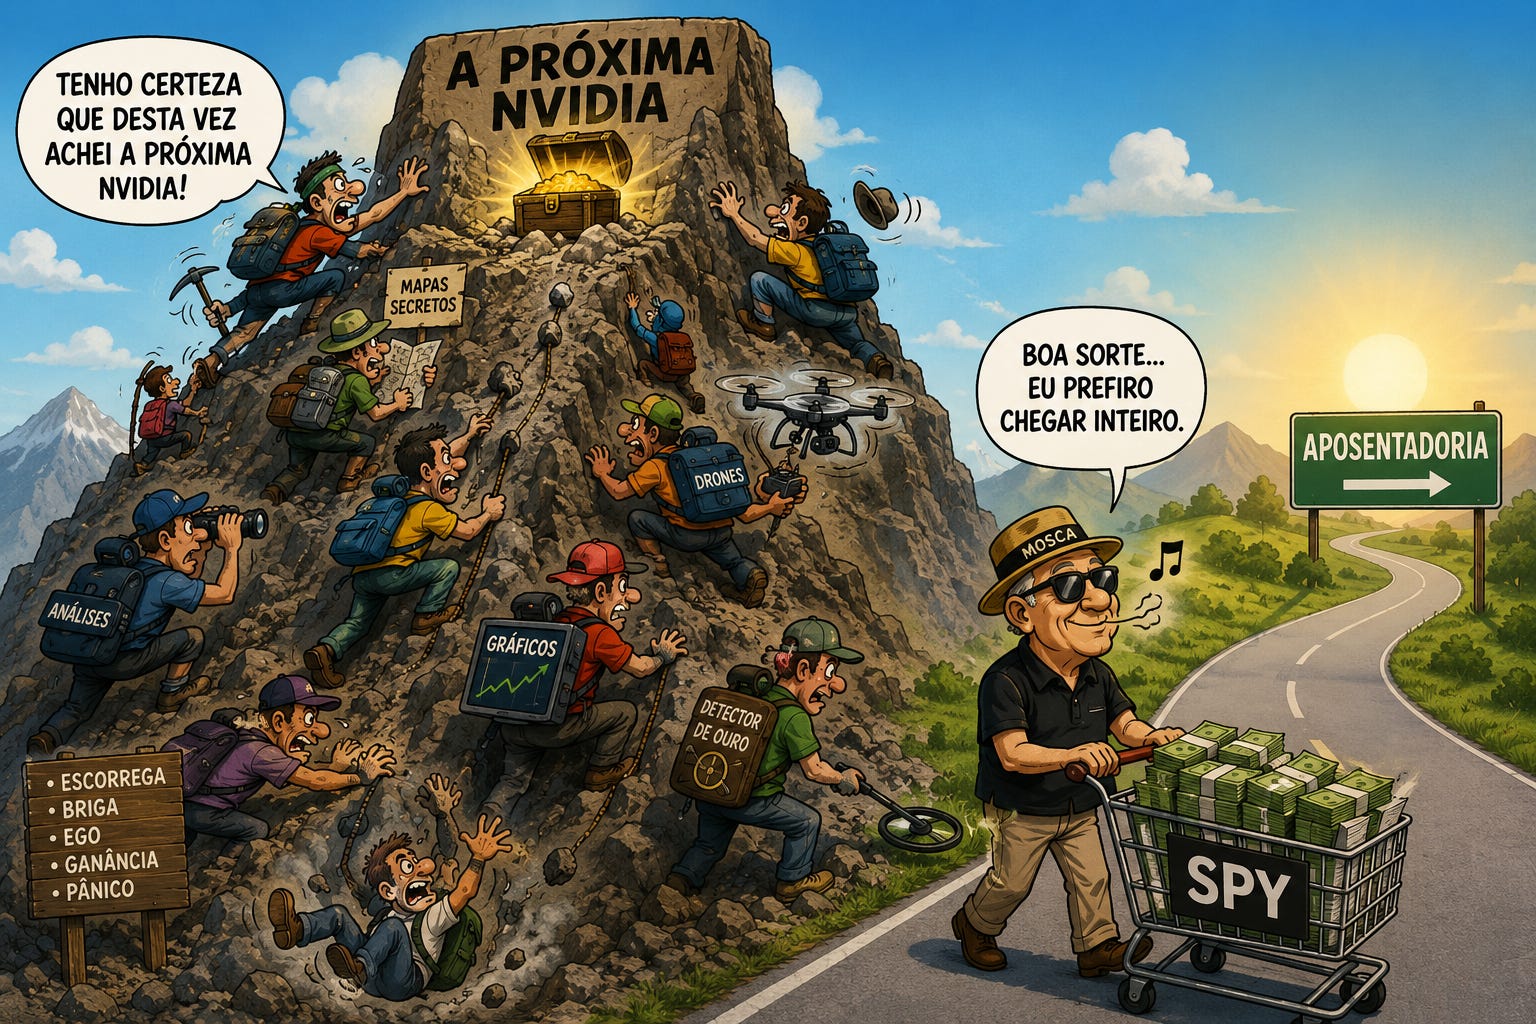
Did you fall for my trap? After all, Mosca has always said he doesn’t recommend individual stocks. It’s just a marketing hook—hahaha. I’m pretty sure we’d all love to pick the next Nvidia—that stock that multiplies exponentially and sets up early investors for life. Will it be SpaceX? Or, once they go public, OpenAI or Anthropic? Is there still time to buy Micron, even though it’s already surged? Don’t ever expect a tip like that from me; as you’ll see below, the market darling of the moment often disappoints over time.
In my view, the best approach is to buy SPY or competing funds that track the market-cap-weighted S&P 500. With this type of vehicle—as I’ve mentioned before—the most sought-after stocks gain weight, taking the place of those losing value. This adjustment happens automatically, without anyone needing to make a decision: when a company’s value rises, its market cap grows and its share of the index increases automatically, without a single real changing hands; when it loses value, the opposite happens, and if the drop is steep enough, the index’s methodology itself drops the company and replaces it with another.
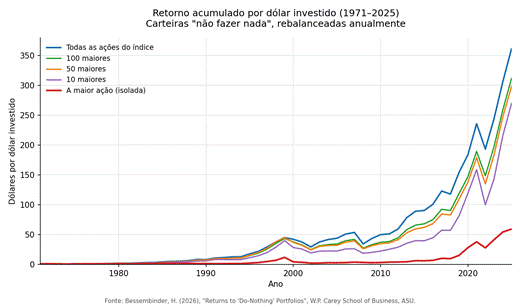
The index lets winners run and gradually sheds losers without you having to hit a buy or sell button, and without the decision depending on your mood, your current conviction, or your ability to predict the market’s next favorite. It is essentially the psychological opposite of picking individual stocks—a situation where, every day, you’re tempted to second-guess yourself, buying more during the euphoria or selling in a panic. Over time, you end up with a portfolio that moves with the market flow—not trying to score a massive windfall, but maintaining a measured stake in the market’s favorites. Hendrik Bessembinder, a professor at Arizona State University’s W. P. Carey School of Business, published a study in July 2026 titled “Returns to ‘Do-Nothing’ Portfolios.” In it, he reconstructs 55 years of year-by-year returns based on the components of the S&P 500 itself, and he is categorical on this point: betting every year on the index’s largest stock was, historically, a poor strategy. Anyone who did so between 1971 and 2013 turned one dollar into just over four, whereas the full index turned that same dollar into nearly eighty.
International Business Machines was the index’s largest stock for most of the 1970s and 1980s, posting declines of up to thirty percent in some of those years. General Electric took over the top spot in the 1990s and the first half of the 2000s, followed by Exxon Mobil until the beginning of the last decade. The following chart, reconstructed from the study’s data, clearly illustrates the picture: the line representing the full index portfolio easily outperforms portfolios concentrated in the largest stocks throughout almost the entire period, while the line for the single largest stock spends most of its time at the bottom.
The advantage that the largest stock of the moment has shown over the last dozen years is atypical; much of its luster is owed to a single extraordinary success story—Apple. Buying the entire index, rather than the market darling of the moment, also has the advantage of shielding you from the predictions of fundamental analysts—who get things right and wrong in the same proportions as always—and aligns your decisions with behavioral finance, which is where, at this stage of my life, I prefer to place my bets.
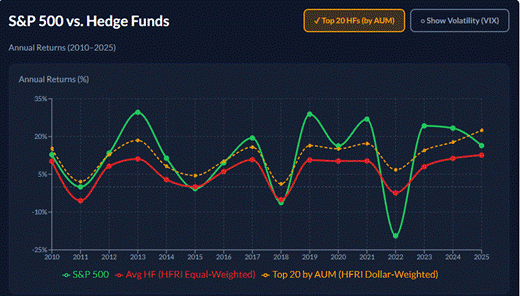
Hedge funds are out of the question as an alternative to this disciplined approach. A survey by RIABiz using HFRI index data shows that, between 2010 and 2025, the average hedge fund outperformed the S&P 500 in only three years—2015, 2018, and 2022—and even then, only because they lost less than the index, which fell more sharply during those periods. In all the other thirteen years of the series, a simple index fund would have left the investor with more money in their pocket than the average hedge fund—despite the array of renowned managers, sophisticated strategies, and steep management fees.
The attached chart shows the full series: even the twenty largest funds by assets under management beat the index in only seven of the sixteen years analyzed—a slightly better track record, yet still inconsistent. The fundamental issue is that this asset class is supposed to provide diversification and reduce correlation with the stock market, yet the opposite is observed: hedge funds generally rise and fall in tandem with the stock market, albeit with less intensity—an undesirable correlation for those paying a premium for protection.
I’ve learned from life—and perhaps with age—that the simplest things are usually the best. If you need to become a finance expert just to understand an investment, I generally wouldn’t recommend it. And if I could offer one piece of advice to my readers: don’t go looking for that one “retirement stock,” and don’t try to get rich overnight. In the latter case, you’d be more honest with yourself just playing the lottery.
Technical Analysis
In the post “EM=ET,” I made the following comments regarding the Ibovespa:
“I initiated a long trade at the 174.2k level, as mentioned in the post above. I have to say, it takes a lot of courage to enter a trade during a correction—especially a ‘Wave B.’ As an old guru I used to follow used to say, ‘Wave Bs are profit killers.’”
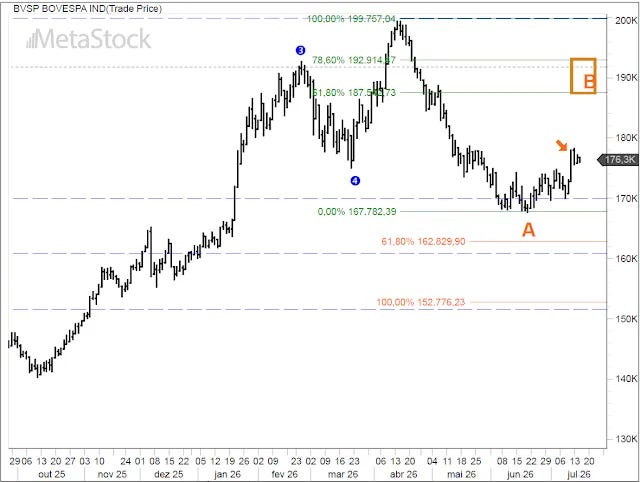
We were stopped out of the trade last week. In the previous post, I described what bothered me about the operation—mainly the fact that it was a Wave B. What is the psychology behind these waves? Since they move in the direction of the original trend—in this case, an uptrend—they can be violent: buyers pile in, believing they’ve found a bargain, while short sellers get caught off guard and are forced out of their positions by stop-loss orders. However, sometimes that doesn’t happen, and the price action becomes erratic—two steps forward, followed by one to one-and-a-half steps back.
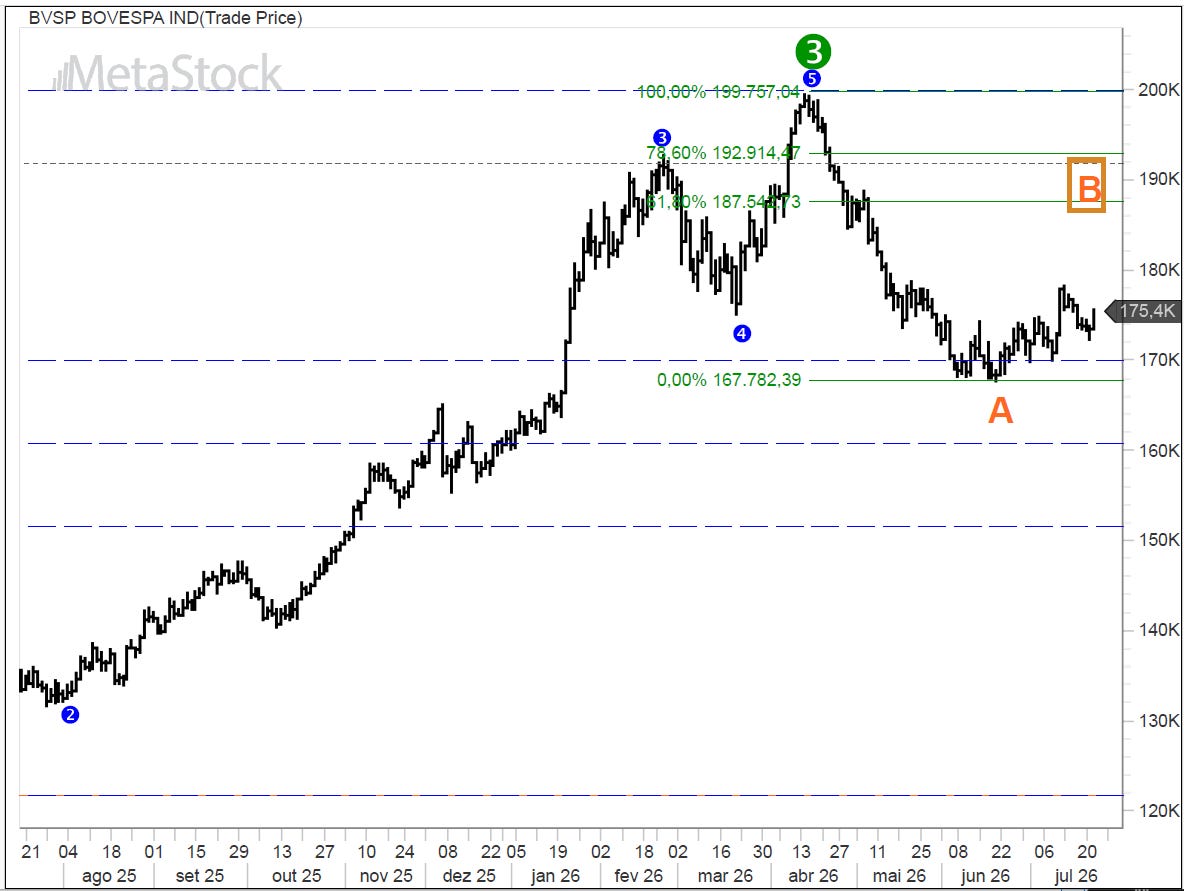
So, where do we stand now? I’m waiting for the rally to play out; if it reaches the levels marked in the orange rectangle, I’ll consider the possibility of a short trade.
— Wait a minute, David—say what? You’re going to suggest a short trade? I don’t recall you ever doing that before.
You’re right; it’s very rare. But in this instance, the red Wave A looks “pretty”—or “by the book,” as the market jargon goes. Therefore, a red “C” wave is required—not yet visible—which should reach levels below the red “A” wave, around the 160,000 mark (a figure subject to further calculation). Furthermore, while I am working with a medium-term bullish scenario, if the market drops below 151,000 and, crucially, breaches the 134,000 level, the situation changes entirely, and I will shift from a bullish to a bearish stance. In any case, based on current observations, this latter scenario does not appear likely. Would a solvency crisis be the trigger? That is not for me to predict.
The S&P 500 closed at 7,499, down 0.14%; the USDBRL stood at R$ 5.0662, down 0.41%; the EURUSD was at € 1.1411, up 0.12%; and gold traded at US$ 4,134, up 1.40%.
Stay tuned!
Original Post: Click Here
This is not an investment recommendation.
About the Author of this Post: David Gotlib has 45 years of experience in investment management. An engineer from Polytechnic School of the University of São Paulo, he was one of the founders of the first Brazilian hedge fund in 1993 (AUM US$ 1 billion). Later, he was Managing Director of Deutsche Bank Asset Management (AUM R$ 2.2 billion) until the company was sold to Bradesco. He is currently the manager of his own investment portfolio and the author of the blog Acertar na Mosca, where, since 2011, he has shared his thoughts on the global economy and the financial market on a daily basis.
Comments
Nothing yet. Say the first thing.
Sign in to join the conversation.