

I’ve noticed that more and more Brazilians are looking for investment opportunities abroad. This is a very healthy trend, since we’ve long been told not to put all our eggs in one basket—although lately, diversification itself has become more challenging. The track record of investing in the Brazilian stock market has been disappointing, with erratic returns over the past few decades. And since the goal isn’t to trade in and out quickly, it’s only natural for these investors to feel hesitant about expanding internationally.
If you’ve followed me for more than 15 years and have developed some confidence in technical analysis, simply compare the charts of the U.S. and Brazilian stock markets. You’ll notice that the U.S. market has maintained a long-term uptrend, while the Brazilian market has been largely cyclical.
I remember making this decision back in 1999, while working at Deutsche Bank. I was struck by how concentrated the Brazilian market was in just a handful of stocks, and I asked myself: why should I limit myself when there are thousands of investment opportunities abroad? That realization started my learning process, and 25 years later I remain convinced that international diversification is an essential component of any well-built portfolio.
But how should investors approach this process? By studying and analyzing the past—and, of course, by reading Mosca. Today I’m bringing you a long-term study produced by managers at Tamarisk Capital Management and Quoin Capital Analytics that sheds important light on a risk that most investors moving overseas prefer not to confront directly.
The study draws on 155 years of data compiled by Robert Shiller, the Yale economist who won the Nobel Prize in part for building this dataset. Its conclusion is uncomfortable: since 1871, roughly 35% of U.S. stock market history has consisted of “lost decades”—periods lasting between 13 and 25 years during which a buy-and-hold investor earned no real return. There have been three such episodes: 1929–1954: 25 years, with a maximum real drawdown of 77%; 1966–1982: 16 years, marked by the inflationary shock of the era; 2000–2013: 13 years, spanning both the dot-com crash and the 2008 financial crisis.
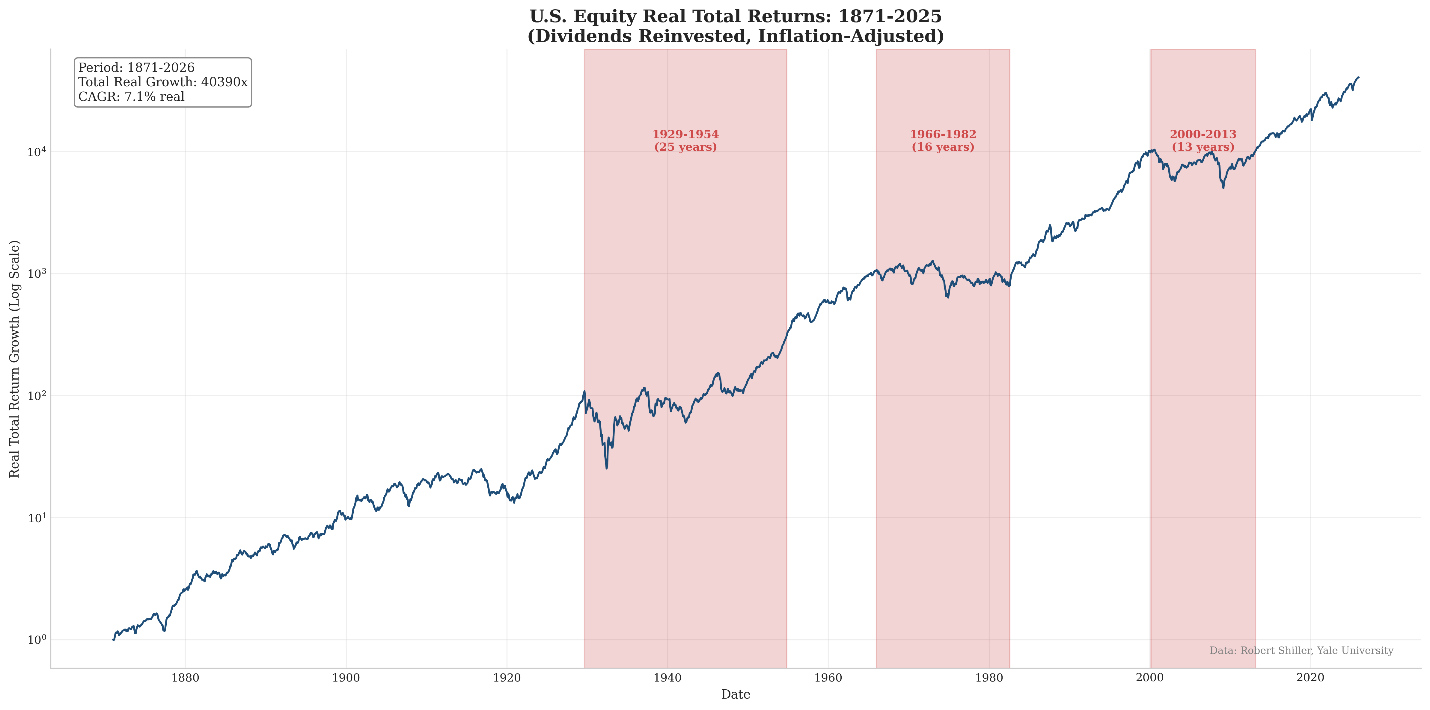
This challenges the familiar mantra that “stocks always pay off in the long run,” which underpins much of the stocks for the long run philosophy taught in personal finance books. The historical average real return of 7.1% per year is indeed real—but it conceals a crucial detail: across the full historical record, 16% of all rolling 20-year periods delivered less than 3% annually in real terms. In other words, there has historically been about a one-in-six chance that two entire decades of an investor’s accumulation phase would generate essentially no meaningful return.
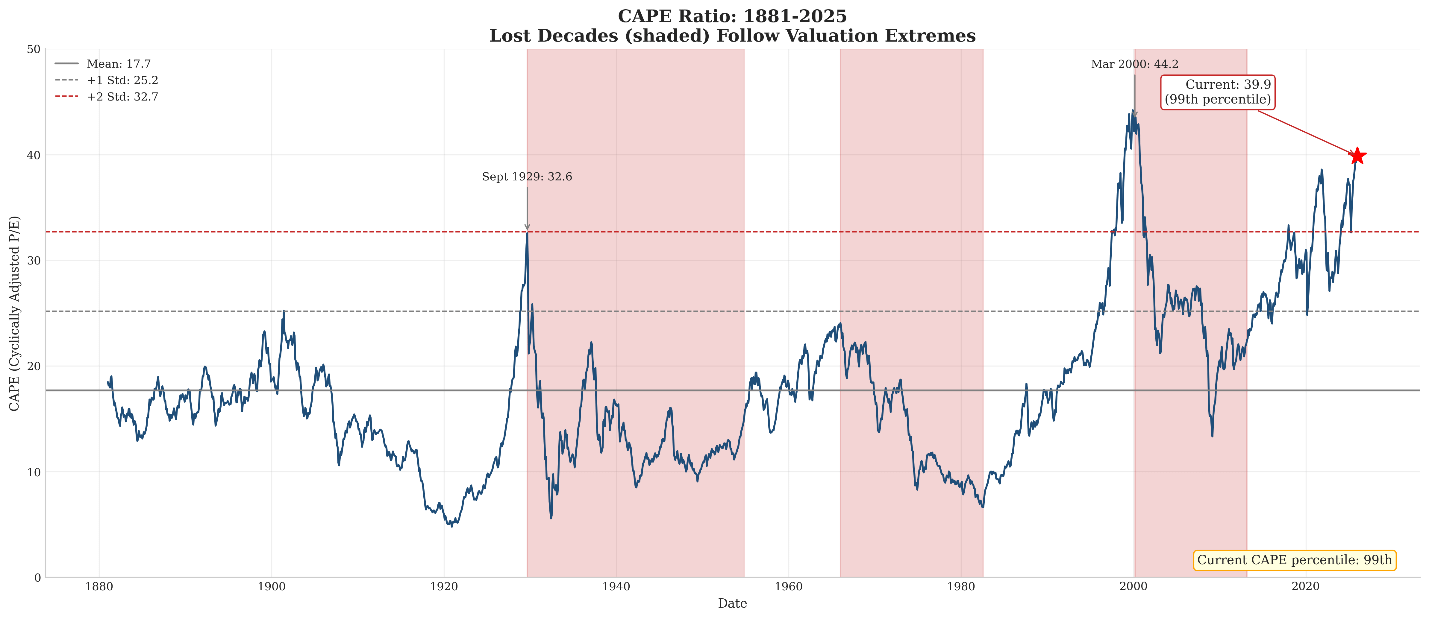
The reason I bring this up alongside the case for international diversification is the valuation measure used by the study to assess today’s risk environment: the CAPE ratio (Cyclically Adjusted Price-to-Earnings ratio), developed by Shiller himself.
Since 1881, the CAPE’s historical average has been 17.7. Today, the U.S. CAPE stands at 39.9, placing it in the 99th percentile of the entire historical series, exceeded only by the peak in March 2000—the very moment that preceded the last lost decade.
I’m not saying the U.S. stock market is about to repeat 2000. But the study makes an important point: valuation isn’t useful for predicting when markets will fall; it’s useful for assessing how fertile the ground is for a major decline, if and when it occurs.
The international comparison reinforces this point. Japan’s Nikkei Index peaked in December 1989 at nearly 39,000 points and only returned to that level sustainably in 2024—35 years later. The Euro Stoxx 50 peaked in March 2000 and didn’t recover that level until late 2025, representing 25 years of nominal stagnation for buy-and-hold investors. Of the four major developed-market blocs, three experienced generational lost decades beginning around the end of the 1990s. Only the United States has escaped that fate—so far.
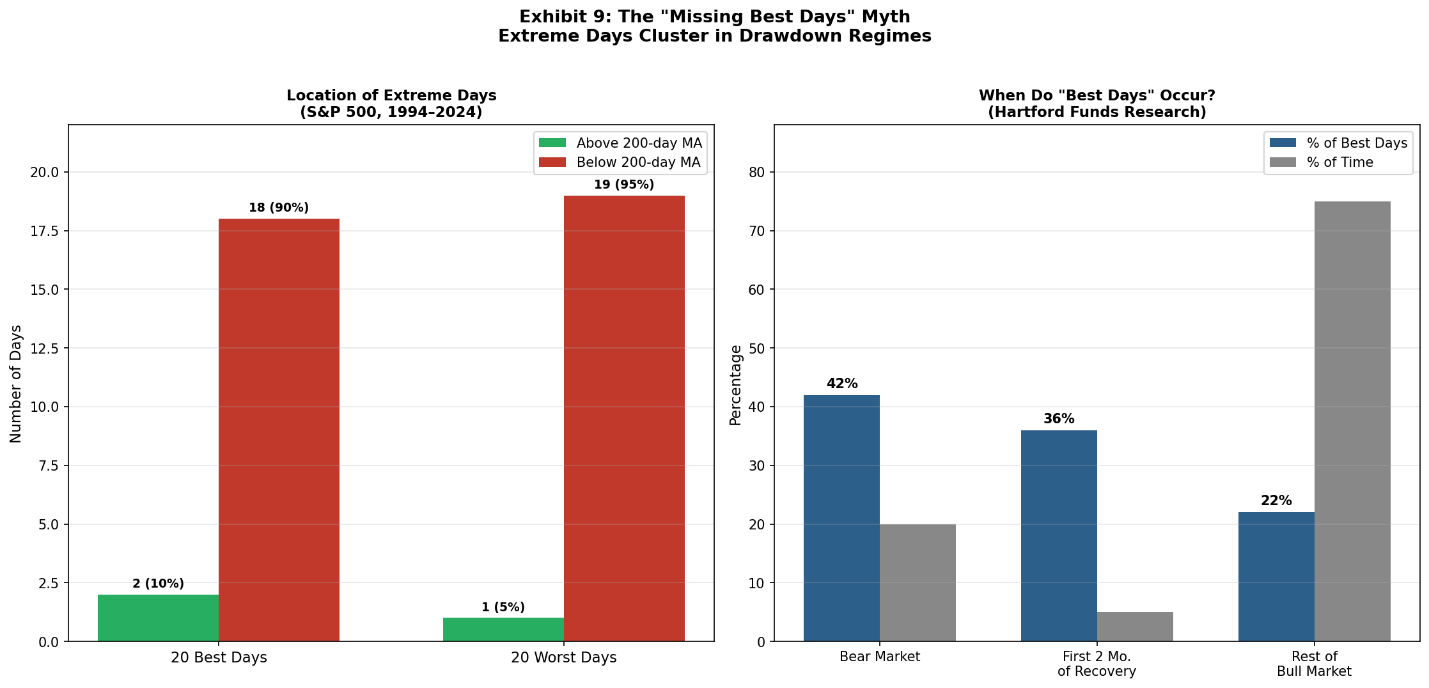
The study also makes a technical argument worth highlighting because it dismantles one of the most common myths promoted by advocates of “stay invested at all costs”: the idea of the market’s “best days.” Conventional wisdom says that missing just the ten best trading days over several decades would cut total returns roughly in half, and therefore investors should never reduce their market exposure. But the data tells a different story. Ninety percent of the twenty best trading days in the S&P 500 since 1988 occurred while the index was trading below its 200-day moving average—in other words, during bear markets, not bull markets. The best days and the worst days are born together, during the same periods of market stress. You don’t get one without the other. A disciplined defensive strategy that avoids the market’s worst days will, by definition, also miss many of its best days. Yet over complete market cycles, the mathematics suggests that disciplined risk management tends to reward investors who actively manage downside risk.
That brings us to the natural question raised by all this evidence: how can you remain invested for the long term without falling into the trap of enduring entire decades with no returns? This is precisely where technical analysis comes in—not as a crystal ball, but as a disciplined framework for reading risk.
Those who have followed me for a long time have probably noticed that there are periods when I appear more relaxed, allowing wider stop losses, and others when I work with much tighter stops. The reason lies in the Elliott Wave currently unfolding. Third waves—the strongest and most extended phases of a trend—allow for greater flexibility because the underlying trend tends to assert itself powerfully. Fifth waves, however, are terminal by nature and demand extra caution because momentum begins to fade and reversals can develop quickly. During corrective phases, I become even more conservative and rarely recommend trades because corrections are precisely when markets tend to generate the most false signals.
For long-term portfolio management, however, what matters isn’t timing each individual wave but recognizing structural trend changes. When the market undergoes a genuine change in direction, it’s time to reduce exposure. I combine technical analysis with fundamentals—in that order, not the other way around—which allows me to adjust my equity allocation within a predefined risk range. I realize that may sound theoretical, but only experience and discipline can ultimately build a portfolio that’s properly aligned with your own risk tolerance.
For those who don’t identify with this approach, here’s a simple rule: Set a stop-loss threshold for your overall portfolio—something between a 10% and 20% decline. If that threshold is reached, reduce your position by somewhere between 25% and 75%—never liquidate everything. The difficult part isn’t getting out. The difficult part is knowing when to get back in. And that’s exactly where technical analysis earns its keep. None of this is a reason to retreat from international investing—quite the opposite. I’ve advocated international diversification for the past 25 years, and I continue to do so.
But diversifying internationally doesn’t mean buying an index fund and forgetting about it. It means recognizing that even the strongest long-term uptrend in financial history contains the structural risk of prolonged periods of stagnation—and understanding that reality in time is what separates investors who preserve capital from those who merely accumulate good luck.
For readers just beginning this journey: parts of the study use fairly technical language. Don’t hesitate to use your favorite AI application to translate concepts such as CAPE, drawdown, and market breadth into plain English. That’s simply part of learning this new discipline.
Technical Analysis
In my post titled “The Proof of Eighteen,” I wrote the following about the IBOVESPA:
“It appears that a triangle may be forming, as highlighted by the red parabola below. If that’s the case, further declines should occur before any meaningful correction. Only a move above 175,000 would invalidate this scenario, in which case a red Wave B may already be underway.”
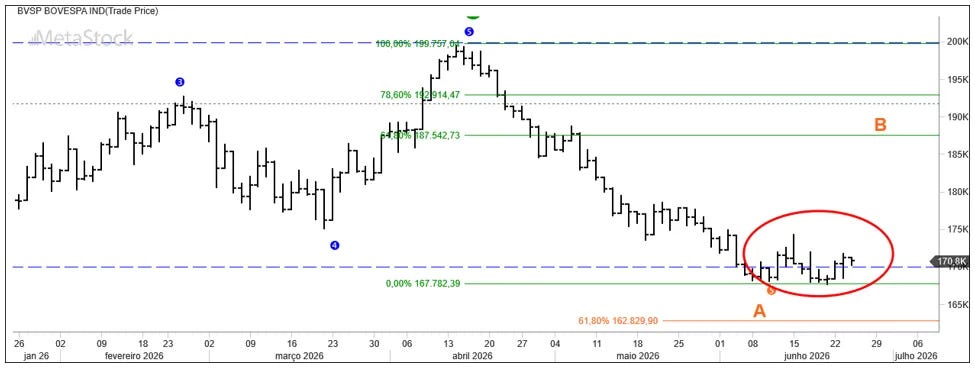
I still can’t take a more definitive stance. What I can say is that the market remains in a corrective phase, contained within the red ellipse. In situations like this, I look for additional clues by analyzing shorter time frames, as shown below. The possibilities are:
The red Wave B is underway, which would carry the index toward 187,500 (+10%) or 192,900 (+12%); or
The red Wave A has not yet finished, meaning further declines below 168,000 remain possible.
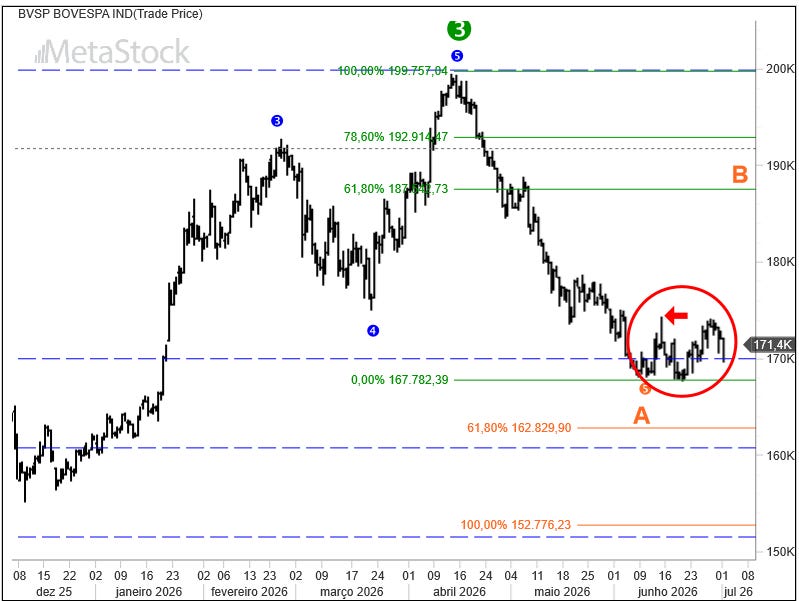
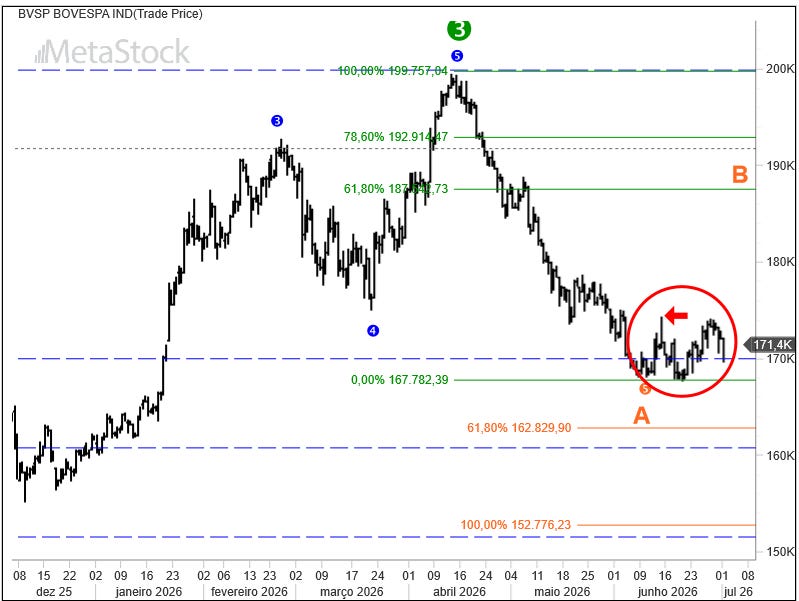
I consider the first scenario more likely for the following reason: We can clearly identify a five-wave decline that began in April and totaled roughly 20%. For that reason, I will wait for a breakout above the level marked by the red symbol at 174,200. Stay alert.
The S&P 500 closed at 7,483, down 0.22%; USD/BRL closed at R$5.2241, up 0.90%; EUR/USD ended at 1.1378, down 0.38%; and gold closed at US$4,035, up 0.70%.
Stay tuned!
Original Post: Click Here
This is not an investment recommendation.
About the Author of this Post: David Gotlib has 45 years of experience in investment management. An engineer from Polytechnic School of the University of São Paulo, he was one of the founders of the first Brazilian hedge fund in 1993 (AUM US$ 1 billion). Later, he was Managing Director of Deutsche Bank Asset Management (AUM R$ 2.2 billion) until the company was sold to Bradesco. He is currently the manager of his own investment portfolio and the author of the blog Acertar na Mosca, where, since 2011, he has shared his thoughts on the global economy and the financial market on a daily basis.
Comments
Nothing yet. Say the first thing.
Sign in to join the conversation.