
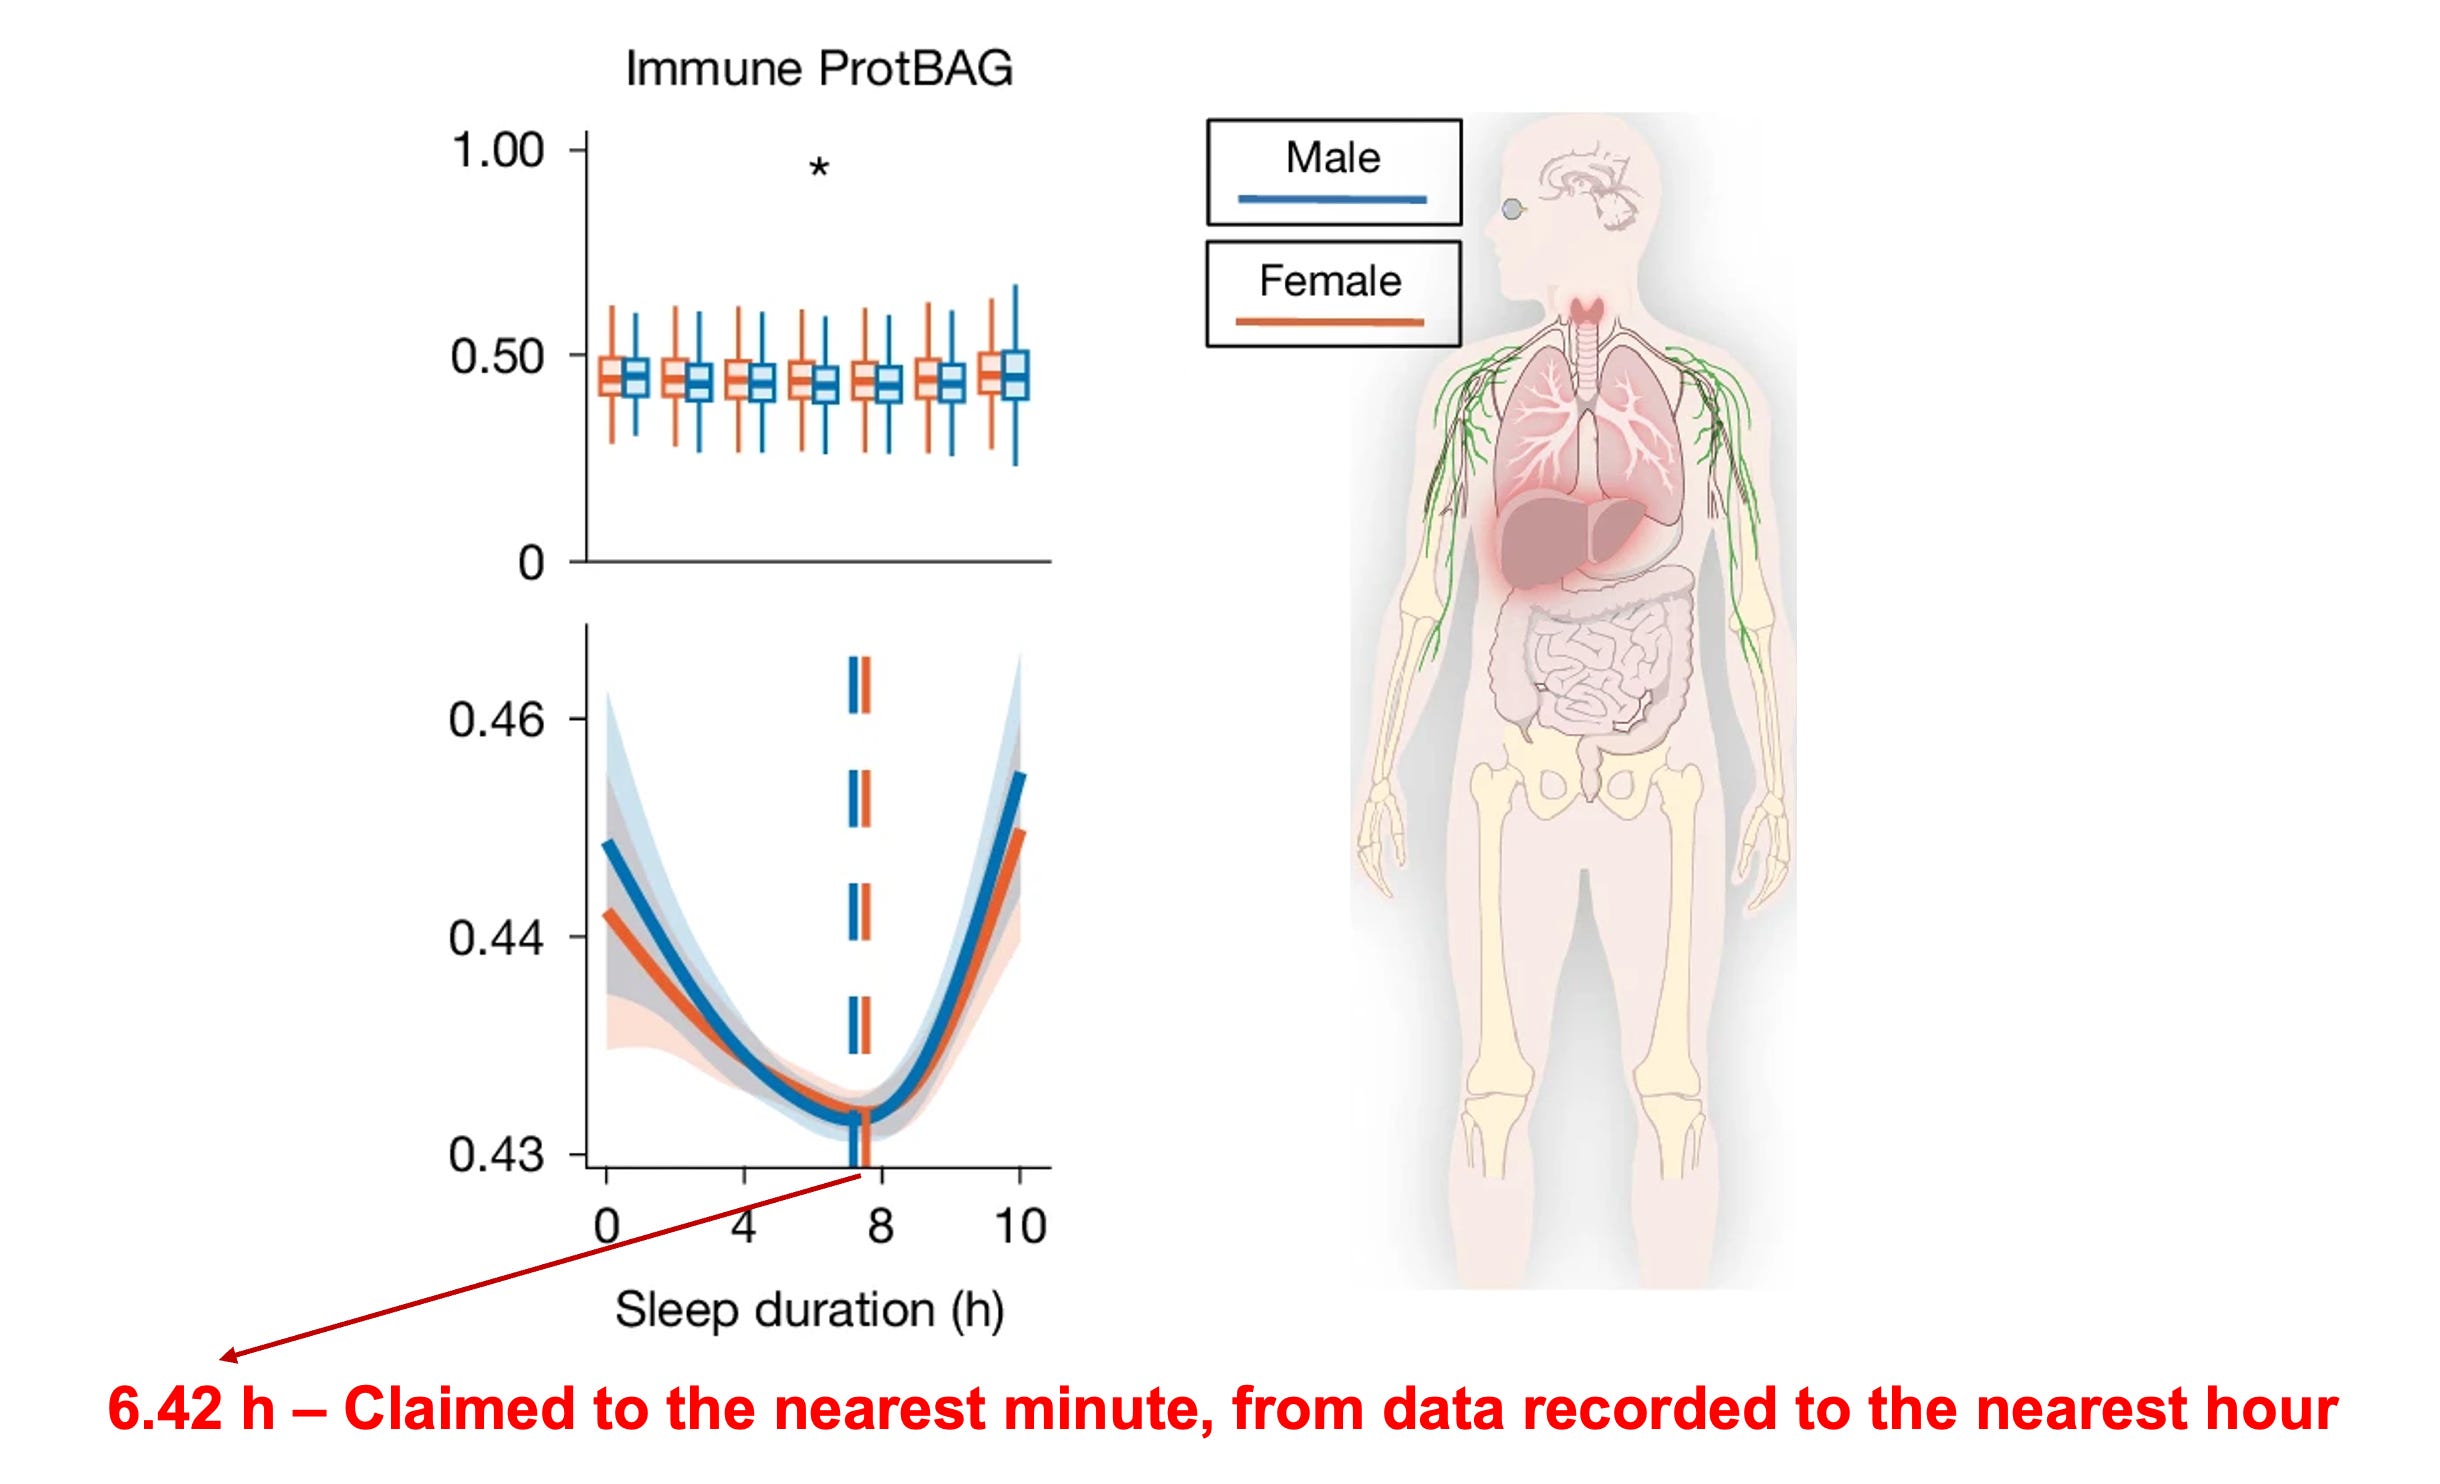
You have probably seen the headlines. A major study in Nature says the “optimal” amount of sleep for biological ageing is between 6.4 and 7.8 hours, and it varies by organ and sex, down to the nearest few minutes.
6.42 hours for the male brain. 7.82 hours for female blood proteins. Different organs, different numbers, decimal-point precision.
It sounds authoritative. It is already being translated into clinical advice and wellness content. And the precision is the problem.
The data behind these minute-level claims were collected with a single survey question, answered once, in whole hours. That gap (between the precision of the claim and the resolution of the measurement) is the core issue. But it is not the only one.
Thanks for reading Brain Trials! Subscribe for free to receive new posts.
The entire sleep measurement is one question
The authors analyzed over 300,000 participants from the UK Biobank. The sleep variable comes from a single, subjective item administered once at enrolment:
“About how many hours sleep do you get in every 24 h? (please include naps)”
Participants typed a whole number. That is the measurement. One subjective number, one time, including naps, to the nearest hour.
No sleep diary. No wearables. No sleep study. No distinction between weekday and weekend sleep. No separation of nighttime rest from afternoon naps.
When researchers have compared this type of single-item self-report against objective measures like wrist actigraphy or polysomnography, the agreement is poor (correlations of r = 0.28 to 0.47) and people systematically over-report by 30 to 67 minutes. Worse, the error is not random: healthy, efficient sleepers over-report the most. People with insomnia or depression under-report.
This means the measurement not only lacks precision, it actively distorts the shape of any curve you fit through it.
The authors used sophisticated statistical smoothing to draw a U-shaped curve through this integer-valued data. The curve looks smooth. But the smoothness comes from the statistics, not from the biology.
Reporting a population optimum of 6.42 hours from data recorded in whole hours is like measuring a room with a yardstick and reporting the answer in millimeters.
The hidden epidemic the study ignores
Obstructive sleep apnea (OSA) may be the single largest unaddressed confounder in the study.
In the UK Biobank, only about 1% of participants carry a formal OSA diagnosis. A supplementary analysis in the Nature paper excluding participants with three diagnosed sleep disorders did not materially change the U-shaped pattern - but this captures only the small fraction with formal diagnostic codes. But roughly 8% in the same cohort report core OSA symptoms (habitual snoring combined with choking or struggling for breath during sleep) without having a formal OSA diagnosis. In the general middle-aged population, moderate-to-severe OSA affects 10–17% of men. Most cases are undiagnosed.
Here is why this matters. OSA causes two things at once:
It makes people report longer sleep. People with untreated apnea spend more time in bed trying to compensate for fragmented, non-restorative sleep. They nap during the day. And the UK Biobank question explicitly includes naps.
It independently accelerates biological ageing. Intermittent hypoxia and chronic sleep fragmentation drive brain atrophy, systemic inflammation, and metabolic dysfunction, precisely the organ-ageing signatures the authors attribute to long sleep.
So the “long sleep ages you faster” finding could be substantially driven by a hidden pool of people who don’t sleep too much, they sleep badly, and we’re blaming the number instead of the quality.
The authors did adjust for general “disease status” and excluded diagnostic sleep disorder in the sensitivity analysis - but both approaches rely on diagnostic codes which capture only the ~1% with a formal OSA diagnosis. The undiagnosed ~7% who report symptoms (identifiable through the UK Biobank Fields 1210 and 1220) remain in the analysis, and they are precisely the group most likely to populate the long-sleep arm of the U-curve. Excluding them and re-fitting the model would directly test whether the U-shape sruvives once probable sleep apnea is removed.
They could have done it. But they didn’t.
Does long sleep cause brain aging, or is it the other way around?
This is the finding that made the biggest splash: “long sleep appears to accelerate brain aging, which then leads to late-life depression. Long sleep → brain aging → depression.” A clean, alarming causal chain.
The problem is that there is an established alternative explanation, and it runs in the opposite direction.
Neurodegenerative diseases cause people to sleep more, years before diagnosis.
In Parkinson’s disease, the degeneration of wake-promoting brain regions (the locus coeruleus, basal forebrain, hypothalamic orexin neurons) produces excessive daytime sleepiness (EDS) years before movement deficits appear (reference here). In Alzheimer’s disease, similar disruption of the brain’s arousal circuitry lengthens habitual sleep well before memory complaints begin (reference here).
In UK Biobank-era studies, longer reported sleep at baseline predicts subsequent dementia and Parkinson’s disease. The prevailing interpretation: long sleep is a marker of neurodegeneration already in progress, not a cause of it.
The authors fo the Nature paper do acknowledge this possibility. They attempt to rule it out using a technique called Mendelian randomization. But the design has a structural gap: it tests whether diagnosed diseases genetically cause long sleep. Prodromal neurodegeneration is, by definition, not yet diagnosed. A person already losing neurons in their brainstem sleeps more for biological reasons that no polygenic risk score for “Parkinson’s” captures.
The straightforward sensitivity analysis (exclude everyone who later develops dementia or Parkinson’s, re-fit the curve) was feasible using UK Biobank’s 15 years of follow-up. It was not performed.
The participants are not “the population”
One more issue, briefly. UK Biobank enrolled just 5.5% of those invited. The people who chose to participate are healthier, wealthier, better educated, and longer-lived than the general British population. Their all-cause mortality is roughly half the national average. The imaging sub-sample (from which the brain ageing data come) is even more selected.
“Optimal” sleep estimated from this exceptionally healthy slice of the population does not automatically apply to the rest of us.
What the study does get right
The relationship between sleep duration and health outcomes really does follow a U-shape. This is one of the most replicated findings in sleep epidemiology: both short and long sleep associate with higher mortality, cardiovascular disease, and cognitive decline. The authors’ effort to extend this to 23 multi-organ biological ageing clocks across multiple omics platforms is ambitious and, in principle, valuable.
The U-shape is real. The minute-level precision is not.
So how much sleep do you actually need?
If you were hoping for a number: the honest answer is that no study has yet pinpointed a biological optimum at the resolution this paper claims.
What we can say, from decades of converging evidence, is that consistently sleeping under 6 hours or over 9 hours is associated with worse health outcomes across nearly every measure studied. Within that range, sleep quality, regularity, and timing likely matter more than a precise hour count, and sleep regularity has been shown to outperform sleep duration as a mortality predictor in UK Biobank itself.
What would make the findings in this Nature paper more credible? The same UK Biobank collected wrist actigraphy data from roughly 84,000 participants, this is an objective, minute-level sleep measurement. Reanalysing the U-curve with that data, excluding probable sleep apnoea and prodromal neurodegeneration, would be a study whose precision matches its claims.
Until then, the number is a statistical artefact.
Sleep well. Please, don’t set your alarm to 6 hours and 25 minutes.
If this type of analysis is useful to you, the kind that looks behind the headline and asks whether the data support the claim, consider subscribing. Brain Trials covers neuroscience and neurodegeneration through the lens of evidence, measurement, and trial design. Always free, no spam, straight to your inbox.
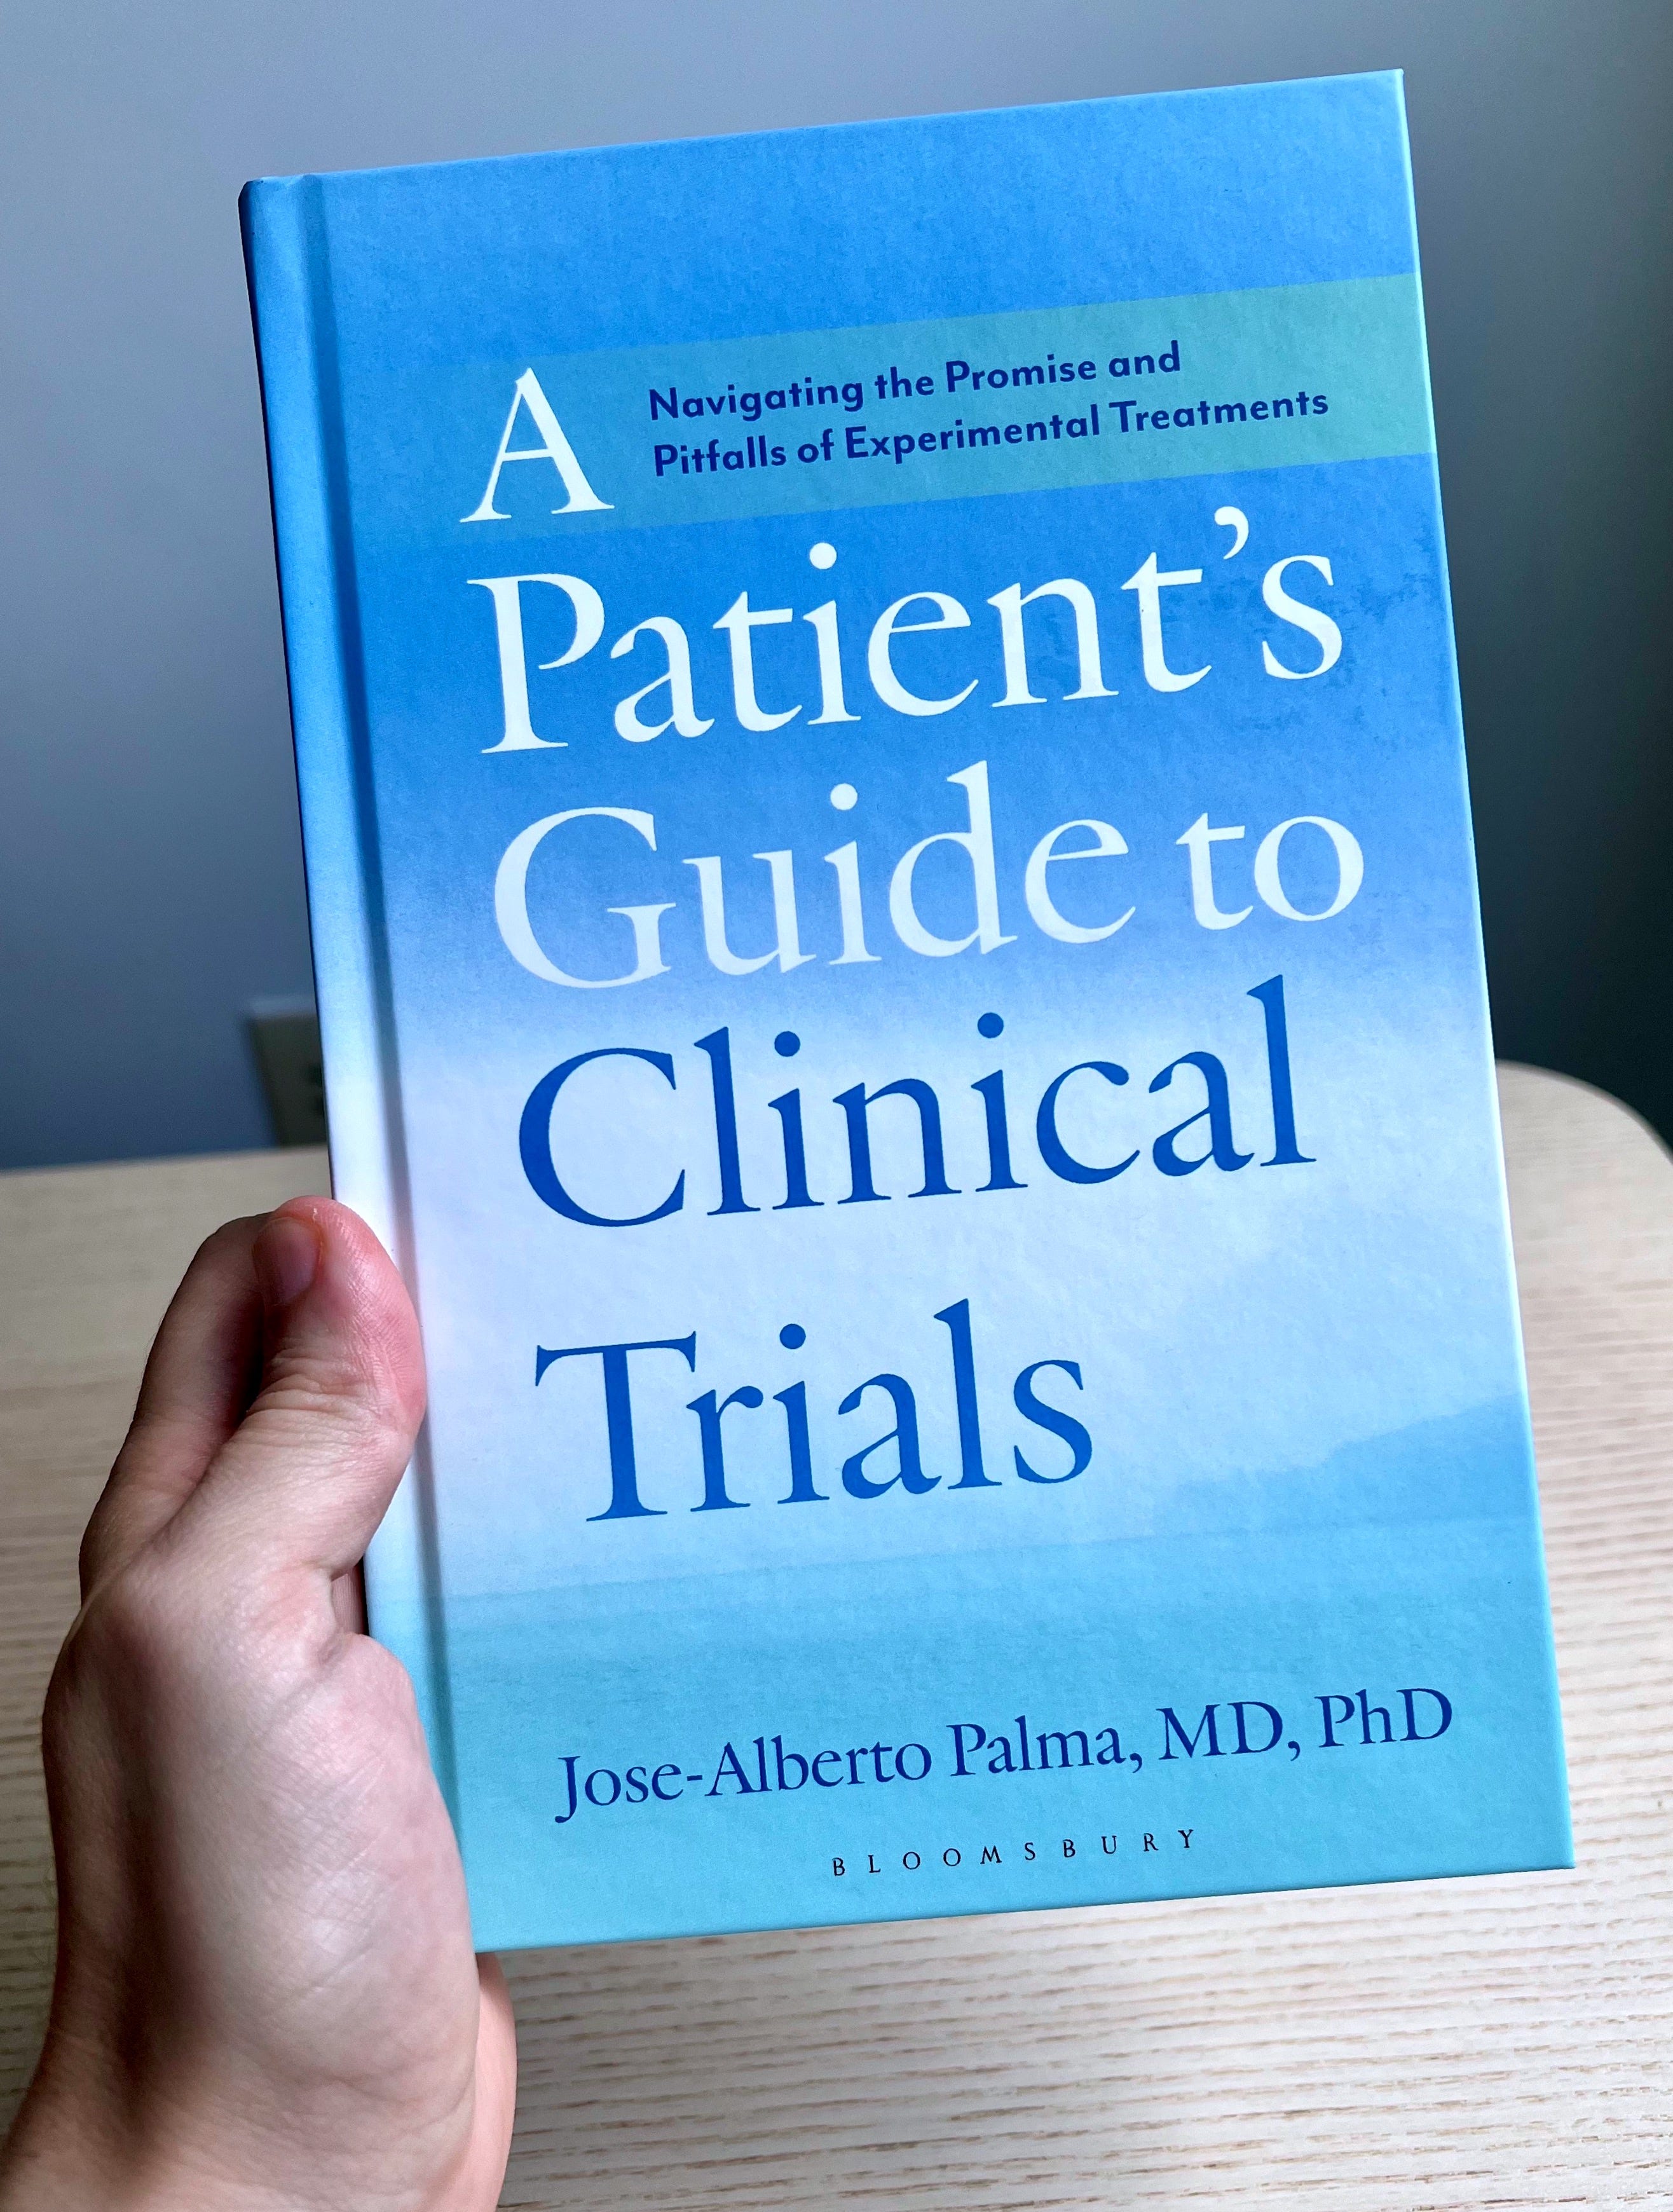
Knowing how to read a study, what the data actually show versus that the headlines claim, matters - whether the topic is a Nature paper about sleep or a clinical trial. I wrote a book exactly about that.
A Patient’s Guide to Clinical Trials: Navigating the Promise and Pitfalls of Experimental Treatments (Bloomsbury), a plain-language guide on how trials work, what to expect, and how to weigh risks and benefits.
Views expressed here are my own and not necessarily those of my employer. All data mentioned are publicly available.
Comments
Nothing yet. Say the first thing.
Sign in to join the conversation.