
In recent weeks, one dominant explanation has circulated for gold’s decline: investors need liquidity. Margin calls, forced selling, and the familiar phrase, “sell what you can, not what you want.” It sounds logical, especially if investors had taken on too much risk through derivatives or leverage.
But does it actually hold up?
Looking across the broader landscape, I do not rule out that liquidity played a role. But I have doubts that it was the primary driver of the recent decline. For one simple reason: if gold is being sold to raise liquidity, you would expect serious stress elsewhere in financial markets.
The chart below shows the performance of gold and the S&P 500 Index since the attacks on Iran began in late February. When panic truly grips markets, especially equity markets, liquidity tends to evaporate quickly. Investors step aside, volatility spikes, and it becomes extremely difficult to determine market direction.
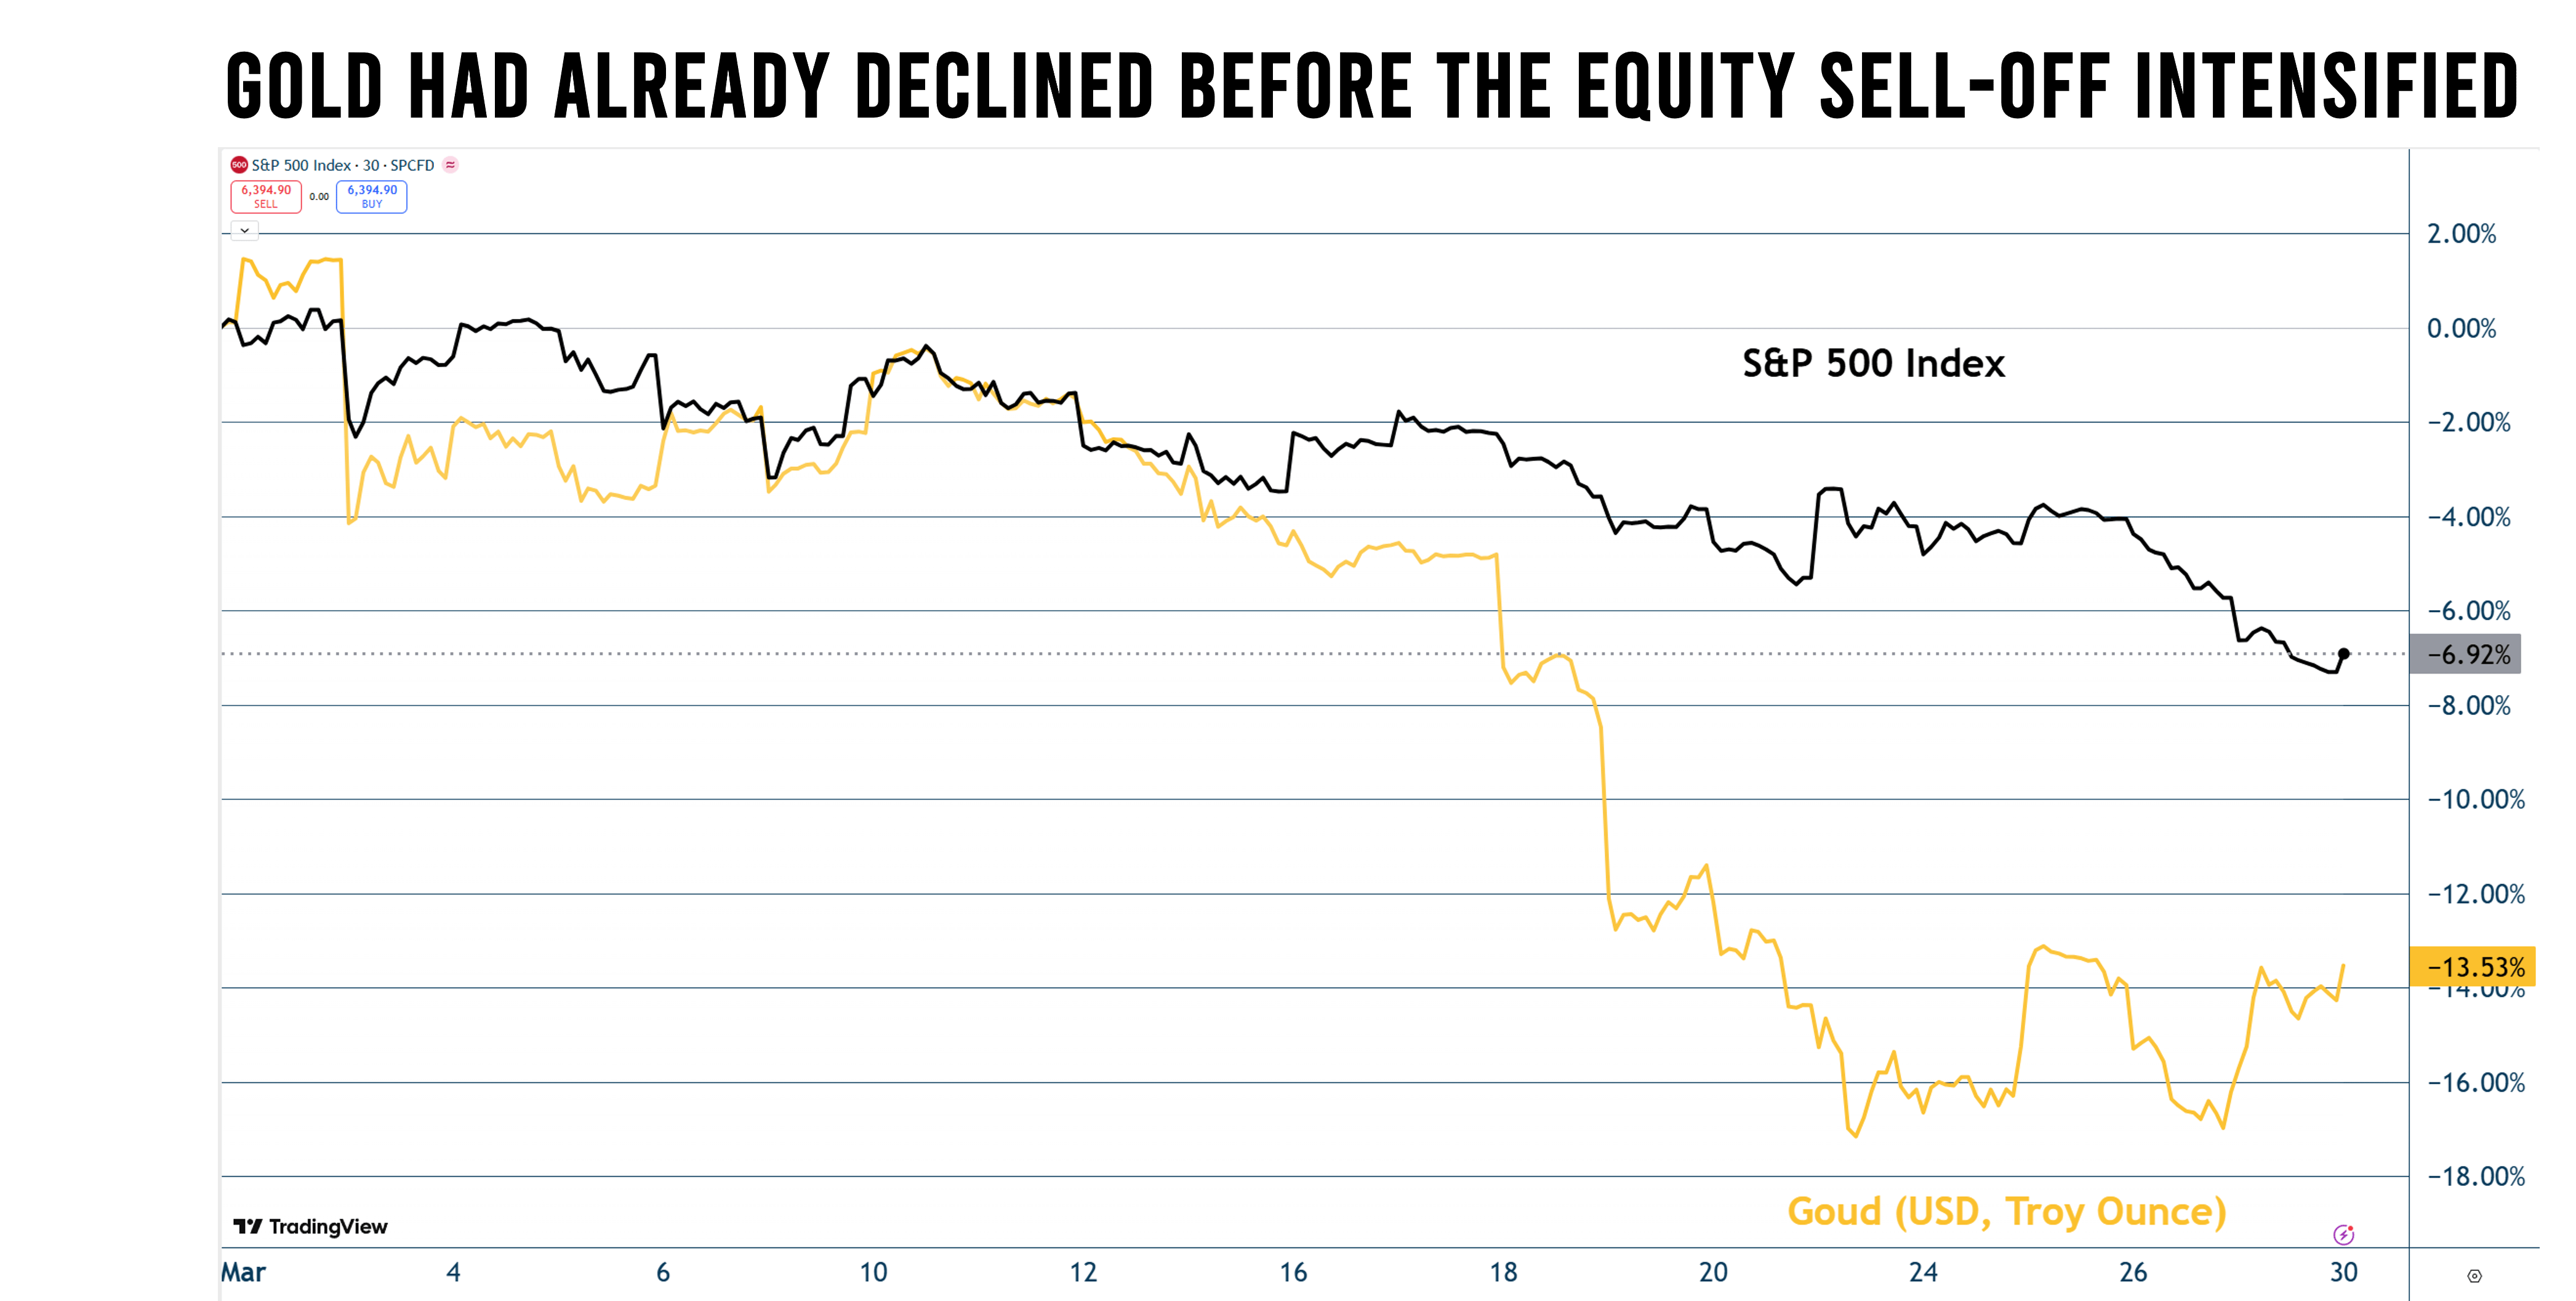
The S&P 500 Index declined by roughly four percent in the first trading days after the conflict began, but then recovered a bit. When gold started to fall more sharply, US equities were only about 2.5% lower. Hardly a sign of panic. A sudden liquidity squeeze in equity markets, combined with widespread margin calls, does not appear to have occurred. In fact, when equities fell more sharply in recent days, gold began to recover.
What many investors overlook is that, in a debt-driven economic system, it is just as important to watch bond markets. Over the past decade, concerns about debt sustainability and rising fiscal deficits have repeatedly triggered market stress. The idea that government bonds still offer a safe haven with reasonable returns is increasingly outdated. Add that private debt looms large on the radar of investors and bond markets may well cause market jitters.
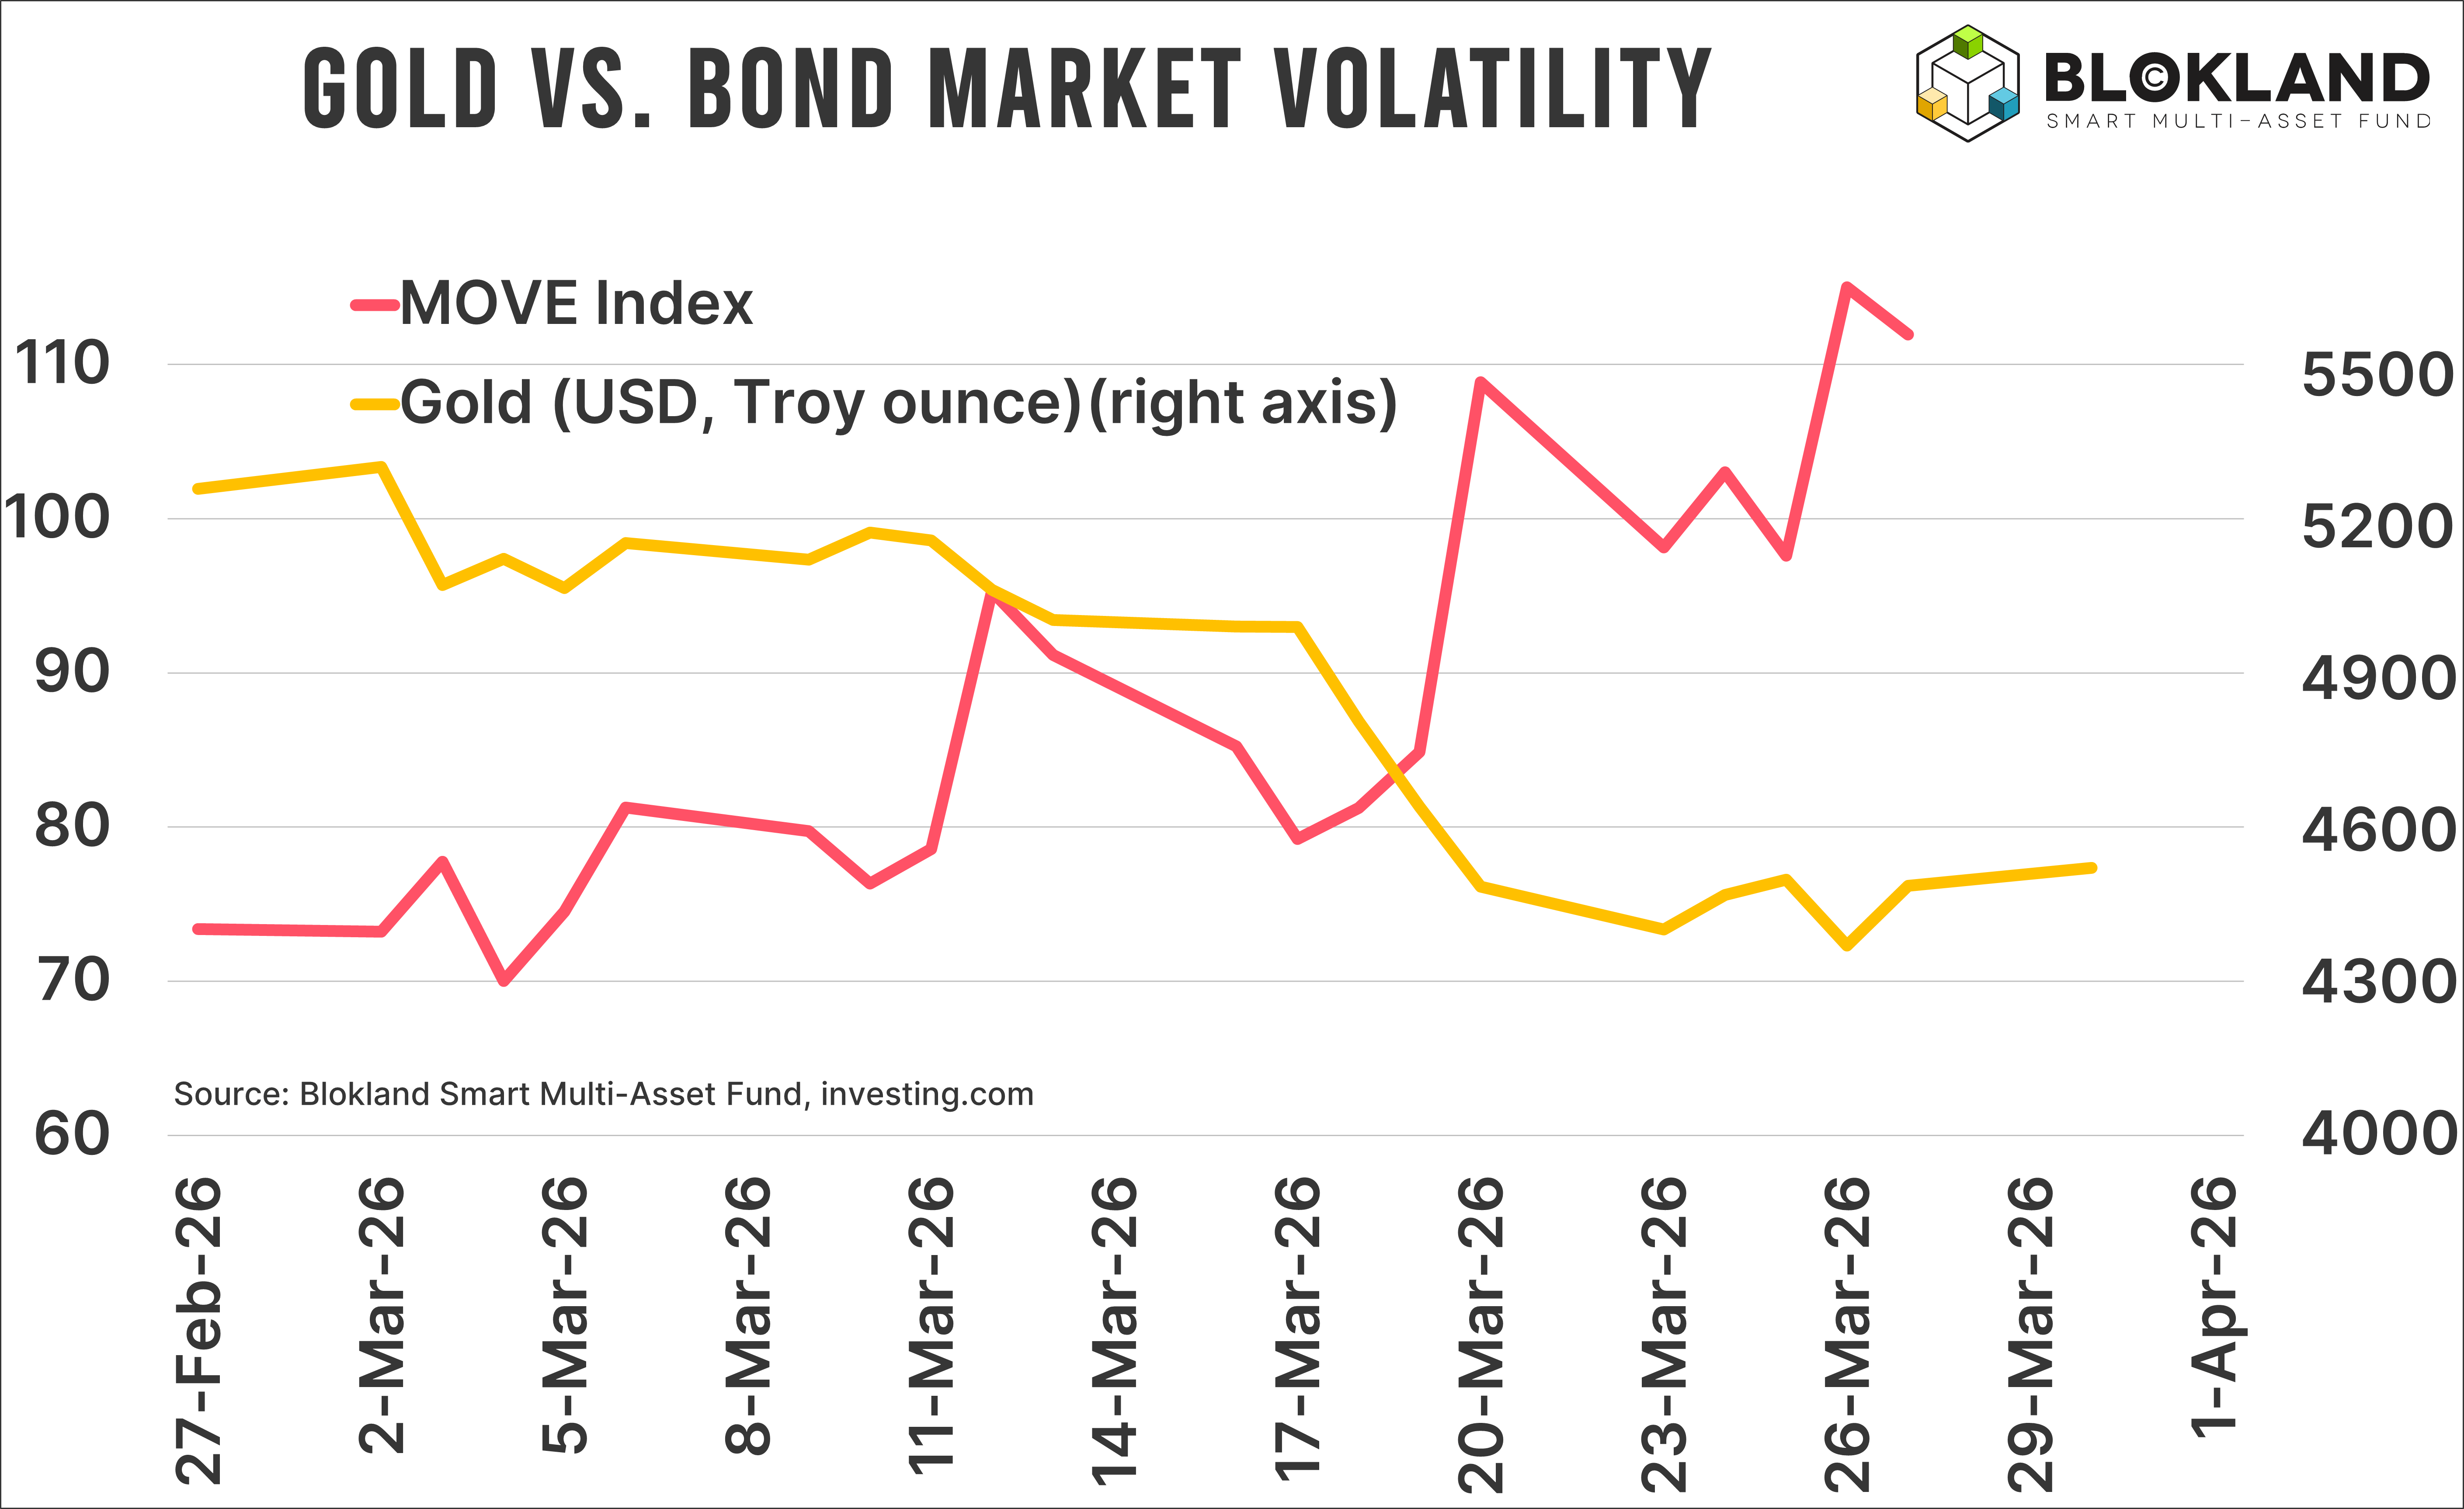
The chart above shows the MOVE Index, often described as the bond market equivalent of the VIX Index for equities. It reflects implied volatility in government bond markets. The pattern looks similar to equities: volatility really surged only after gold had already completed most of its decline.
This argument is shared by many market commentators and ‘experts’. According to this argument, positioning in gold had become extreme. Investors had massively piled into gold and were now forced to sell as prices declined and liquidity needs increased.
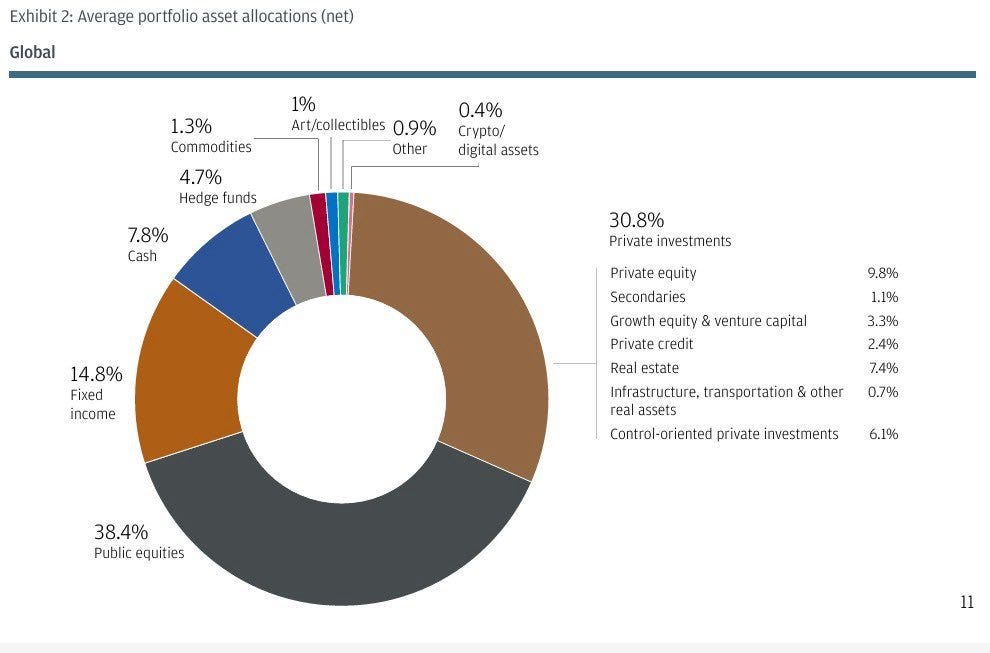
It sounds plausible, but the data does not strongly support it. Readers familiar with my work know that gold remains heavily underrepresented in investor portfolios. I often refer to the 0.9% allocation to gold in global family office portfolios. Gold’s share is even lower in the portfolios of pension funds, insurers, and asset managers. Even in retail portfolios, gold is often absent. Many wealth management solutions simply do not include gold. That is one of the key reasons I launched the Blokland Smart Multi-Asset Fund.
If you are a family office holding just 0.9% in gold and you need liquidity, selling gold will not take you very far.
There are several ways to assess investor positioning. Hedge funds and other active investors often express their views through derivatives. These positions are tracked, including through Bloomberg data, shown below.
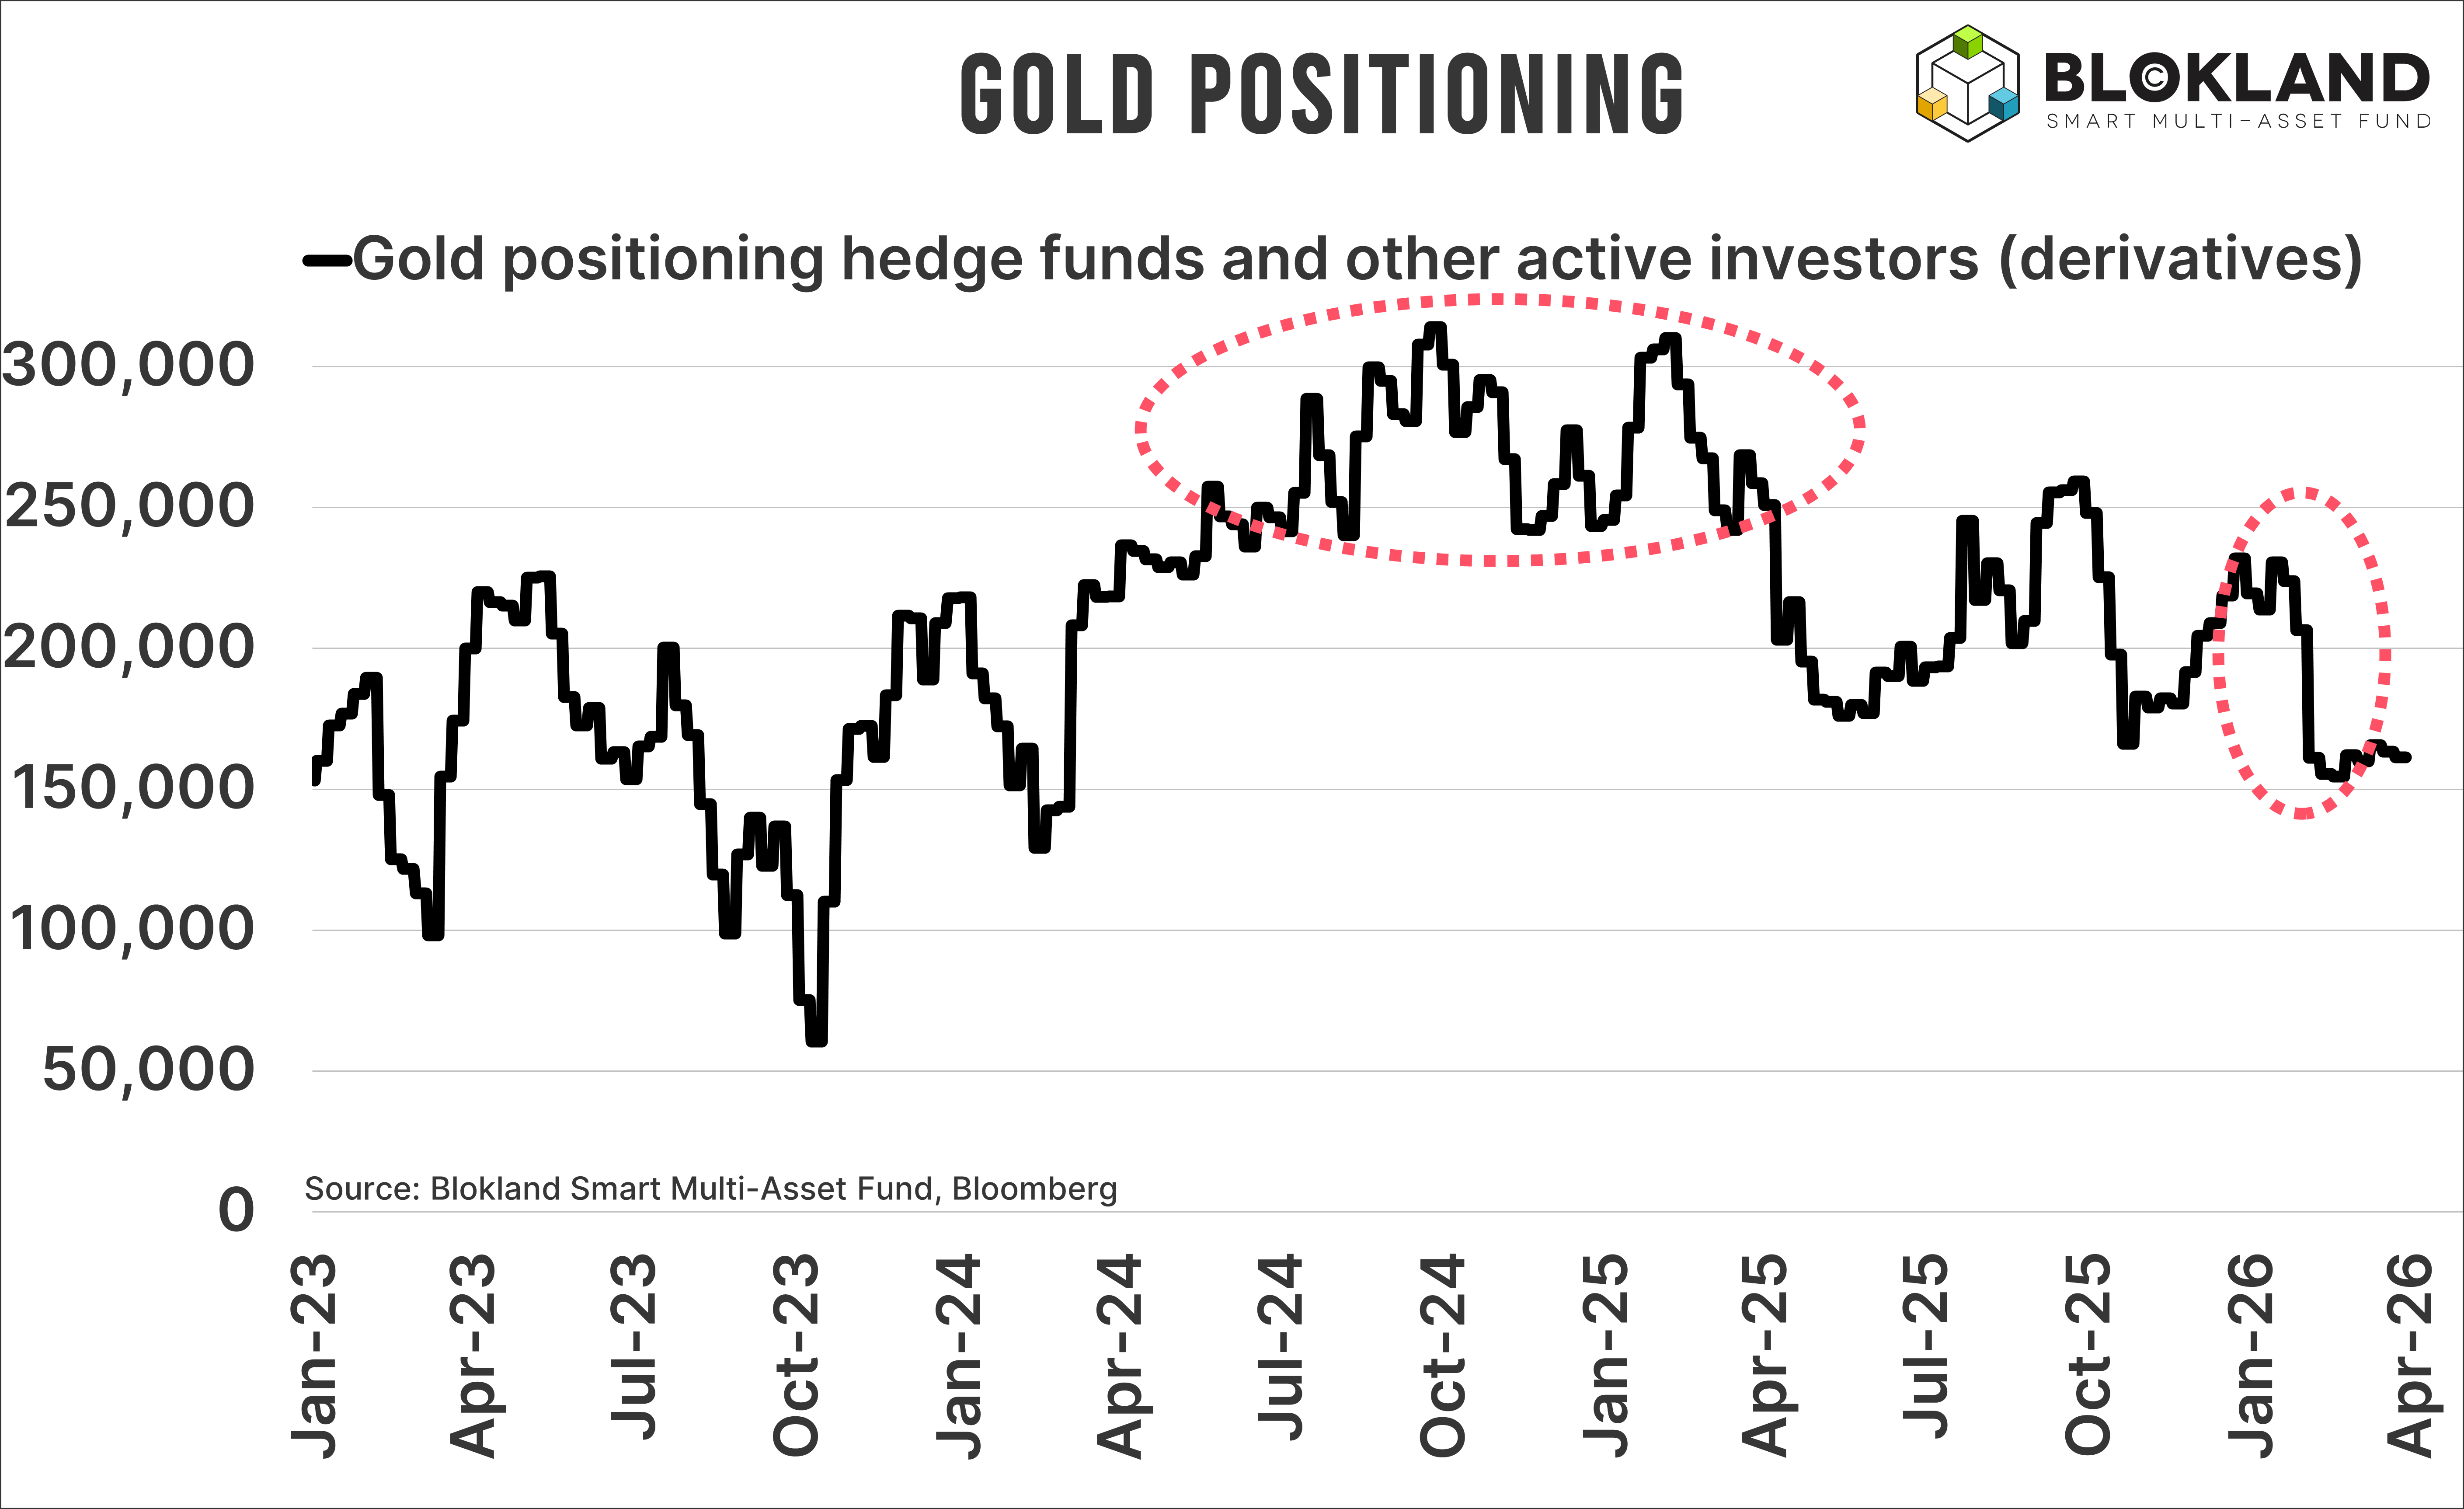
A positive figure indicates that this group holds more long positions than short positions. Importantly, this is a specific subset of the positions of investors seeking returns, so the figures do not necessarily sum to zero, which makes the data particularly informative.
The chart shows that hedge funds and other active investors still hold net long positions, suggesting expectations of rising prices. If they expected declines, the figure would turn negative. Yet positioning has come down in recent months.
This is not surprising. It often happens when prices fall. Investors reduce risk and close positions. What is notable, however, is that most of this reduction occurred before the first missiles were launched toward Iran. During that period, gold prices actually rose, albeit with greater volatility.
This behaviour is also logical. Professional investors typically operate within risk budgets. Even when prices move in their favour, they may reduce exposure when uncertainty increases.
The chart also shows that active investors still expect gold prices to rise, but with far less conviction than in 2024 and 2025. While it would not be the first time that extremely bullish positioning has preceded a reversal, this mechanism does not appear to be the case here.
There is no escaping it: the war in Iran is currently driving market sentiment. To such an extent that macroeconomic data has become less relevant, if not irrelevant. What does an inflation figure from February tell you if oil prices rise 50% in March? What do growth figures from the previous quarter mean if we do not yet know how long the conflict will last?
The key question is whether the war could trigger liquidity-driven gold selling. The answer is yes. Wars are expensive, and governments may need to raise liquidity.
Crucially, one country actually did sell gold after the conflict began: Türkiye. The country sold or swapped roughly $8 billion in gold. That news may have unsettled investors and prompted some to sell their gold. A further escalation could, in theory, push other countries into similar positions.
However, Türkiye appears to be a special case. The country is geographically close to the conflict, borders Iran, and is a net oil importer. Therefore, higher energy prices directly weaken its economy. At the same time, the Turkish central bank has accumulated significant gold reserves in recent years, giving it the capacity to sell.
Yet, central bank demand is worth noting. Gold purchases by central banks have slowed in recent quarters. While this cannot directly explain the recent decline, it does suggest that the downside support from central bank buying may be less robust than before.
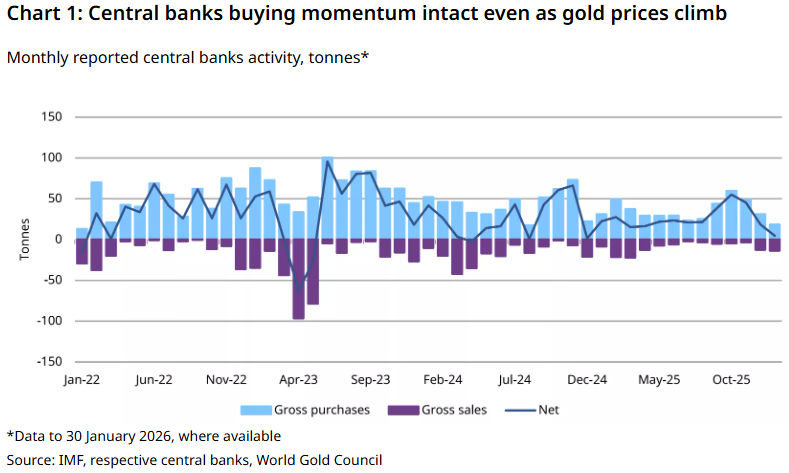
The argument that investors suddenly needed liquidity is not entirely convincing. Gold fell most sharply when equities remained relatively stable. Positioning was not extreme. Clear evidence of widespread liquidity-driven selling is limited.
Another explanation seems much more straightforward: profit taking.
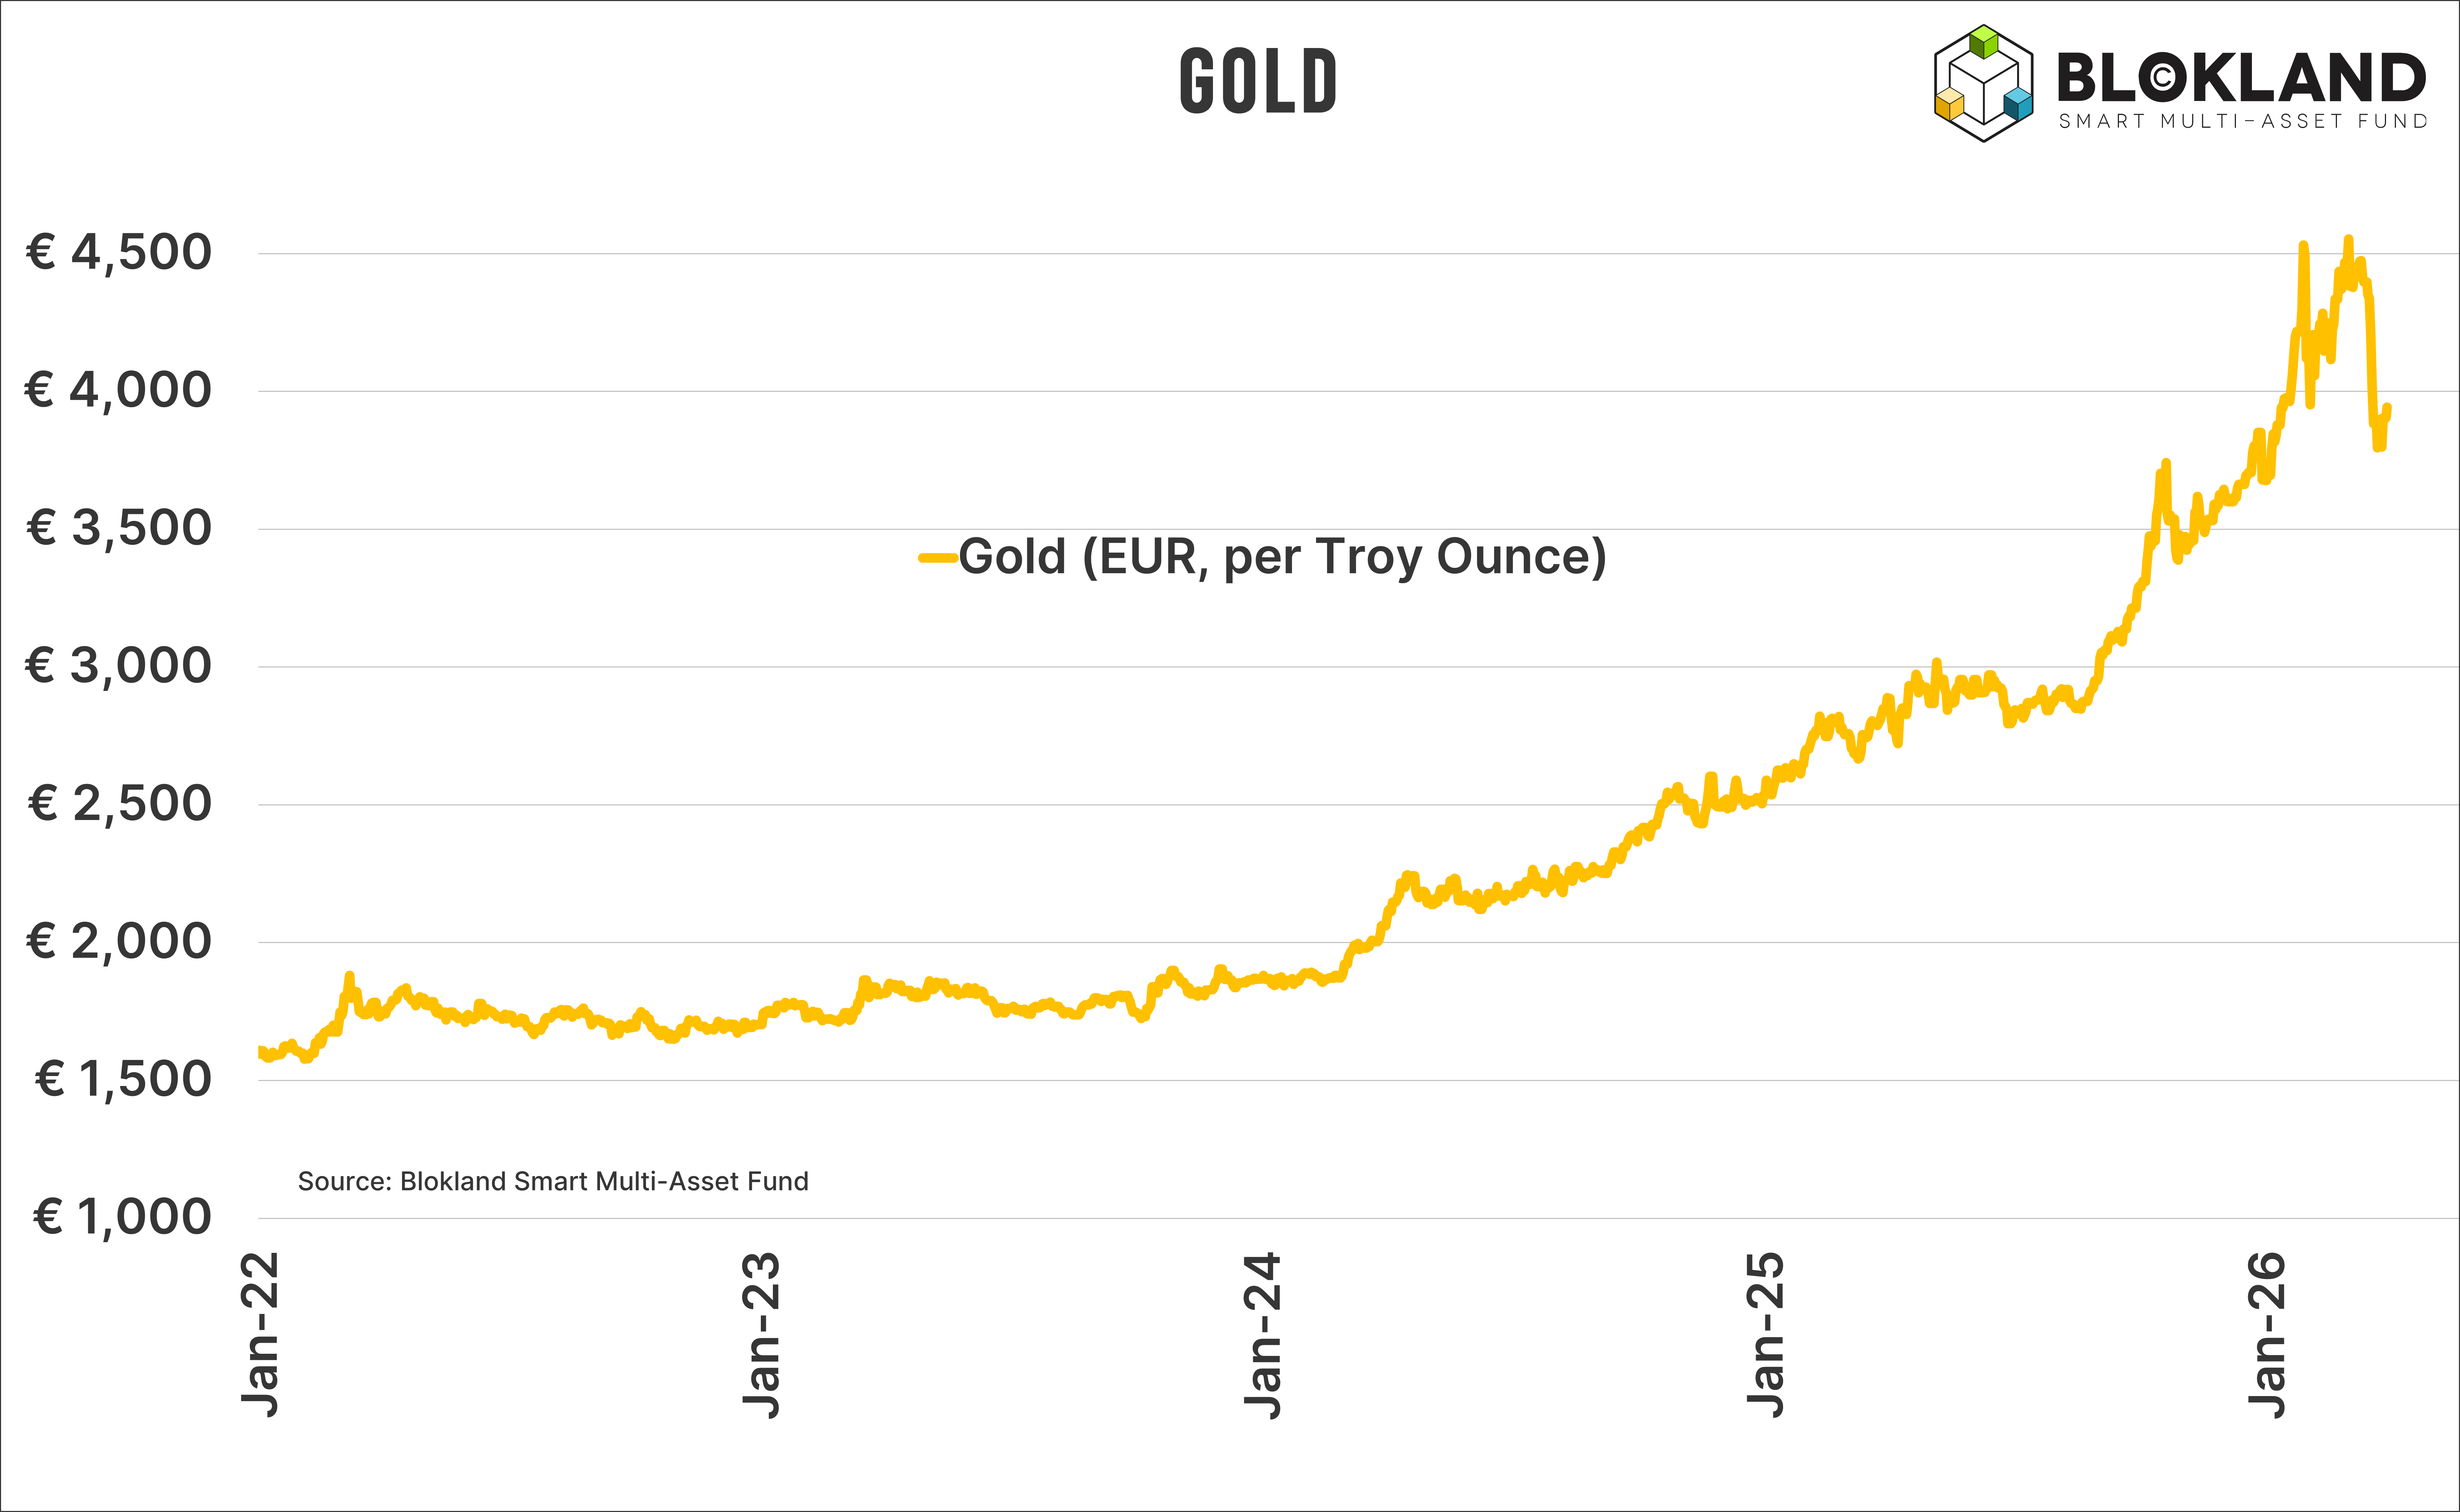
That may sound mundane, but that does not make it wrong. Few investors would have predicted two or three years ago how strong gold’s rally would be. Even after the recent correction, gold has doubled since 2024. That is not something you see often in major asset classes.
Investors often remain invested for as long as possible, or at least until they believe the music is about to stop. I suspect many investors are confusing positioning with accumulated gains. It’s likely not about extreme optimism, but about extreme profits.
I struggle with the default explanation that gold is falling due to a sudden need for liquidity. Developments in broader markets and investor positioning only partially support that view. At best.
Instead, I believe the decline is largely driven by increased profit-taking after an exceptional rally. That does not necessarily make the correction healthy, as many market pundits like to tell us, but it also does not suggest that gold’s long-term attractiveness has been structurally damaged.
Would you like to learn more about the Blokland Smart Multi-Asset Fund and how we invest in a disciplined combination of quality equities, physical gold, and bitcoin?
Feel free to contact me at jeroen@bloklandfund.com. You are, of course, welcome to call as well. Full contact details and comprehensive information about the Fund can be found on our website.
Kind regards,
Jeroen Blokland

Comments
Nothing yet. Say the first thing.
Sign in to join the conversation.