
🎧Beyond the Pass — Operator Podcast (1:35)
The gastropub bar gross profit myth
0:00
-1:35
Prefer reading? The full breakdown is below.
A gastropub owner in Hampshire told me, with total confidence, that his bar carried the business.
“The kitchen’s a nightmare. Thirty per cent food cost, all that labour, all that prep. The bar’s where the money is. Seventy per cent GP, pour a pint, take the cash. The bar pays for the kitchen’s mistakes.”
It’s the most widely held belief in the trade, and it’s usually wrong. Not completely wrong, the bar does often contribute more than the kitchen, but wrong by a margin that surprises every operator who actually runs the numbers. When we costed his bar and his kitchen properly, side by side, the gap between them was less than half what he thought. The bar wasn’t carrying the business. It was carrying slightly more than its share, while he gave it credit for carrying everything.
This matters because the belief drives decisions. Operators who think the bar is bulletproof under-invest in its efficiency, tolerate wastage they’d never accept in the kitchen, and make staffing and menu decisions based on a profitability picture that doesn’t exist. The first step to fixing a bar is seeing it honestly, and almost nobody does, because the headline number is so seductive.
The bar’s seduction is its gross profit percentage. A pint that costs you 90p and sells for £5 is an 82% GP. A spirit and mixer costing 70p and selling for £6 is an 88% GP. Next to a main course running 30% food cost, those numbers look like printing money.
But gross profit percentage is not profit. It’s the margin after product cost and nothing else. And the bar carries a stack of costs that the GP percentage completely ignores.
Labour. The bar is staffed during every trading hour, often more heavily at peak than the kitchen, and that labour cost has to come out of the gross profit before anything reaches the bottom line. A bar running 18% labour against wet sales has already given back a fifth of its takings before you count anything else.
Wastage. This is the bar’s hidden monster, and it gets its own post later in the series, but it belongs here too. Over-pour, spillage, oxidised wine, comps, breakage, and stock that goes out of date typically run 5-12% of wet revenue. The kitchen counts every gram; the bar pours by eye and loses margin it never sees.
Slow stock. Cash tied up in a wine list or a spirits range that doesn’t sell is a real cost. The bar that proudly stocks forty whiskies, half of which sell one measure a month, is carrying dead money and shelf space that has to be paid for somehow.
Once you take those out of the beautiful headline GP, the bar’s real contribution, the money that actually reaches the bottom line, is far lower than the percentage suggests. Often it’s closer to the kitchen than the operator could ever believe.
Here’s roughly what the Hampshire pub looked like when we costed both sides honestly.
The kitchen ran a 31% food cost, which the owner hated. After kitchen labour and prep, properly costed, the kitchen’s real contribution to the bottom line came out at around 22% of food sales. Not brilliant, but positive, and steady.
The bar ran a headline 72% GP, which the owner loved. But the bar carried 19% labour against wet sales. Wastage, when we actually measured it rather than guessed, ran close to 9%, mostly oxidised wine by the glass and a generous free-pour on spirits. Slow stock was tying up cash in a range far bigger than the volume justified. After all of it, the bar’s real contribution came out at around 38% of wet sales.
So the bar did contribute more than the kitchen. 38% versus 22%. But the owner had been carrying a picture in his head of 72% versus 31%, a gap of forty-one points. The real gap was sixteen points. Less than half what he believed.
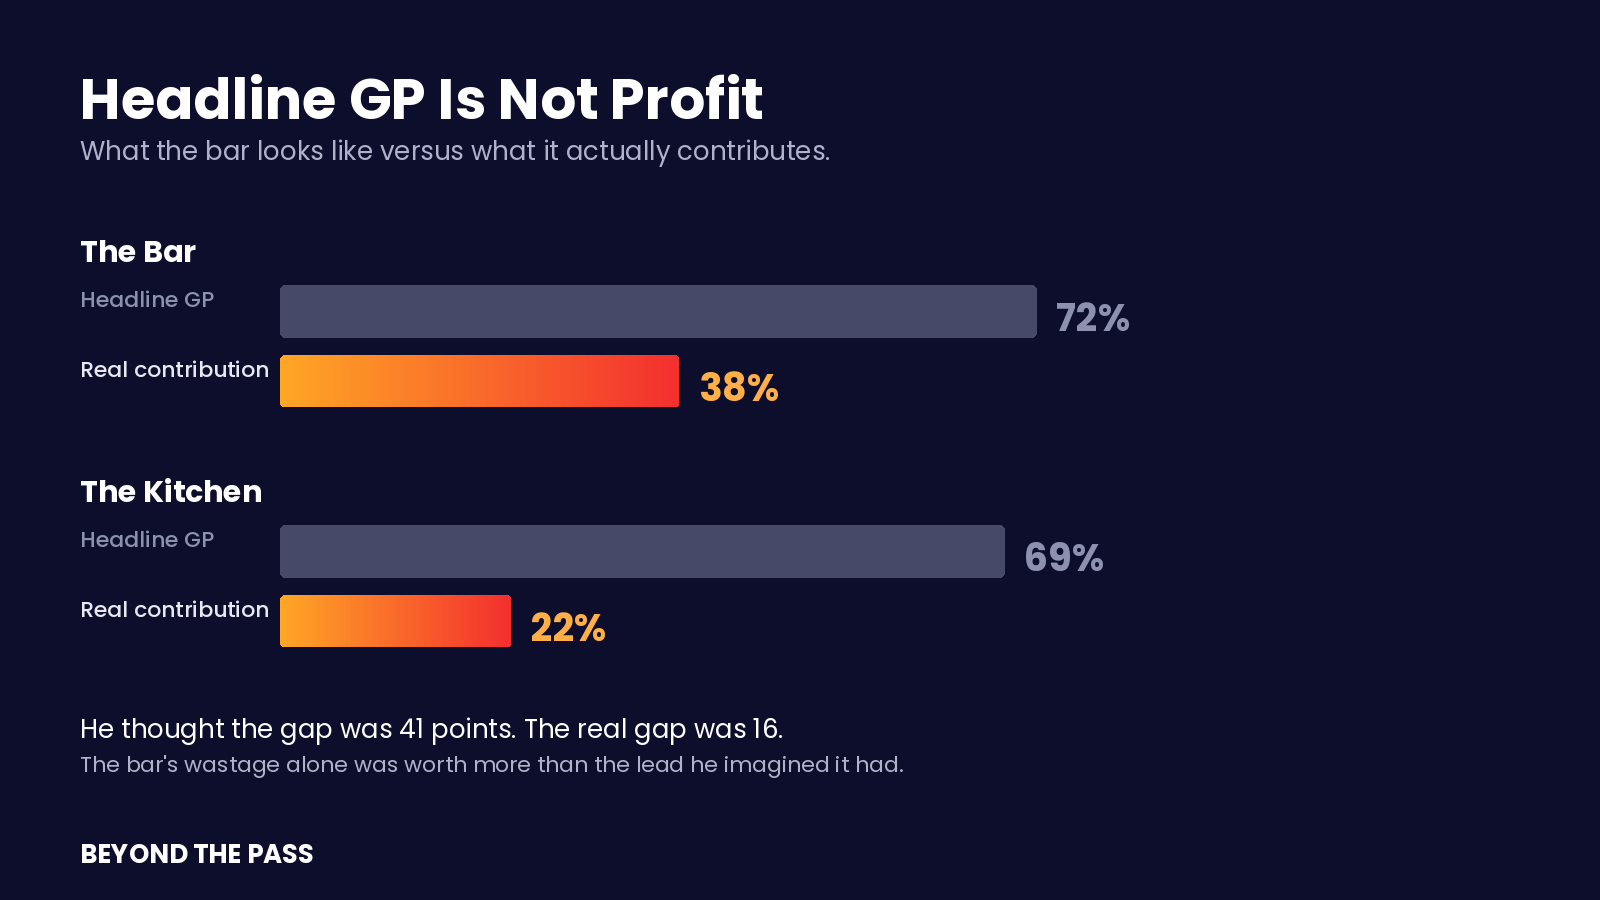
And here’s the part that changed how he ran the business: the bar’s wastage alone, that 9%, was worth more than the entire profit difference he imagined the bar held over the kitchen. The thing he was proudest of was leaking margin faster than the thing he was ashamed of.
The “bar carries the business” belief isn’t just inaccurate. It’s costly, in three specific ways.
It excuses bar wastage. An operator who counts every portion in the kitchen will shrug at a heavy-handed free pour, because the bar’s GP is so high it feels like it doesn’t matter. It matters enormously, precisely because the volume is high. A consistent 25ml over-pour on a high-volume spirit is thousands a year.
It distorts investment. Operators pour energy into fixing the kitchen (the visible problem) while leaving the bar (the assumed solution) unexamined. Often the fastest margin gain in the whole business is sitting in the bar’s wastage and labour, untouched, because nobody thought to look.
It misleads on the big decisions. The wet-led versus food-led question, whether to add food, whether to cut the kitchen back, gets decided on a false premise. If you believe the bar contributes 72% and the kitchen 22%, you make very different decisions than if you know the real numbers are 38% and 22%. Operators have closed kitchens that were quietly fine and over-invested in bars that were quietly leaking, all on the strength of a percentage that was never profit.
Three steps. Thirty minutes if you have your wet sales, your rota, and a willingness to measure rather than assume.
Step 1. Calculate your real bar labour percentage. Total bar and floor labour attributable to wet service, divided by wet sales. Not the blended figure across the whole business. The bar’s own number. Most operators have never separated it.
Step 2. Estimate your wet contribution honestly. Take your headline wet GP. Subtract bar labour as a percentage of wet sales. Subtract a realistic wastage figure (if you’ve never measured it, assume 8% and you won’t be far off). What’s left is your rough real contribution. It will be a lot lower than the headline GP.
Step 3. Do the same for the kitchen, and compare. Food GP, minus kitchen labour and prep as a percentage of food sales. Then put the two real contribution figures side by side.
Most operators find the gap between their bar and their kitchen is roughly half what they assumed. Some find the kitchen is closer to the bar than they ever imagined. A few, in food-led sites, find the kitchen actually contributes more, which is the opposite of what they’d have sworn was true.
Whatever you find, you’ll be making decisions on real numbers instead of a percentage that was never the whole story.
This is the first post in a series on the wet side of hospitality, the part of the business most operators guess at and almost nobody costs properly. Over the next few posts we’ll take apart the cocktail menu that looks like high margin and isn’t, the wine list that leaks cash through the wrong end, the wastage that quietly equals your net profit, and the wet-versus-food decision that so many operators get wrong because they started from the belief this post just dismantled.
The bar can be a brilliant profit engine. But only if you run it on its real numbers, not its headline ones. The 72% was never the profit. The profit was always the harder number underneath, and the operators who find it are the ones who stop trusting the percentage and start measuring what actually reaches the bottom line.
The Hampshire owner still loves his bar. He just stopped letting it off the hook. He measured the pour, trimmed the dead stock, tightened the wine-by-the-glass, and the bar’s real contribution climbed from 38% to 47% in a couple of months. Same pub, same range, same prices. He just stopped believing the headline and started reading the truth.
Free 15-minute diagnostic that surfaces these numbers for your own here.
Thanks for reading Beyond the Pass! This post is public so feel free to share it.
No posts
Comments
Nothing yet. Say the first thing.
Sign in to join the conversation.