
🎧Beyond the Pass — Operator Podcast (1:30)
Your cocktail margins are an illusion
0:00
-1:30
Prefer reading? The full breakdown is below.
A bar in Bristol added an ambitious cocktail menu to lift its margins. Twelve serious cocktails, fresh citrus, house syrups, proper garnishes, the works. On paper it looked like the smartest move the owner had made in years, because per drink, the gross profit was gorgeous. A cocktail selling at £11 with £2.20 of liquid cost is an 80% GP. Next to a £5 pint at 82%, it looked like the cocktails would print money faster.
Six months later, contribution was down, not up. Same revenue, less profit. The owner couldn’t understand it. The GP on every cocktail was beautiful. The bar was busier than ever. And somehow the business was making less money than before the cocktail menu existed.
The answer is the trap at the heart of cocktail economics: gross profit percentage is the one number that tells you almost nothing about whether a cocktail menu makes money. Because cocktails carry costs that nothing else on the bar does, and those costs live entirely outside the GP calculation.
A pint takes ten seconds to pour and has no perishable component. A cocktail is a different animal entirely, and it carries four costs a pint never touches.
Labour time per drink. This is the big one. A well-made cocktail takes two to four minutes of skilled bartender time. During a busy service, that time is the scarcest resource the bar has. While one bartender spends three minutes building a negroni sbagliato with a perfect orange twist, they are not serving the four customers who wanted pints and would have been out the door in ninety seconds. The cocktail’s GP looks great in isolation, but it consumed labour that could have turned over far more revenue.
Perishable ingredient wastage. Fresh citrus, house syrups, herbs, fruit garnishes, all of it has a short life. The lime you cut for garnish oxidises. The batch of syrup you made goes off before it sells through. The mint wilts. A cocktail menu built on fresh ingredients carries a wastage rate that a spirits-and-mixers bar never sees, and it doesn’t appear anywhere in the per-drink GP.
Consumables and garnish. The dehydrated citrus wheel, the edible flower, the fancy ice, the reusable-but-breakable glassware, the paper straw, the cocktail pick. Pennies per drink, but real, and again invisible in the GP.
Throughput drag. This is the subtle one. A bar’s revenue per hour at peak is capped by how fast it can serve. A cocktail-heavy menu slows the whole bar down, which means fewer total drinks served in the peak window, which means lower total revenue even if each individual drink has a higher margin. The cocktail menu can lower the ceiling on the entire bar’s takings.
Here’s roughly what the Bristol bar looked like once we costed the cocktails properly rather than by GP.
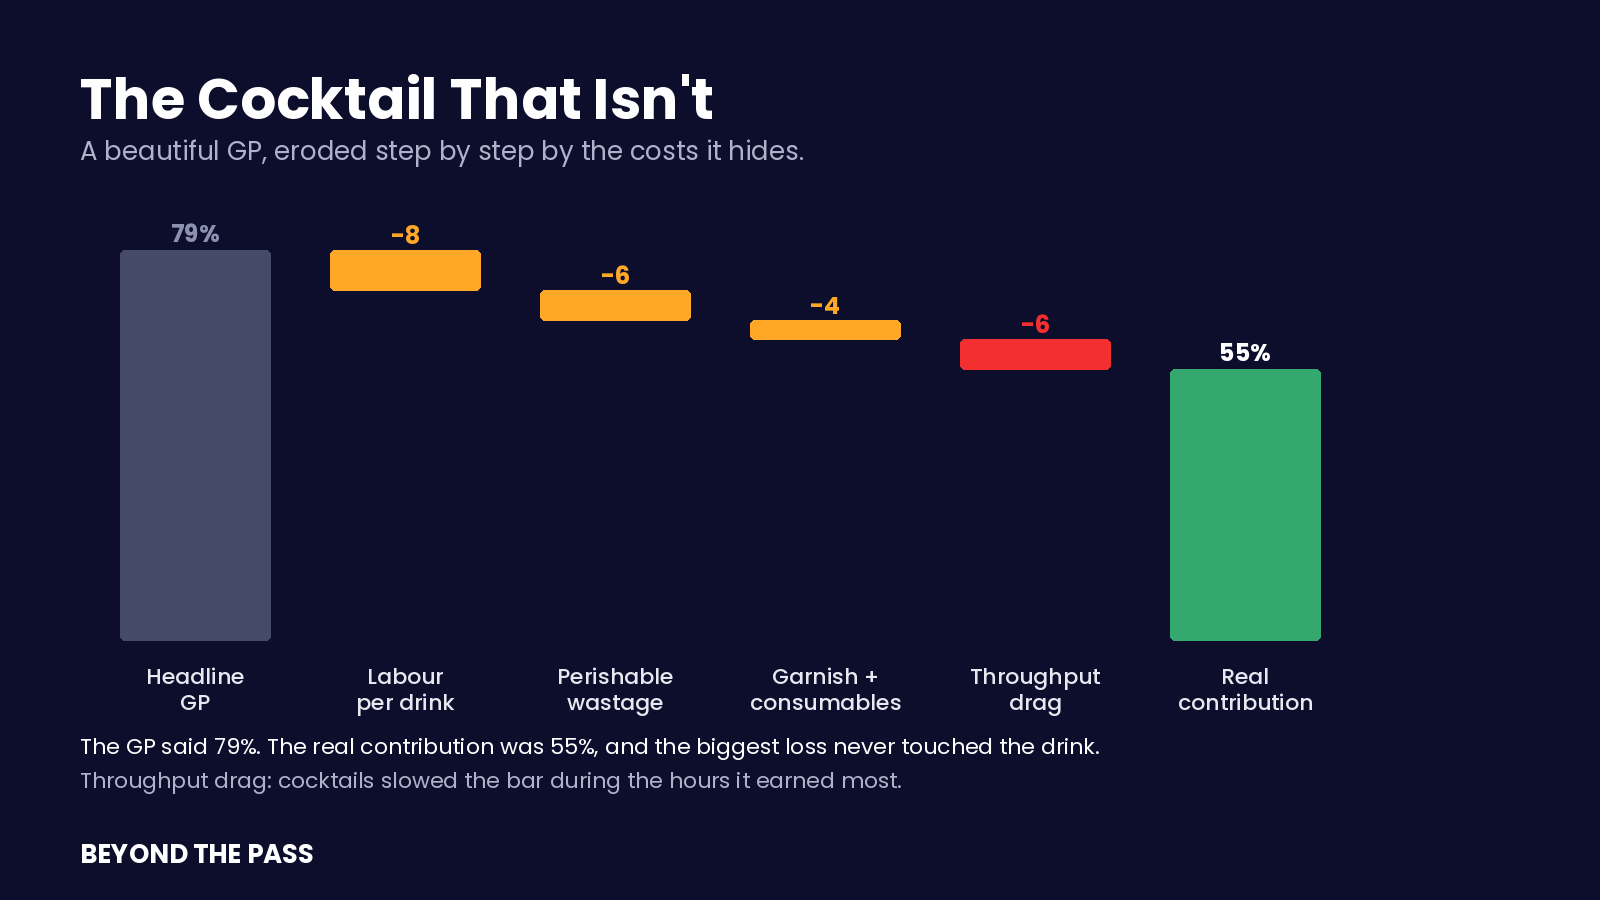
The headline looked wonderful. Average cocktail price £11, average liquid cost £2.30, a GP around 79%. On paper, every cocktail was a winner.
Then we loaded the real costs. Average build time three minutes of skilled labour. At a loaded bartender cost of around £18 an hour, that’s 90p of labour per cocktail. Perishable wastage across the fresh ingredients, measured rather than guessed, added roughly 8% of cocktail liquid cost back on. Garnish and consumables another 40p. And the throughput drag meant that during the two-hour Friday peak, the bar was serving noticeably fewer total drinks than it had before the cocktail menu, because the bartenders were building instead of pouring.
Per cocktail, the real contribution was still positive, but far below the 79% GP suggested, more like 55% once labour, wastage and consumables were in. That alone wouldn’t have been a problem. The killer was the throughput drag. The cocktails cannibalised the fast, high-turnover pint-and-wine service during exactly the hours the bar made most of its money.
The cocktail menu wasn’t losing money on each drink. It was lowering the total output of the bar during peak, and that’s what pulled contribution down even as the GP on paper looked better than ever.
None of this means cocktails are a mistake. Plenty of bars make excellent money on them. The difference between the bars that profit from cocktails and the bars that quietly lose on them comes down to a few things.
Volume and pace matching. If your bar has quiet, unhurried periods, cocktails are ideal. The labour time is free because the bartender isn’t turning away pint customers. A cocktail bar that trades on slow, high-spend evenings is in a completely different position from a busy wet-led pub trying to bolt cocktails onto a rammed Friday.
Batching. The bars that win at cocktails pre-batch everything possible. The build time drops from three minutes to thirty seconds when the base is pre-mixed. Batching is the single biggest lever for making a cocktail menu profitable, because it attacks the labour cost, which is the largest hidden cost. A bar serving cocktails at volume without batching is leaving most of the margin on the table.
Menu size discipline. Twelve fresh-ingredient cocktails means twelve perishable supply chains, twelve sources of wastage, twelve things to prep. A tight menu of four or five cocktails built around shared, batchable components has a fraction of the wastage and labour of a sprawling one. This is the same menu-complexity logic that governs kitchens, applied to the bar.
Pricing for the real cost. If cocktails genuinely take three minutes and carry perishable wastage, they have to be priced to cover that, not just the liquid cost. A cocktail priced off a simple spirit multiple will be underpriced for what it actually costs to make. The bars that profit price cocktails as the labour-intensive premium product they are.
The Bristol bar didn’t scrap its cocktails. It cut the menu from twelve to five, batched the bases for all of them, moved the fresh-garnish drinks to a “specials” board for quiet periods only, and repriced the remaining core menu to reflect the real cost. Contribution recovered and then climbed past where it had been before the cocktails existed. Same idea, executed on the real numbers instead of the GP.
Three steps. Half an hour with your menu, a stopwatch, and your invoices.
Step 1. Time your builds. Actually time how long your five best-selling cocktails take to make during a normal service, not a quiet demo. Multiply the average by your loaded bartender hourly cost to get the real labour cost per cocktail. Most operators are shocked how much it is.
Step 2. Measure perishable wastage. Over one week, track how much fresh citrus, syrup, herbs and garnish you throw away versus what you use. Express it as a percentage of cocktail ingredient cost. If you’ve never measured it, it’s higher than you think.
Step 3. Load the real contribution. Take your cocktail GP, then subtract labour per drink, perishable wastage, and garnish/consumables. Compare the real number to the headline GP. Then ask the harder question: during your peak hours, are the cocktails slowing down your fastest, highest-turnover service? If yes, the throughput cost is real even if it doesn’t show on any single drink.
Most operators find their cocktails are still worth doing, but worth doing differently: fewer of them, batched, priced properly, and steered toward the periods where the labour time is genuinely free.
The cocktail is the clearest example of the lesson this whole series is built on. The headline GP is the most seductive and least useful number on the bar. The drink with the best GP on your menu can be the one quietly costing you the most, once you count the labour it consumes, the fresh stock it wastes, and the faster service it displaces during your busiest hours.
Cocktails aren’t the problem. Costing them by GP is. The bars that make real money on them are the ones that see past the beautiful percentage to the labour, the wastage, and the throughput underneath, and build the menu around those instead.
Free 15-minute diagnostic that surfaces these numbers for your own operation here.
Thanks for reading Beyond the Pass! This post is public so feel free to share it.
No posts
Comments
Nothing yet. Say the first thing.
Sign in to join the conversation.