
🎧 Beyond the Pass — Operator Podcast (1:30)
Fix your pub with kitchen data
0:00
-1:30
Prefer reading? The full breakdown is below.
Over the last four posts we’ve taken apart the four ways a pub kitchen quietly loses money while looking fine on the surface. The labour line that hides a £40k problem. The busiest service that produces the weakest density. The menu that’s bigger than the team can cook. The £14 ceiling that exists only in the operator’s head.
Each post gave you a calculation. This one puts them together.
If you run a pub, or you’re thinking about buying one, or you’re trying to work out whether the one you have is actually viable, this is the fifteen minutes that tells you more than your accountant’s year-end ever will. You need last week’s numbers, a calculator, and the willingness to find out something uncomfortable.
Here’s the whole diagnostic in three numbers and one decision.
You need three pieces of data from your last full trading week. Not a month. Not an average. One real week.
Ex-VAT food sales. Total food revenue divided by 1.20. The bar stays out of this entirely. We’re testing the kitchen.
Total kitchen hours. Every chef and KP hour worked that week, including prep, including the Sunday morning block, including the hours nobody logs properly. Be honest. Underccounting here is the most common way operators fool themselves.
Total covers served. The headcount through the kitchen that week.
That’s it. Three figures. Now we run them through the diagnostic.
Take your ex-VAT food sales and divide by total kitchen hours.
This is the single most revealing number in a pub kitchen, because it tells you whether the food operation produces enough revenue to justify the labour it consumes. Everything else is downstream of this.
Under £55: The kitchen is structurally negative. It’s losing money on most services and being carried by the bar.
£55 to £75: The bar is subsidising the kitchen. Profitable site, unprofitable food.
£75 to £90: The kitchen is roughly sound. The leak, if there is one, is elsewhere.
Over £90: The food operation is genuinely earning. Protect whatever you’re doing.
Most struggling pubs come in under £65. If yours does, the kitchen is the problem, not the marketing, not the footfall, not the local economy. The structure is wrong.
Take your total covers and divide by total kitchen hours.
This is your labour density. Where revenue per hour tells you whether the kitchen earns enough, density tells you why. It measures how much output the kitchen produces for the labour it consumes, stripped of pricing.
Under 1.8: Structurally inefficient. The menu is almost certainly too complex for the team, the prep burden is too heavy, or both.
1.8 to 2.2: Marginal. Some inefficiency, fixable.
2.2 to 2.4: Healthy. The kitchen is producing properly.
Over 2.4: High performance. The system is well built.
Read this number against the first one. A kitchen with low revenue per hour AND low density has a menu structure problem. A kitchen with healthy density but low revenue per hour has a pricing problem. The two numbers together tell you where to look.
This one needs a little more than division, but not much.
Take your three or four highest-selling dishes, the ones customers use to judge your whole menu, and calculate their contribution margin: menu price ex-VAT, minus food cost, minus a rough labour charge if you have one.
Then take your three or four lowest-selling dishes and do the same.
You’re looking for one specific pattern: are your highest-volume dishes also your weakest-margin dishes? In struggling pubs, they almost always are. The dishes carrying the most covers are quietly carrying the least contribution, which means the busier the pub gets, the faster it bleeds.
Anchors are healthy margin: Good. Your volume is working for you.
Anchors are weak margin: Your food cost is the leak. Fix the dishes, don’t touch the prices.
Hidden gems sitting at untouched prices: This is recoverable margin. The £14 ceiling is costing you.
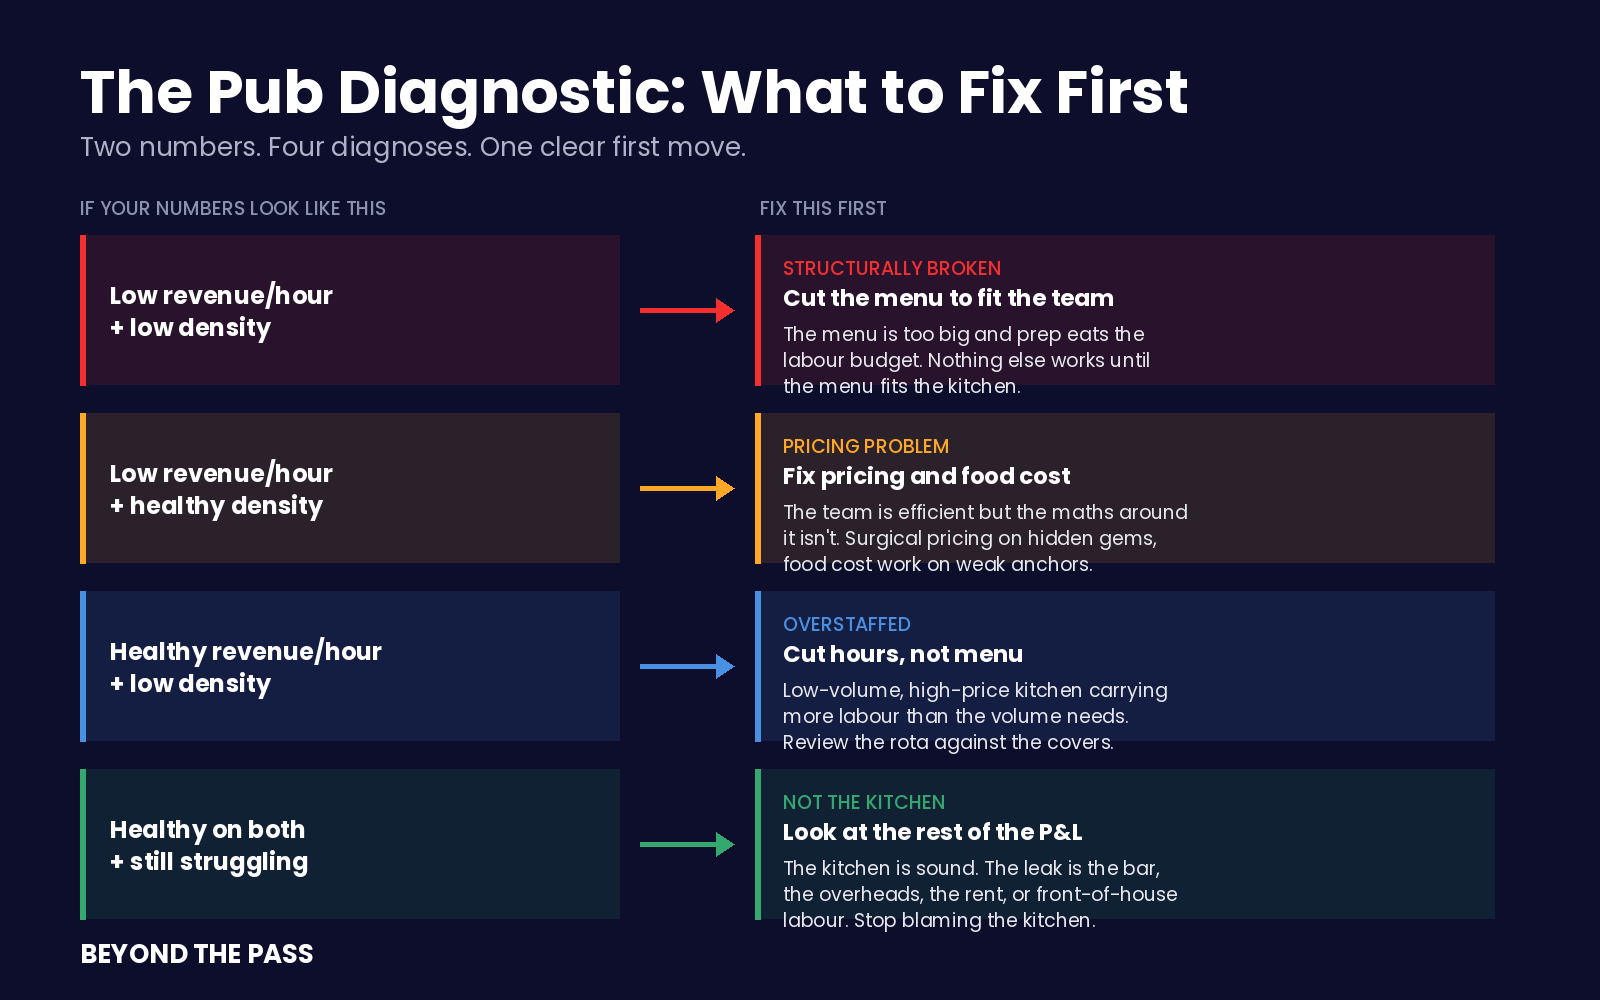
Three numbers give you four possible diagnoses. Each one points to a different first move. This is the decision gate.
Low revenue per hour + low density. Your kitchen is structurally broken. The menu is too big for the team and the prep is eating the labour budget. First move: cut the menu to fit the team’s technique bandwidth. Nothing else works until the menu fits the kitchen. Not pricing, not hiring, not marketing.
Low revenue per hour + healthy density. The team is efficient but the food isn’t priced or costed correctly. First move: surgical pricing on hidden gems and food cost work on weak anchors. The kitchen works; the maths around it doesn’t.
Healthy revenue per hour + low density. Unusual but it happens, usually in a low-volume, high-price kitchen. First move: review whether you’re overstaffed for the volume. Cut hours, not menu.
Healthy on both + still struggling. The kitchen isn’t your problem. First move: look at the bar, the overheads, the rent, the labour on the front of house. Stop blaming the kitchen and look at the rest of the P&L.
That’s the whole diagnostic. Three numbers, fifteen minutes, one clear first move. Most operators have never run it, which is exactly why most struggling pubs stay struggling: they fix the wrong thing first, burn six months, and end up more convinced than ever that the problem is unsolvable.
It usually isn’t. It’s just been misdiagnosed.
It tells you which layer is broken. It doesn’t fix the layer.
Knowing your menu is too big doesn’t tell you which dishes to cut or how to rebuild the prep around shared components. Knowing your anchors are weak-margin doesn’t tell you which costs to attack or how far. Knowing the kitchen is sound doesn’t tell you where in the rest of the P&L the money is going.
That’s the gap between diagnosis and repair. The diagnostic is the fifteen-minute version that tells you where to point. The repair is the work.
If you’ve run these three numbers and the picture is uncomfortable, the Kitchen Profit and Labour Clarity Toolkit is the next step. It takes every framework from this pub series, the labour line separation, the density benchmarks, the technique bandwidth math, the pricing map, and turns them into the actual working tools to fix what the diagnostic just found. Same logic you’ve read across these five posts, built to run on your own numbers, dish by dish, service by service.
But run the three numbers first. Even if you never buy a thing, you’ll know more about your pub than you did fifteen minutes ago. And knowing where the money goes is the entire game.
---
This is the final post in the UK Pub Economics series. If you found it useful, the free 15-minute diagnostic here runs this exact assessment on your own numbers automatically. The full toolkit is there too, for operators ready to fix what they find.
Next series starts soon: Street Food Economics. Why busy traders still make nothing, and the break-even most never calculate.
Thanks for reading Beyond the Pass! This post is public so feel free to share it.
No posts
Comments
Nothing yet. Say the first thing.
Sign in to join the conversation.