
Detention Reports is now updated with the latest ICE detention management data published on Monday. ICE’s national detained population totals about 66,000 people—still under the high in January of over 70,000 but higher than the most recent data release three months ago, which pinned the population at just over 60,000. In this post, we explain how Detention Reports answers the question: where are people being held? And we talk through some key findings and updates to the data we include on the site.
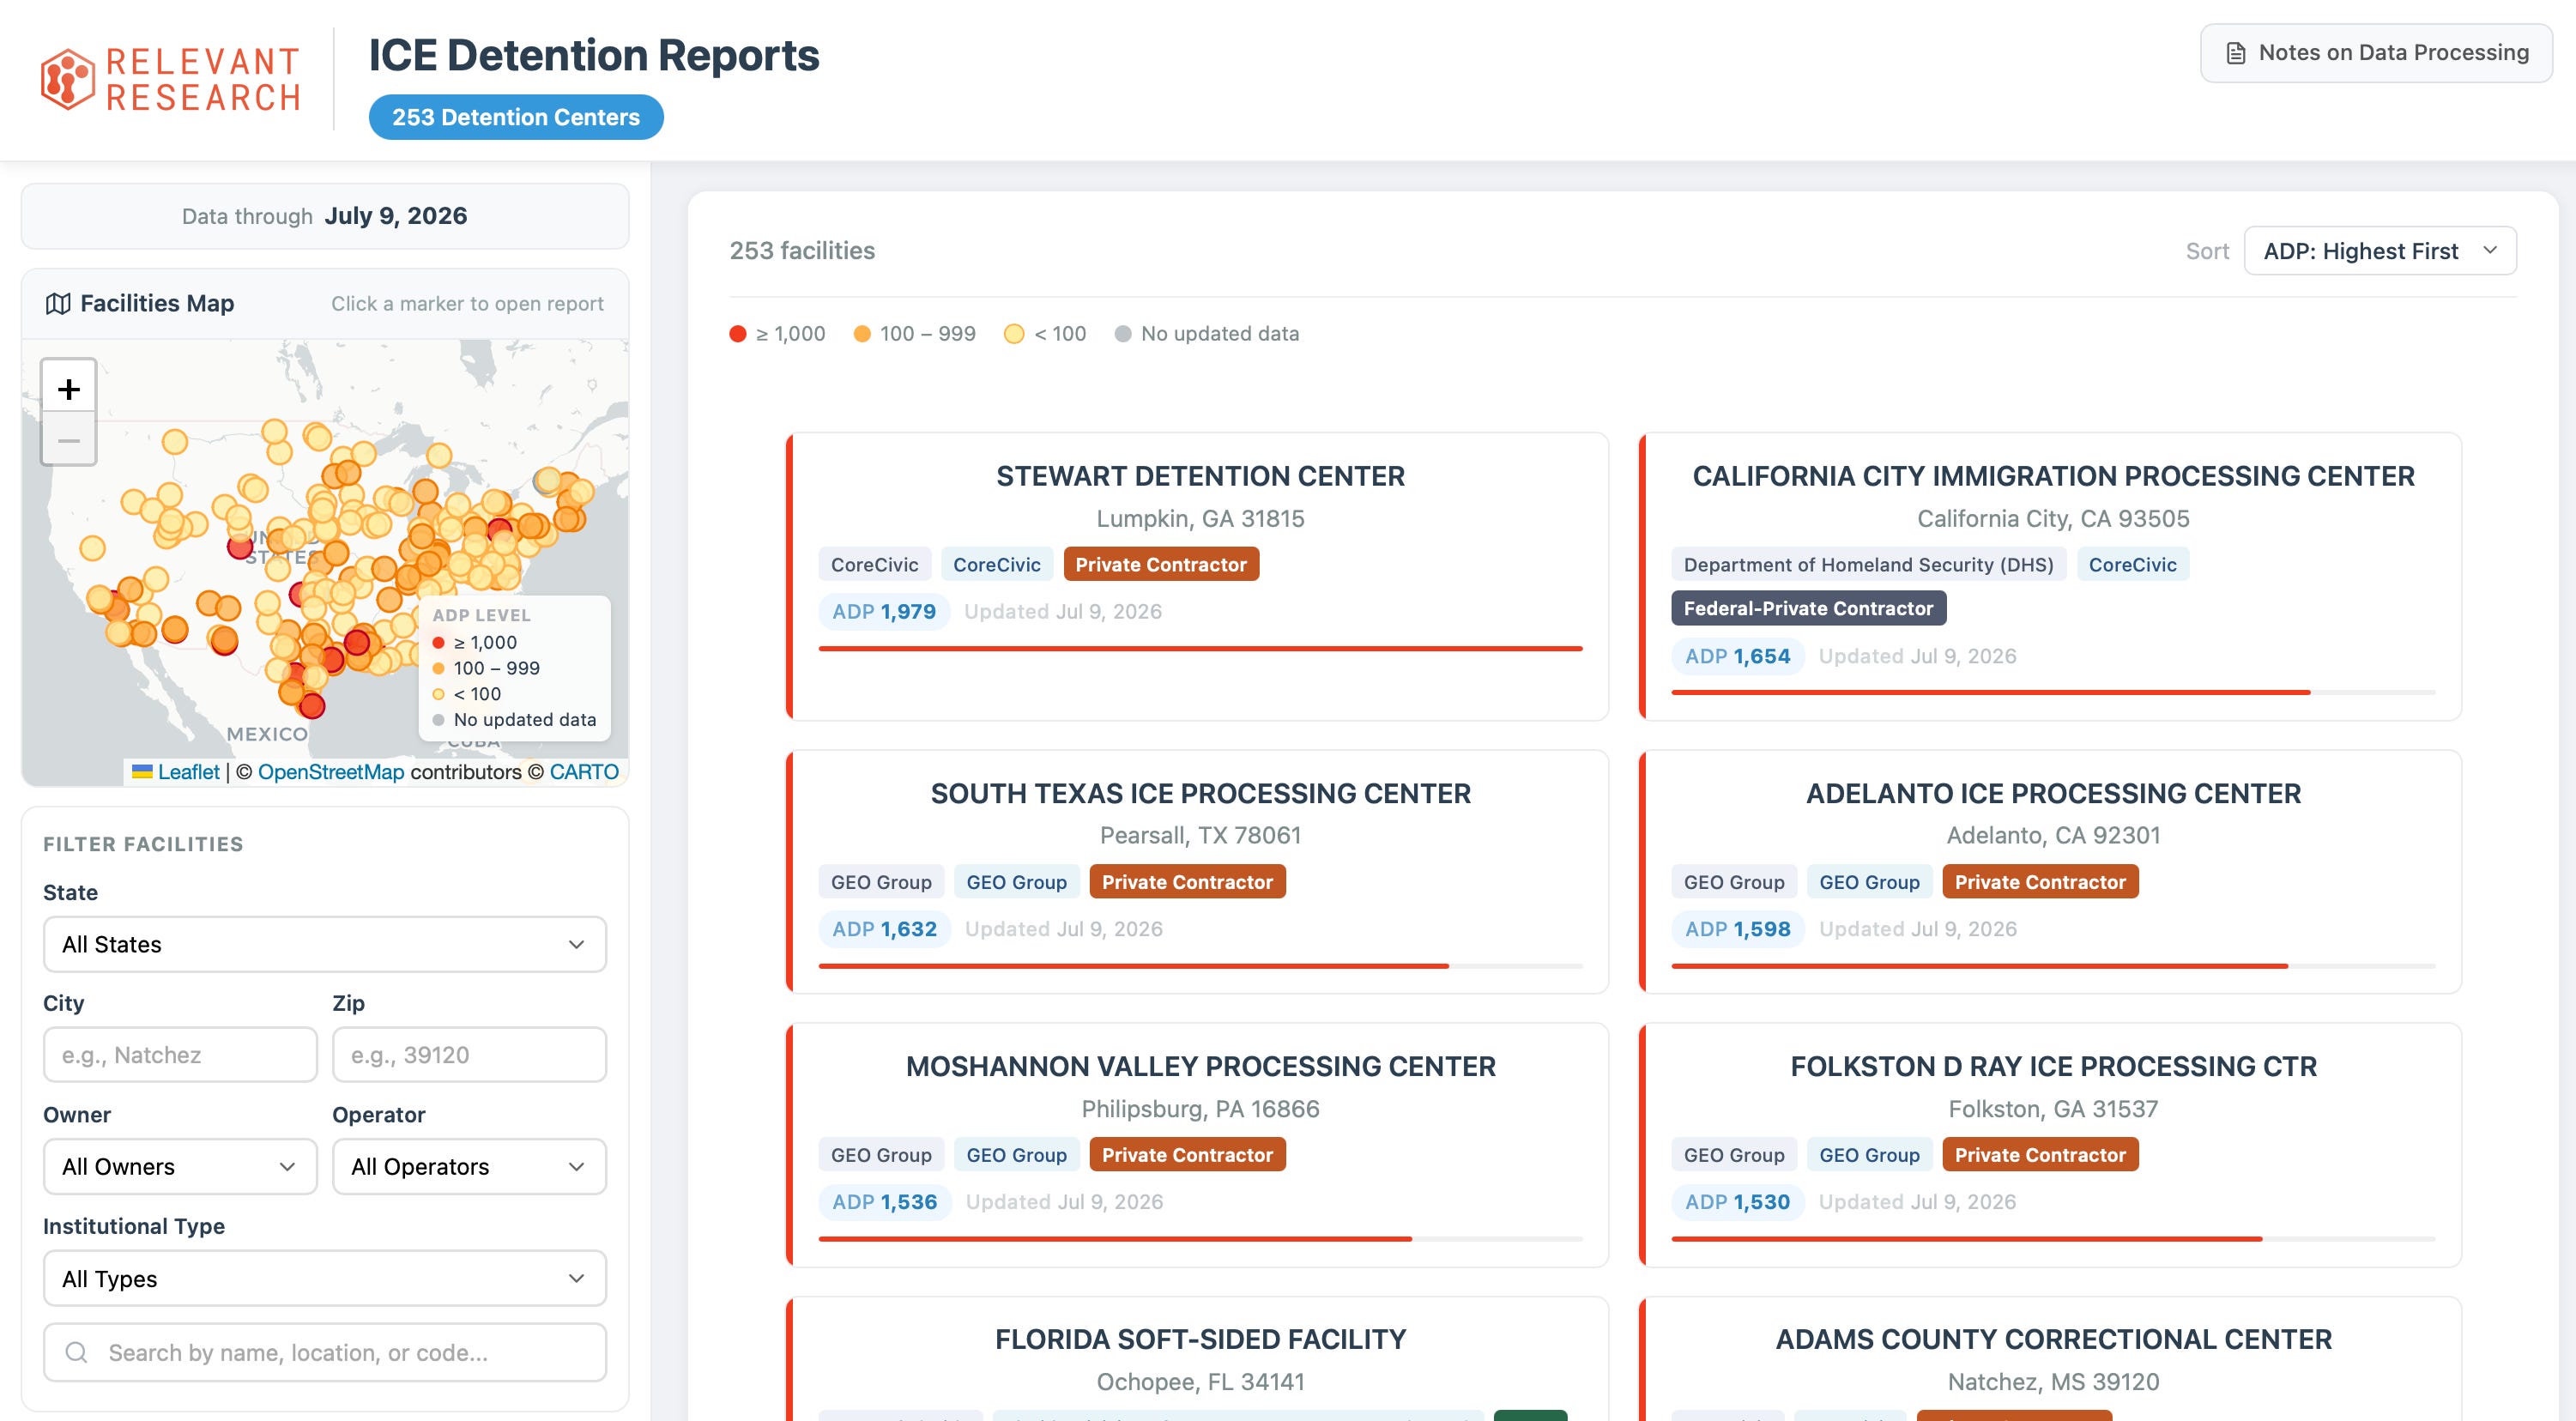
First things first. DetentionReports.com, a project from Adam Sawyer and the Relevant Research team, is designed to make detention data more understandable and citable by reporters, researchers, policymakers, and interested members of the public. Using public data and a method developed by Relevant Research called Interval ADP, the team calculates the current average population at individual detention facilities in use across the country.1 The facility-level reports provide additional data in a searchable format with stable links to reports that can be easily referenced over time. If this is your first time hearing about Detention Reports, read our first announcement last year, see the updated design and features, and visit the about page on the site for a detailed log of changes, methodological decisions, and history of the project.
Detention Reports would not be possible without the contributions of the Relevant Research data team, including Michael Ale, who has worked on the project since the beginning, as well as Nush Ojha and Rashmi Singh, with ongoing contribution from Riwaj Chalise and the development team. Sunita Kunwar was instrumental in the initial conceptualization of the project.
The updates were originally announced by Adam on Bluesky. Follow him there for more immigration data.
You may have noticed that it’s been a while since we’ve updated the site with new data. There’s a simple explanation. This data previously came from a mandate in appropriation acts since 2018—but when Republicans move forward with a party-line funding bill earlier this year, they chose to exclude the simple provision they’ve agreed to for years that required ICE to provide at least some minimal transparency.
After the previous data release in early April, therefore, the agency’s immigrant detention data has gone completely dark. Why the agency chose to release data now is a mystery. But as my dad used to say, don’t look a gift horse in the mouth (although I’m still not sure what that means). We’re always happy to have new data, and we hope that our work illustrates the value to be gained of ICE continuing to release this data with or without a mandate. ICE is clearly still producing this data and they can proactively release it anytime they want. With that said, let’s look at key trends and new resources we’ve added to the site.
As Adam said to me when we looked at the data, it’s important to remember that the long break in data does blunt the precision of the observations. Interval ADP uses two consecutive data releases to calculate period averages—so longer periods between releases necessarily imply greater uncertainty. Real totals at each facility may be higher or lower than the data shows. Despite this caveat, these numbers are the best current data the public has on the detained population by facility.
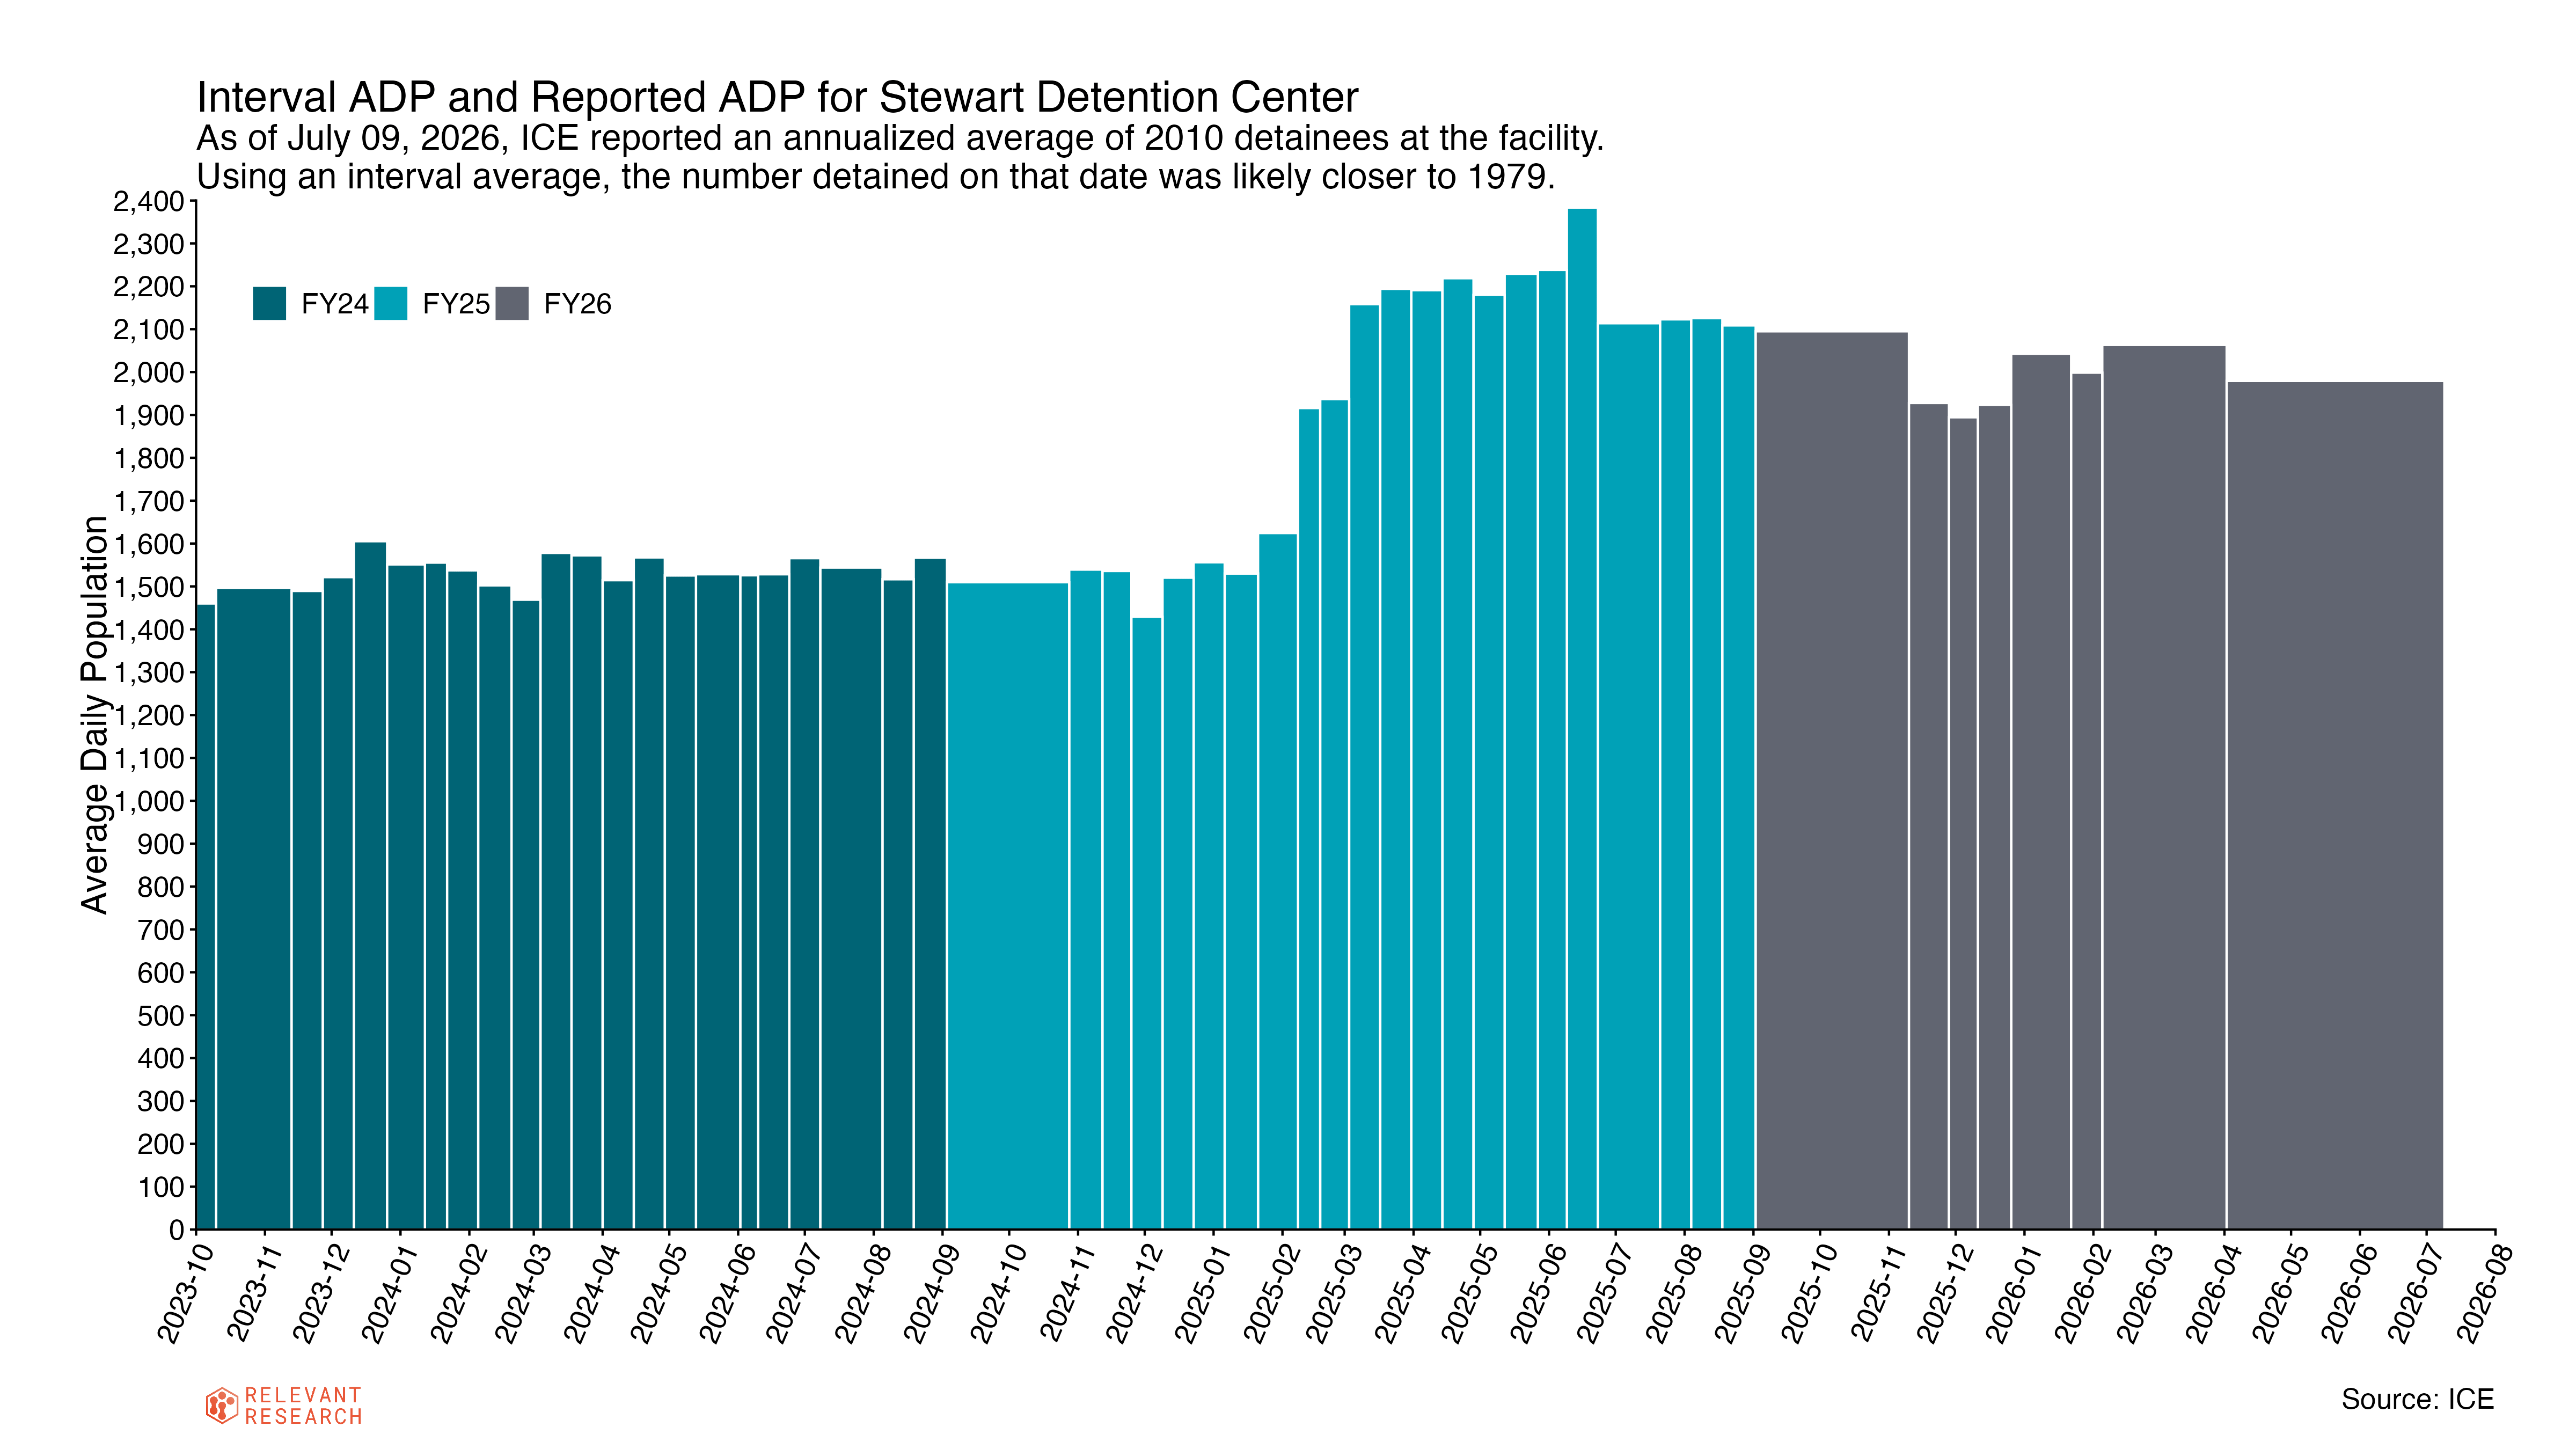
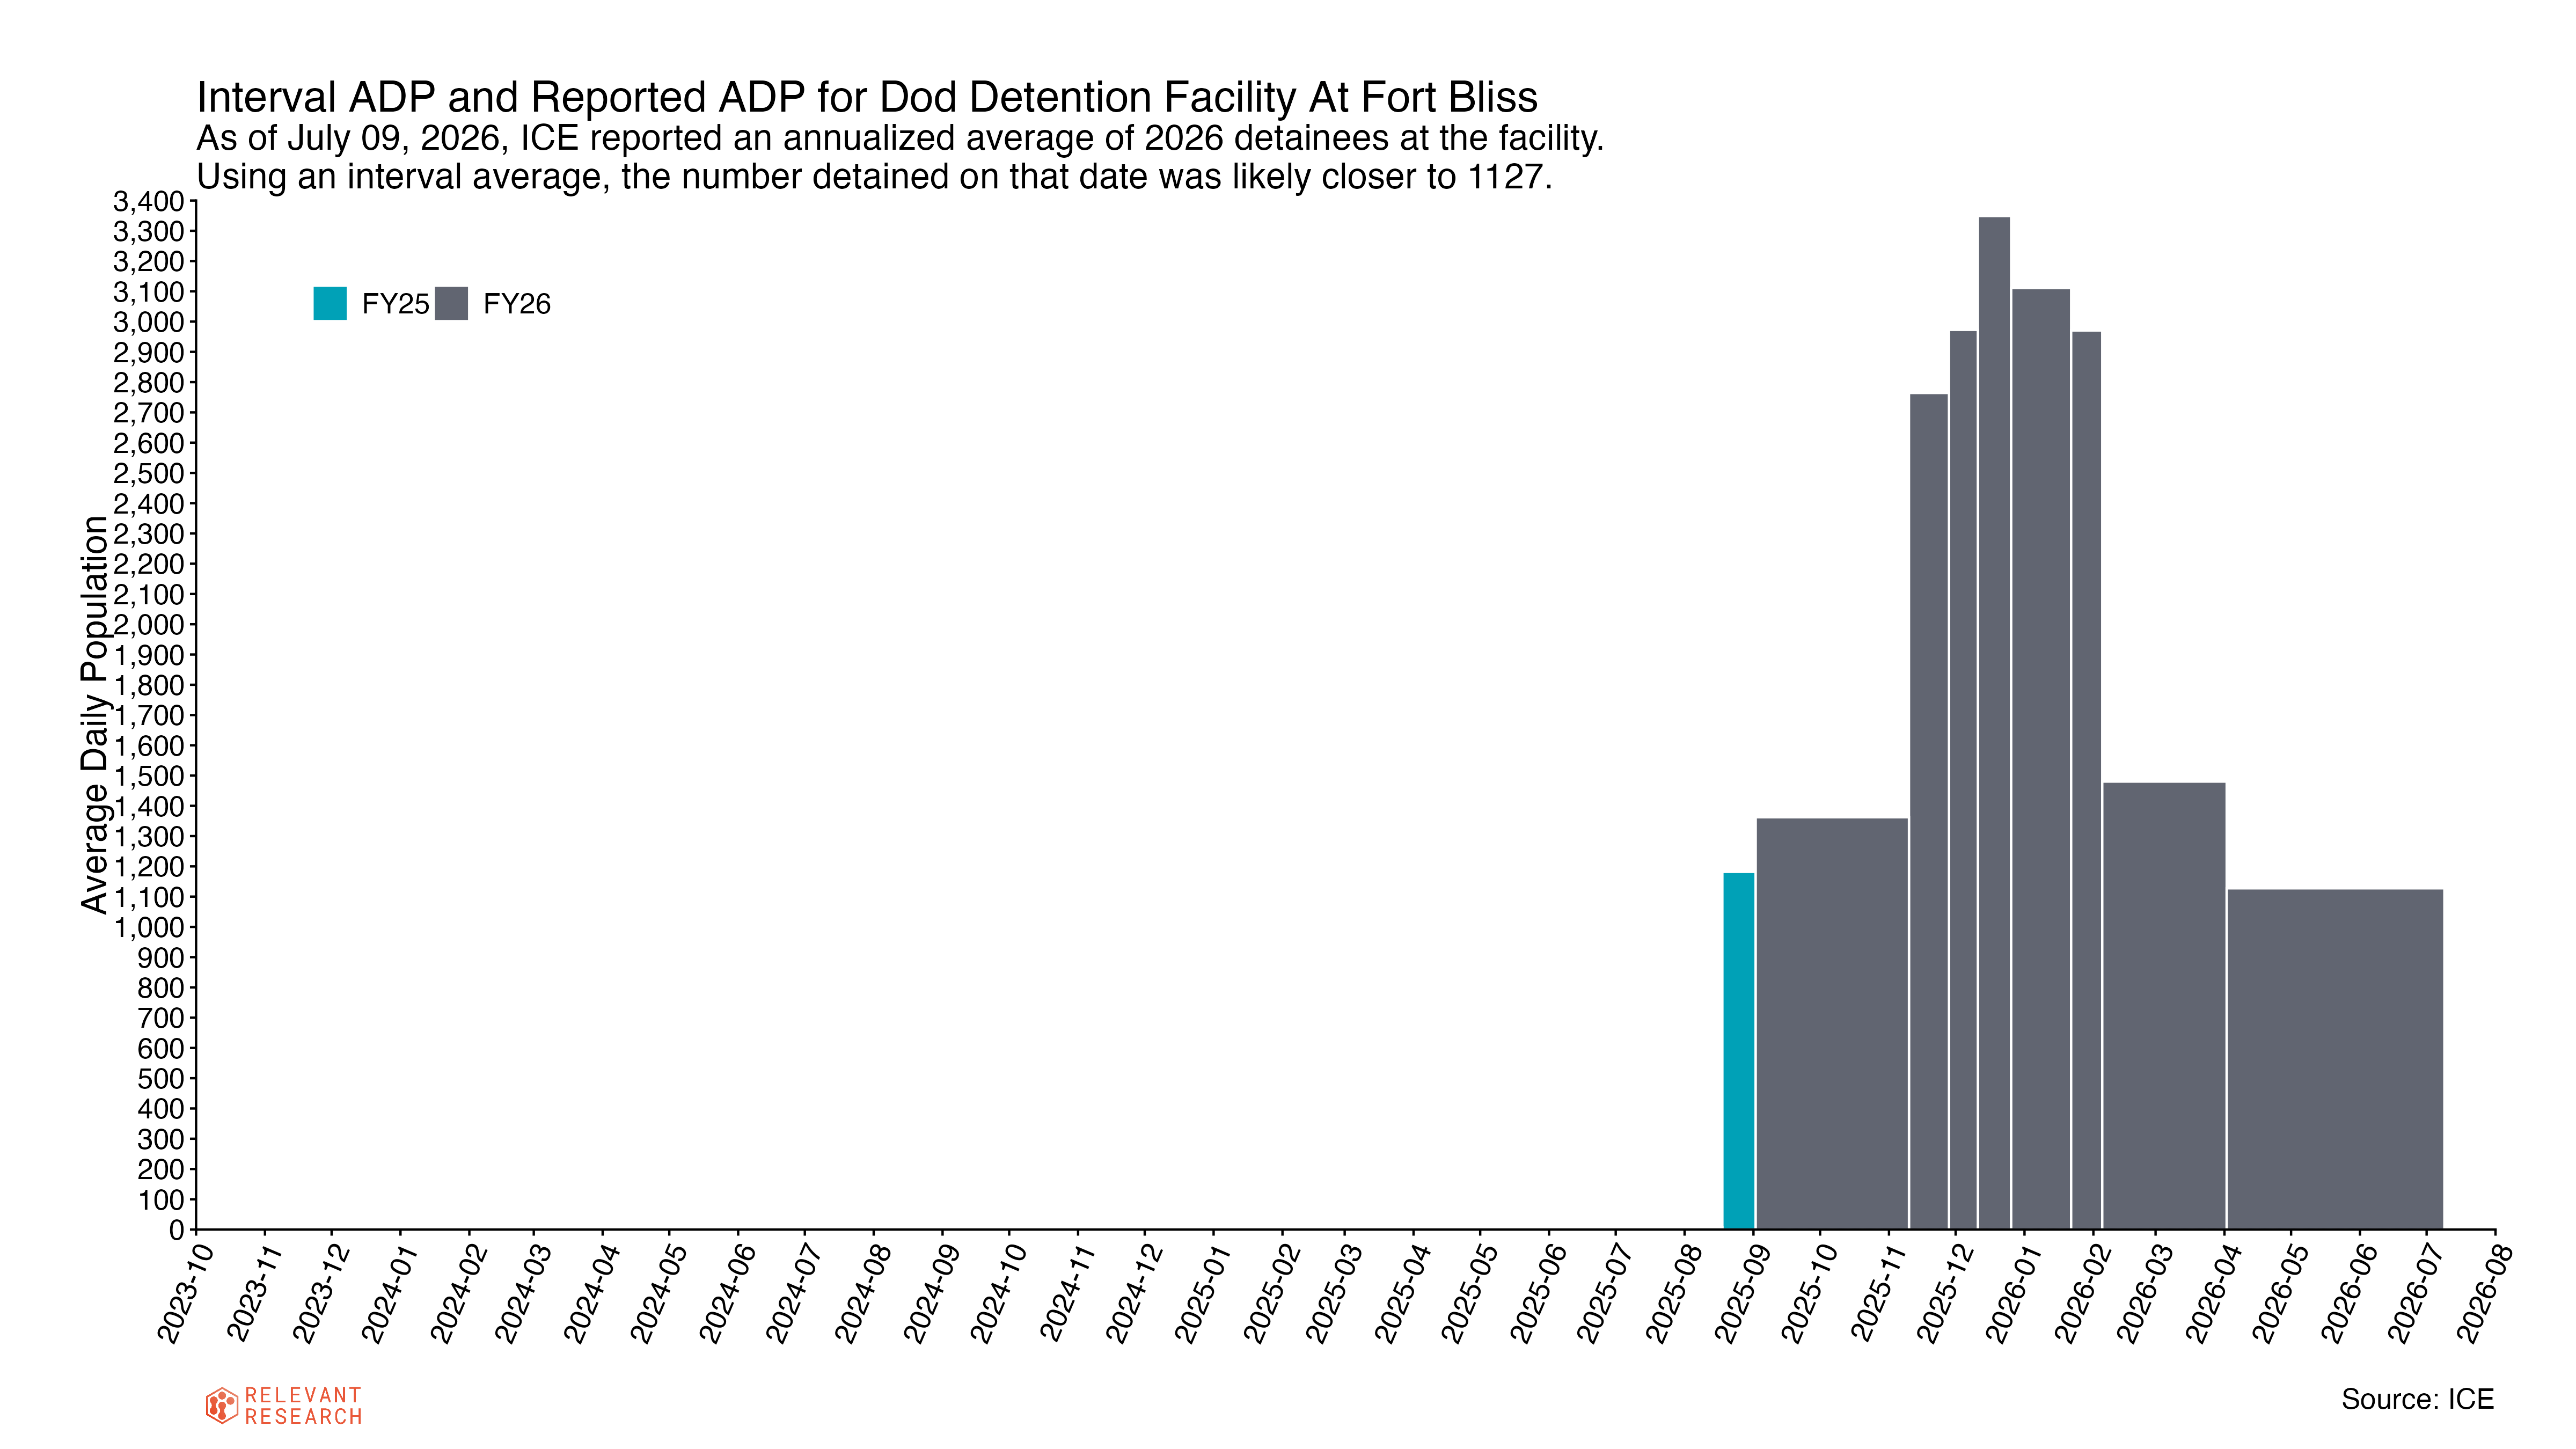
Camp East Montana outside of El Paso (aka Fort Bliss) and Stewart Detention Center in Georgia are still the two largest facilities by capacity and current population (respectively). Stewart’s population remains high while Fort Bliss has dropped dramatically from its height at the beginning of the year (but still holds more than a thousand people).
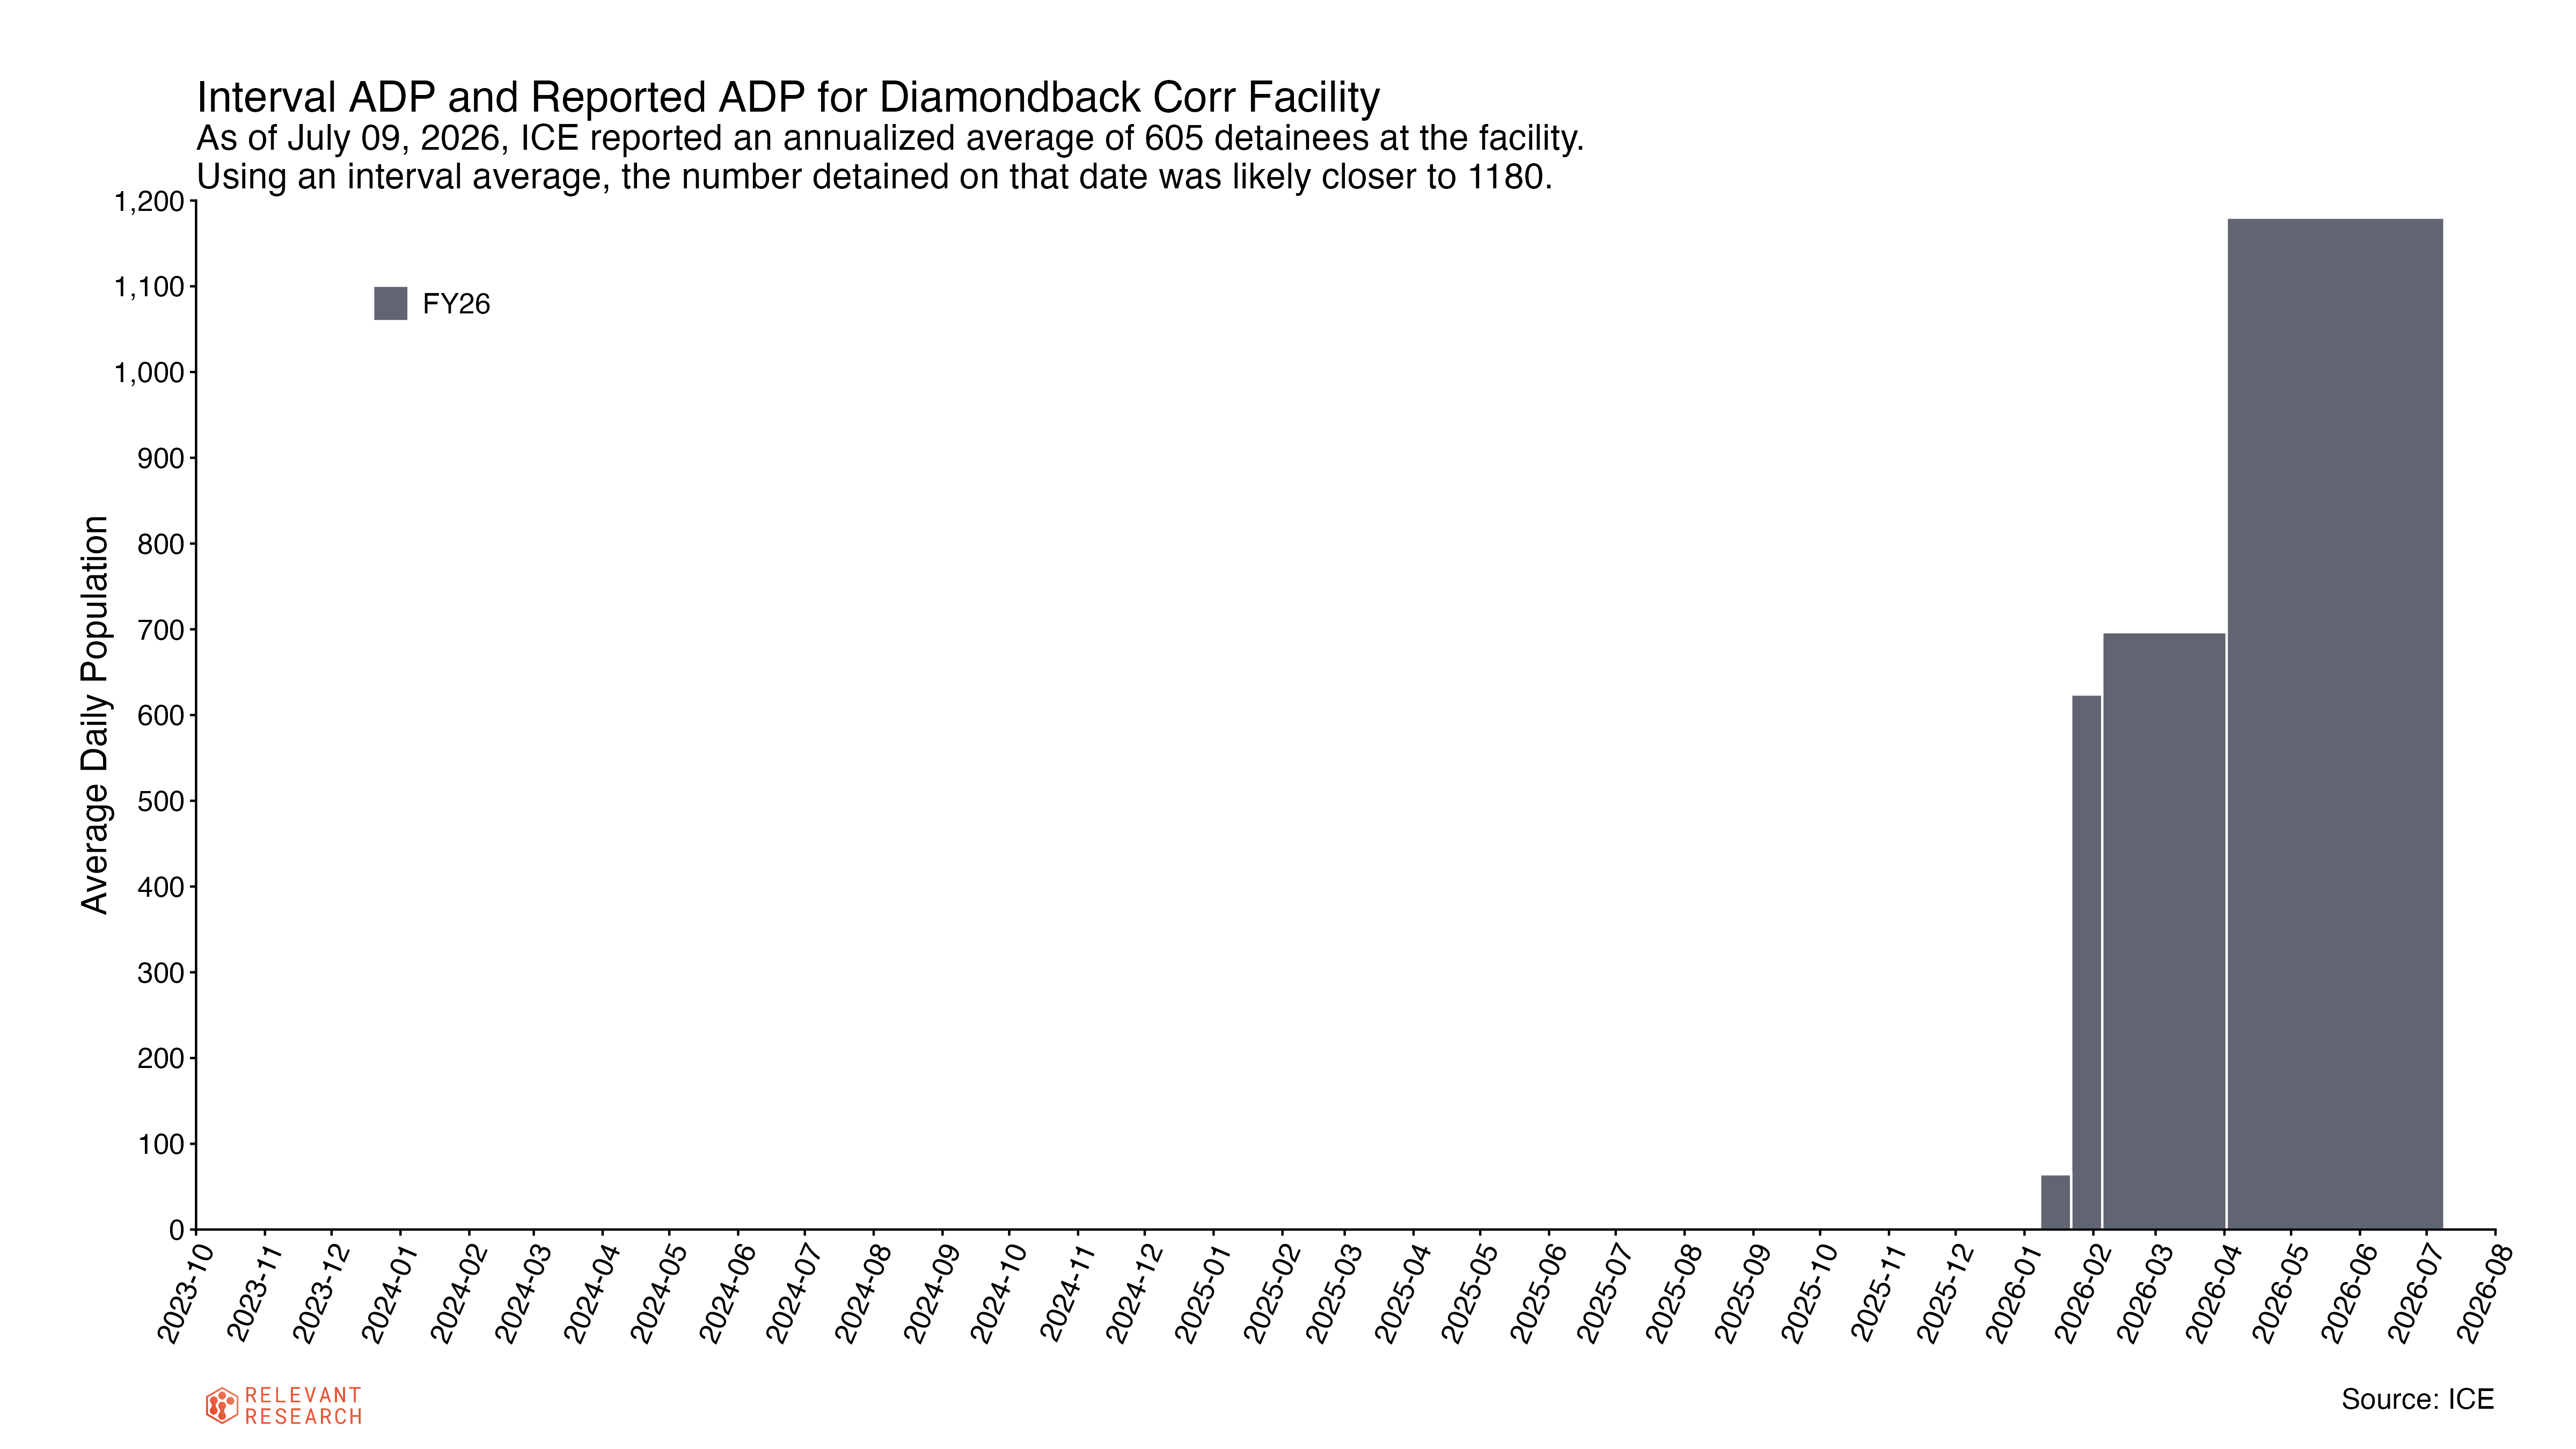
Other facilities have exploded in population. Diamondback Correctional in Oklahoma shot up over 1,000 since the start of the year (and may be even higher right now), as has Folkston in Georgia, and the smaller but still significant Midwest Regional in Leavenworth, Kansas, which has seen huge growth since April. The Florida Soft Sided facility (Alligator Alcatraz) is not on the current list since it has closed.
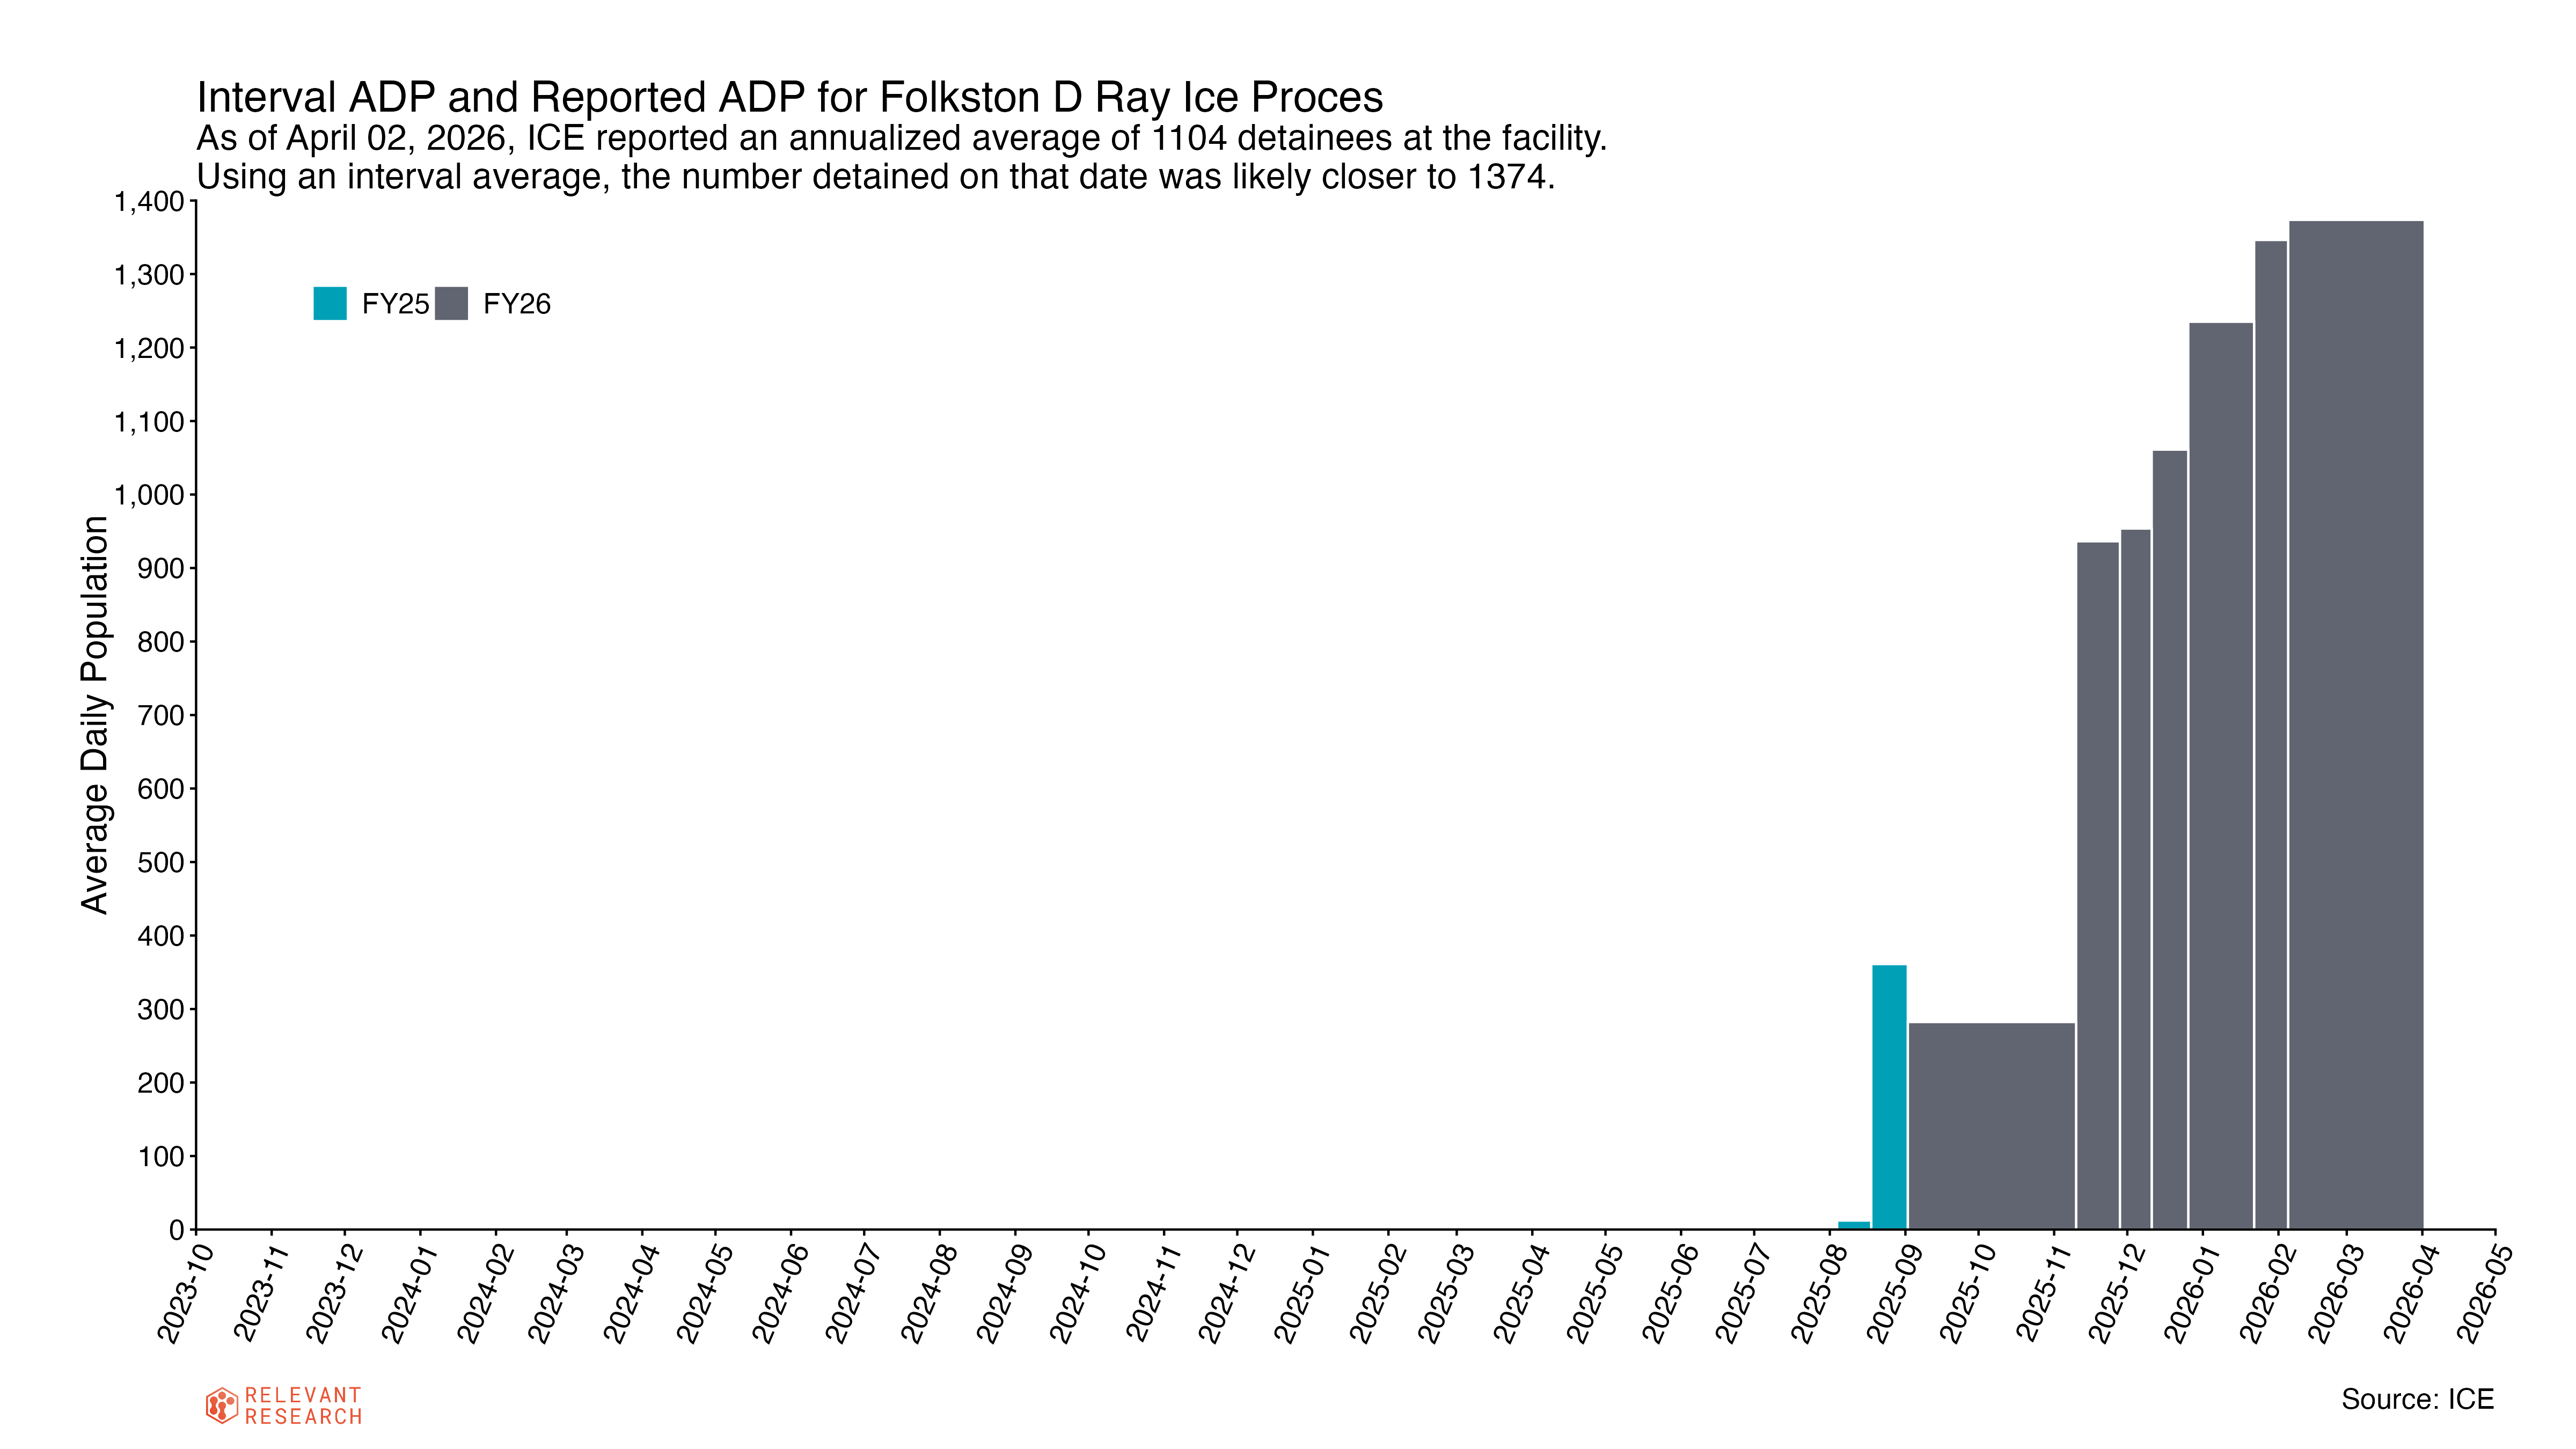
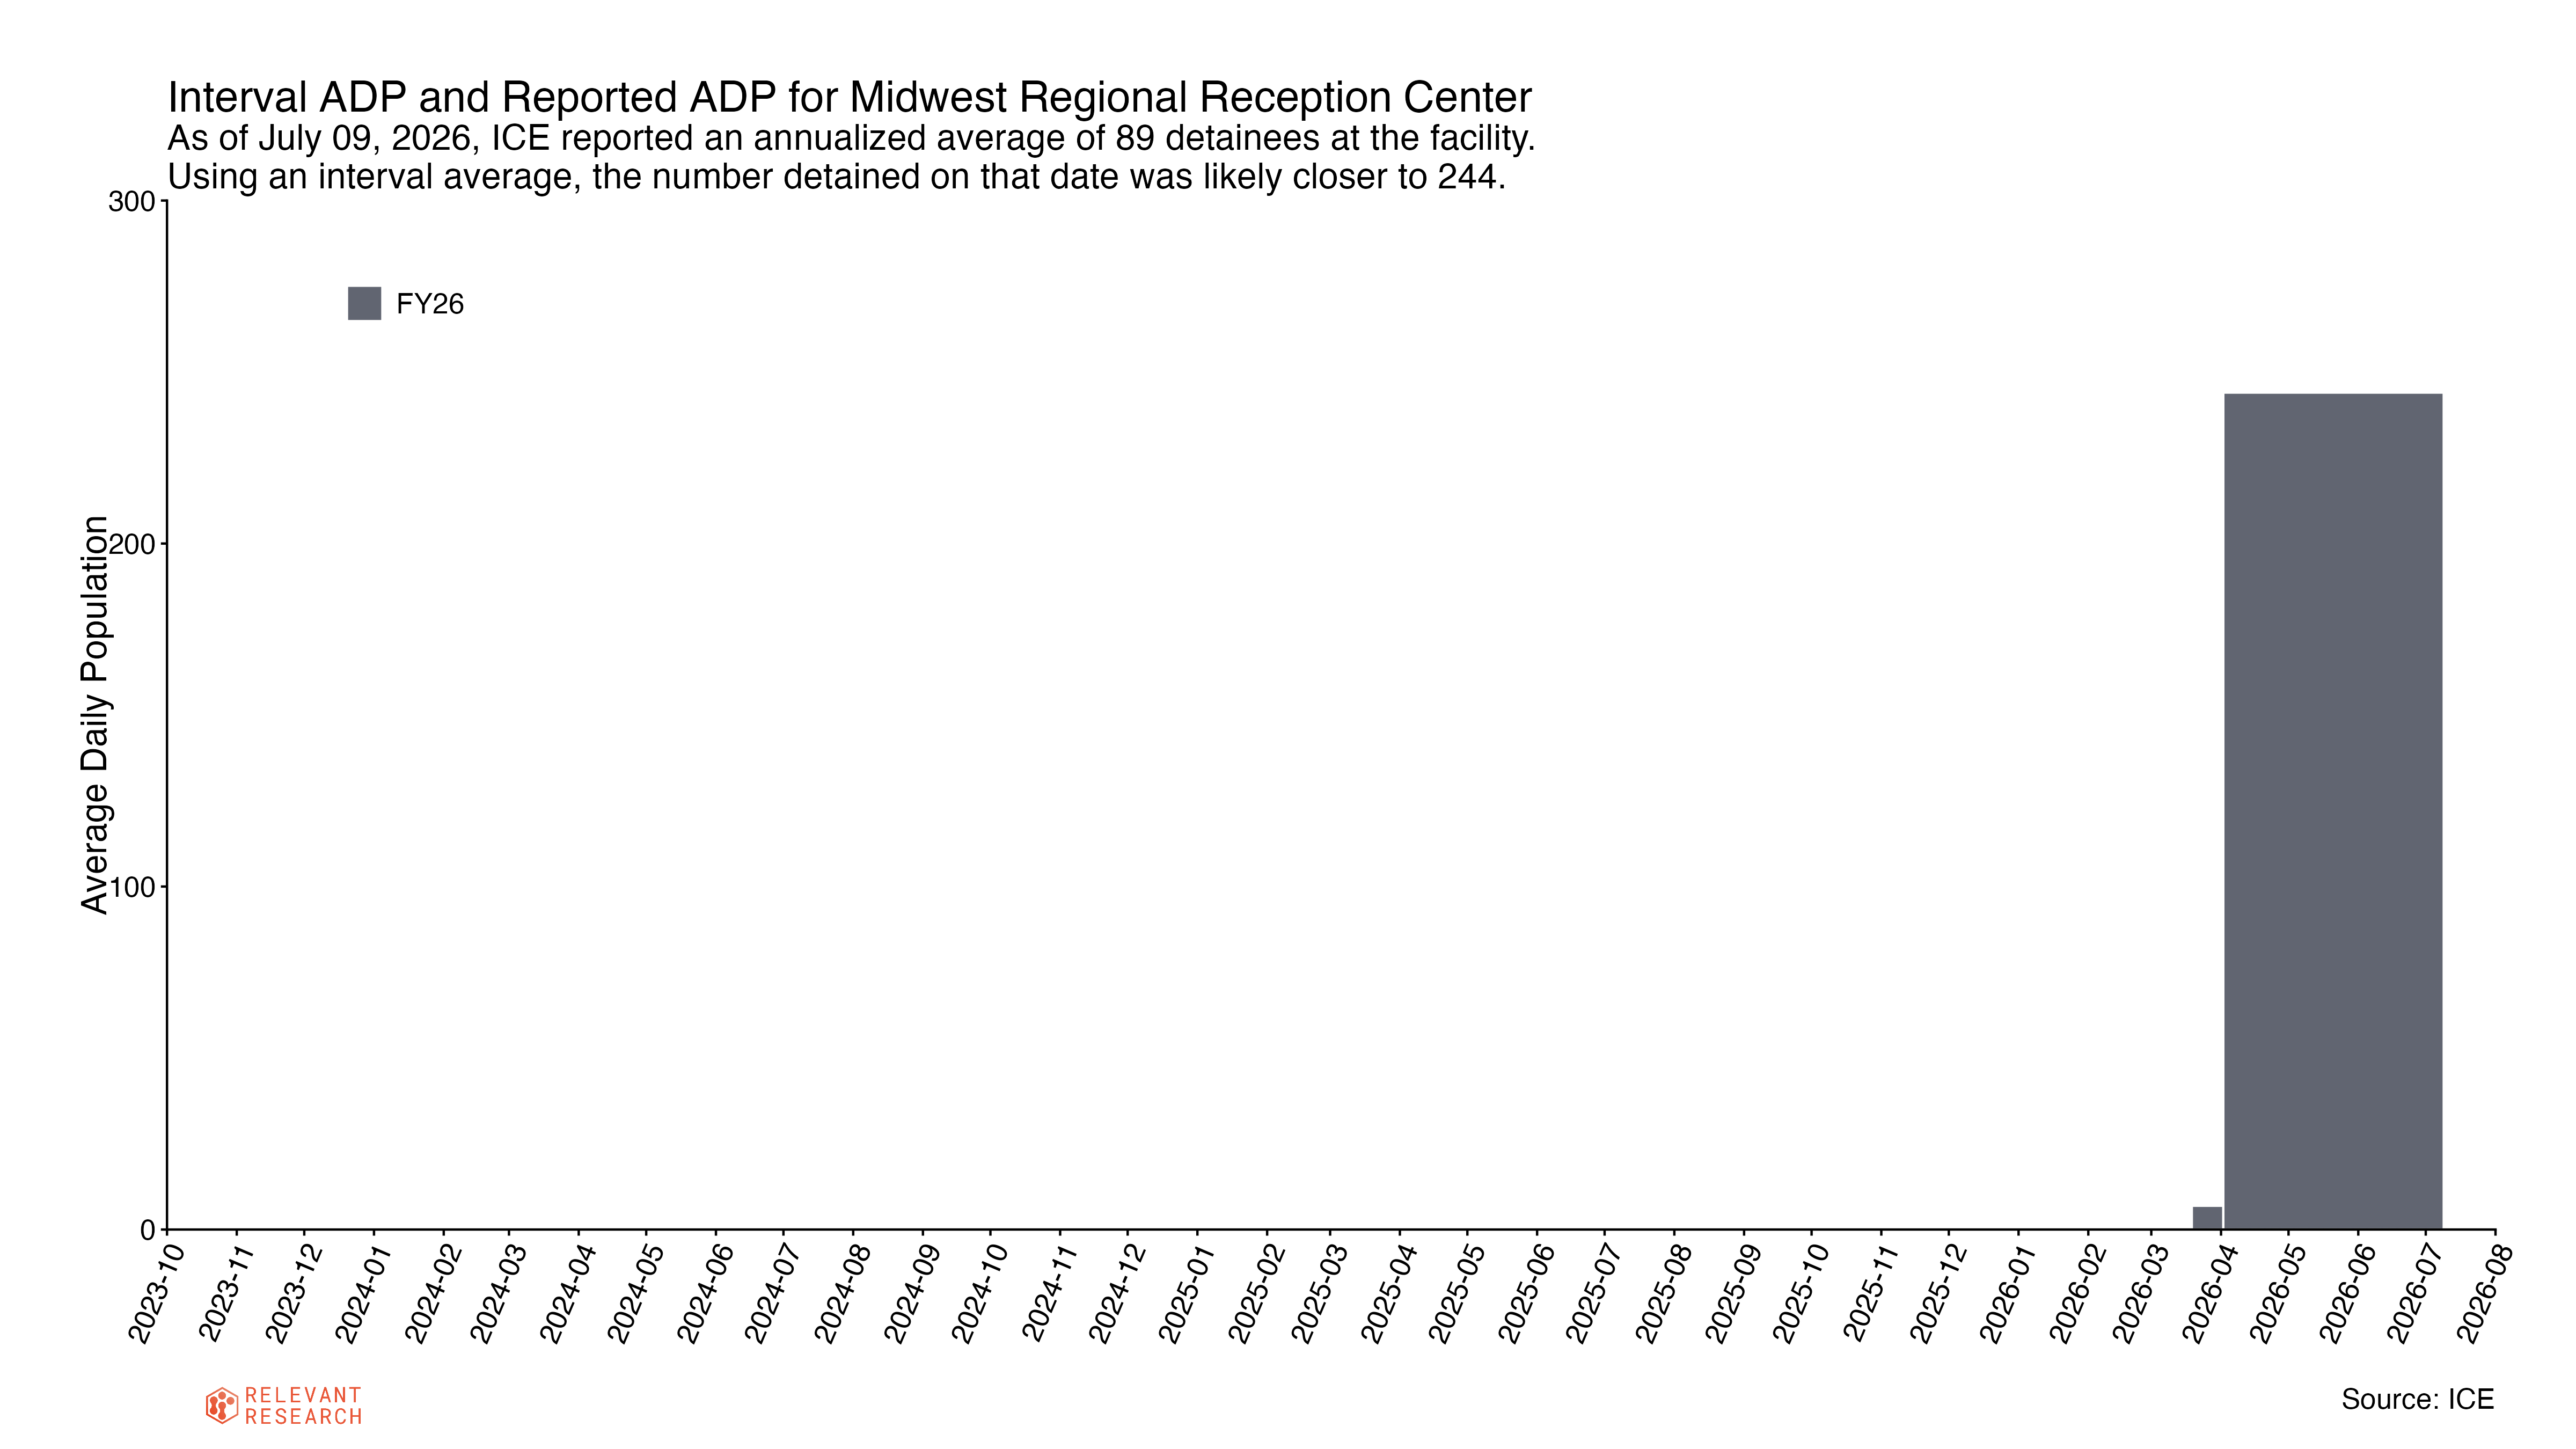
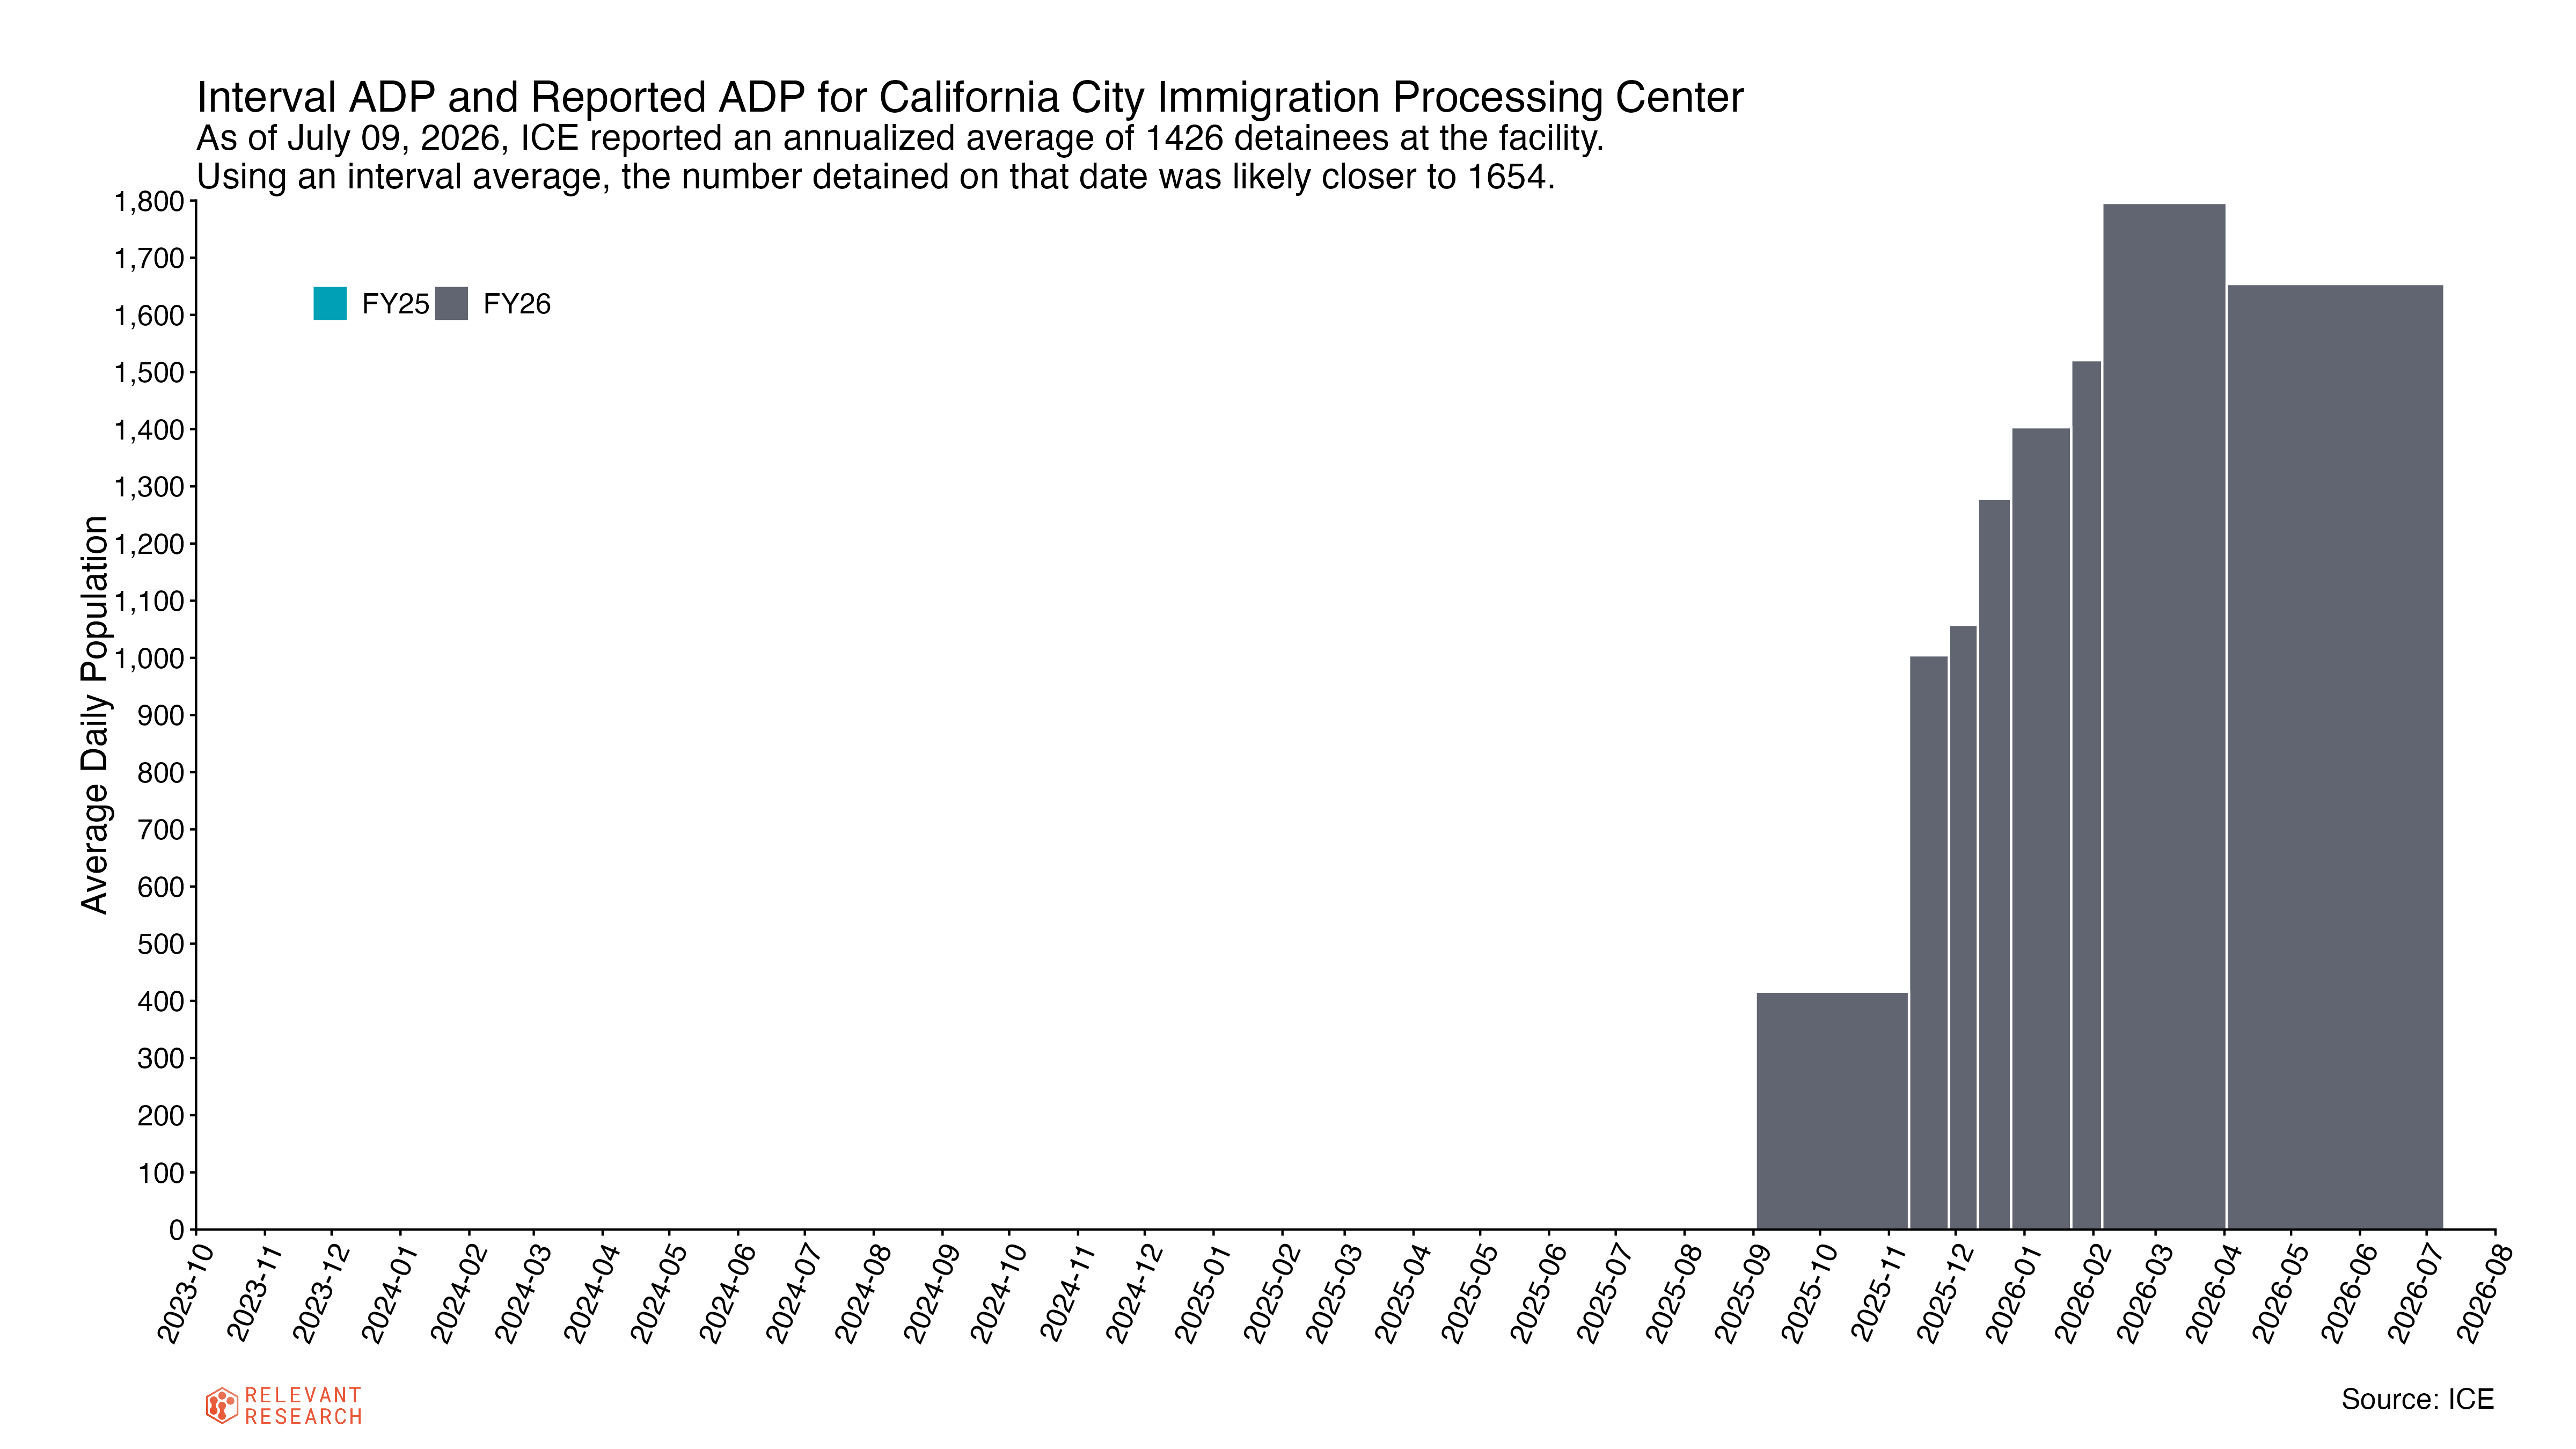
California City Processing Center2 stands out not just for it’s growth in the past year but for one additional peculiar fact: it is one of the first facilities that ICE decided to purchase outright—the taxpayer now owns this facility—while maintaining the operating contract with Geo Group. Read my longtime colleague Wendy Fry’s article with Nigel Duara for CalMatters to learn more about what going on. (“What the sale of 2 ICE detention centers reveals about Trump’s new immigration strategy.”)
This new and increasingly complex detention system—especially where DHS is buying up warehouses and now buying up detention centers—presented us with an additional data question: how to represent these new entangled relationships so that the public can trace the ownership and operations of these facilities? ICE does not maintain a public repository of these facts and the detention spreadsheet itself does not include this data.
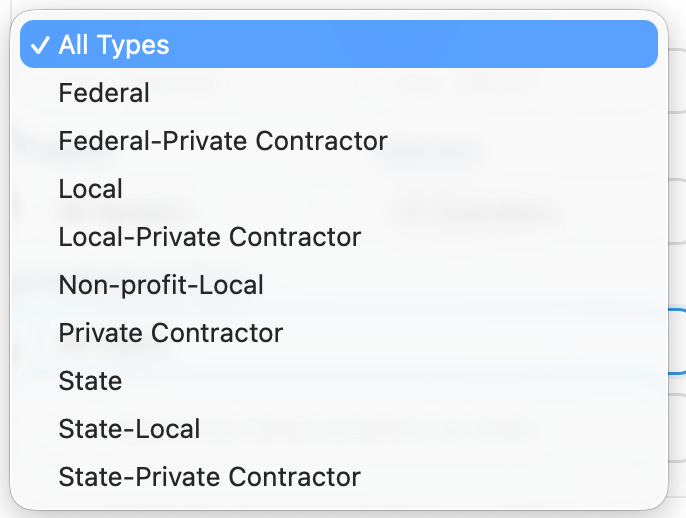
To solve this, Adam and his team went over all available public data to assign owner and operator to each facility, noted when the two are not the same, and created additional categories for the various permutations of federal, private, and local owner-operator relations.
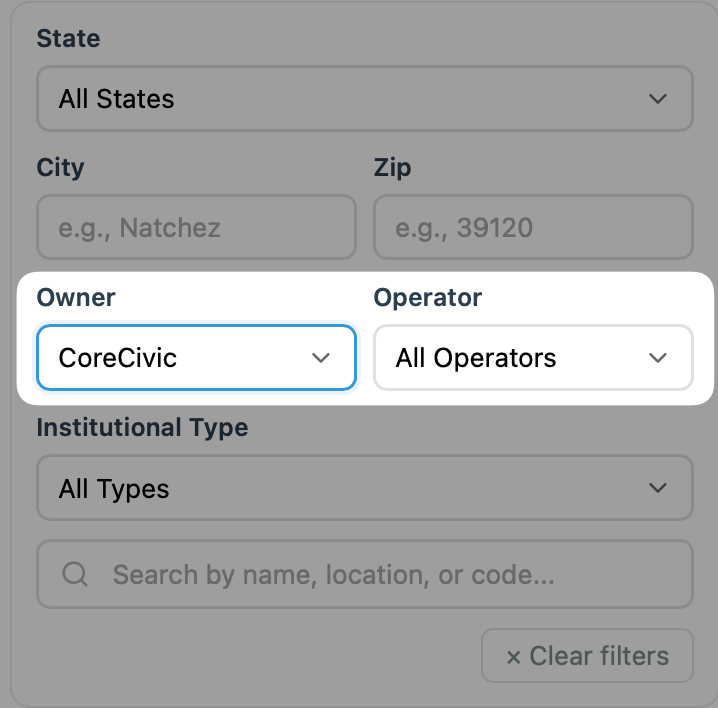
When you visit Detention Reports now, you’ll notice new filtering options on the left that allow you focus on types of owner-operator relationships, as well as filter in on all facilities by specific contractors like CoreCivic. It’s a simple yet elegant way to get more information you need from a trusted source.
We also note that five new facilities have been added to the dataset since early April:
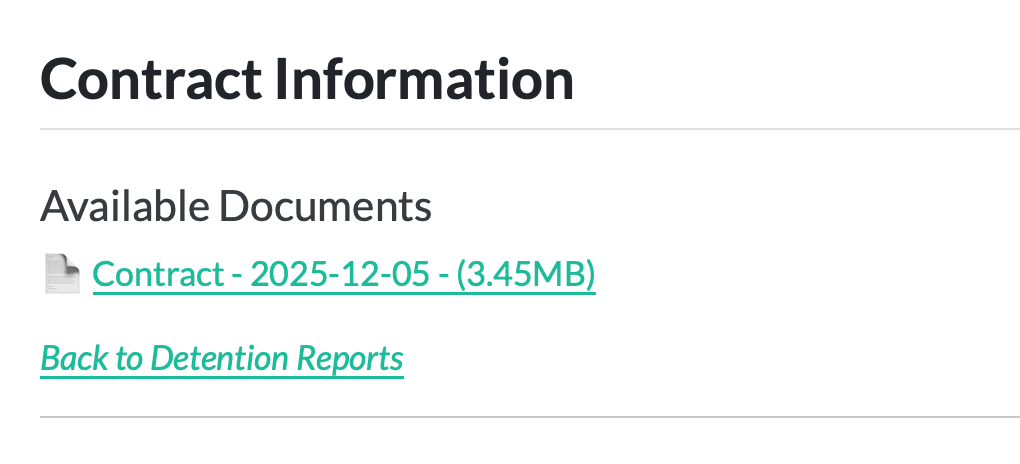
To enrich Detention Reports even further, the Relevant Research team is collecting and posting detention center contracts from a quiet publication source on ICE’s website as well as crowdsourced contributions and other sources available online. The latest update includes 45 more contracting documents across 18 facilities, for a total now of 164 contracting documents across 78 facilities. You can find those contracts at the bottom of any facility that has them. If you have any contracts you’d like to add, reach out to Adam.
Adam and I will talk through the latest updates to Detention Reports on Monday, July 27 at 1:00 PM Eastern right here on Substack Live. The best way to join us is to make sure you subscribe and download the Substack app so you get a notification when we get started. Bring questions, comments, and feedback!
If you are writing about immigrant detention and have questions about how Detention Report data fits into your story, reach out to Adam Sawyer at adam@relevant-research.com.
Even in a period with less transparency than we would prefer, Relevant Research is committed to applying our specialized skills set and deep domain area expertise to making data available, understandable, and usable to a wide variety of audiences. If you are need on demand support for projects at the intersection of immigration research, data science, web/app development, and public communication, contact us at contact@relevant-research.com.
A full description of the methodology is available in our white paper.
Comments
Nothing yet. Say the first thing.
Sign in to join the conversation.