
Hello Antonis here!
It’s been a while and I’ve missed you! I want to start with a warm welcome back. You might have noticed the long pause since my last post. Life took a busy turn as I relocated from Thessaloniki to Athens and stepped into a new role, which demanded my full focus for a while. Thank you for your patience during this. Now, I’m excited to resume our journey in data analytics conversations. In fact, we’re coming back strong with a regular schedule…you can expect new DataConscious posts every Wednesday or bi-weekly moving forward.
Let me reintroduce what DataConscious is all about. This publication (and the accompanying podcast) centers on mindful, impactful analytics practices. We cut through the noise and focus on what truly matters: driving business impact through better decisions. With that mission in mind, let’s get to today’s topic to bridge the gap between theory and job market.
Today’s post (and podcast episode) takes a short break from our ongoing Data Career Compass series. I want to shine a spotlight on something very close to my heart: the course Data Analytics in Modern Corporate Business, which I have the pleasure of creating for the International Hellenic University (IHU) and professor Dimitrios Varsamis.
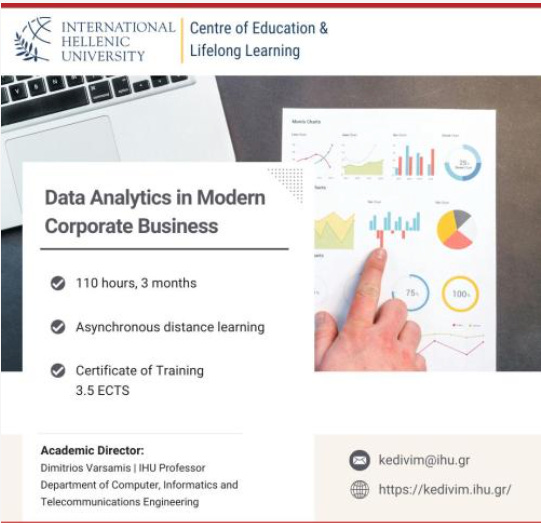
Why now? Well, the second cycle of this course is kicking off on October 1, and applications are open. It’s the perfect moment to reflect on what the course offers and share stories from those who’ve been through it.
To do that, I’ve invited a special guest Lampros Kouremenos, Financial Analyst at Ikos Resorts, an alumnus of the first cycle to join me on the podcast and in this write-up. Lampros was a standout participant and I’m thrilled to share his journey from the classroom to real world data challenges.
🎙 His path into data analytics: From a finance background in Greece and the Netherlands, Lampros saw firsthand how data and automation transformed finance teams. His curiosity grew during his time at a fintech company, where he realized the power of data to streamline processes.
🎙 Why this course: Having tried isolated courses before, he was drawn to Data Analytics in Modern Corporate Business because it offered the whole chain of data from databases to visualization in a structured way, tailored for professionals not yet fluent in data.
🎙 Bridging theory to practice: Lampros highlighted how self-learning often left him lost in fragmented resources and jargon. The course helped connect the dots, teaching him how SQL, Python, Git, BigQuery, and visualization tools fit together in real-world pipelines.
🎙 Capstone experience: Building an end-to-end pipeline — PostgreSQL → Datastream → BigQuery → Python ETL → Tableau/Metabase was challenging but eye-opening. He described the pride of seeing his dashboards live as “like a baby is born.”
🎙 Applying it at work: Back in his finance role, he advocated for creating a data warehouse, proposed staging tables to detect anomalies, and began introducing more automation and BI reporting practices. The course gave him both the vision and confidence to push these ideas forward.
🎙 Advice for newcomers: Don’t pursue analytics just because others do pursue it because you enjoy it. Start with fundamentals (data types, databases, SQL), then move to warehousing, automation, and BI. Build a portfolio of projects, stay curious, and use AI as a complement not a replacement to understanding the fundamentals.
🎙 Where the field is going: Lampros believes AI will accelerate workflows. To truly add value, professionals must understand fundamentals and business needs areas where AI still struggles.
Let’s start with a look at what the Data Analytics in Modern Corporate Business course is all about. I designed this program to help bridge the gap between academic theory and real-world practice in data analytics. Many aspiring analysts learn the fundamentals through university or online resources, but they often struggle with translating that knowledge into actual business impact. This course tackles that challenge head-on by providing essential skills and hands-on experience in a corporate data setting.
What does the course cover? In short, it walks participants through the modern data analytics stack from end to end. We start with the basics and progressively delve into the tools and techniques that data teams use in today’s companies. The curriculum is organized into five key modules, and along the way students engage in a realistic project that simulates a corporate environment. Here’s a quick rundown of the core components:
Data Analytics Fundamentals & Roles: Understanding the analytics landscape and the various roles (analysts, engineers, BI developers, etc.) sets the stage for everything. We discuss how data fits into business strategy and the common pain points in organizations so you know why you’re doing what you’re doing.
Working with Databases & SQL: Every analyst needs to speak SQL. We use PostgreSQL to teach relational database concepts and querying skills, so participants learn to pull insights from transactional data. This covers the core work of accessing and preparing data.
Version Control with Git: Modern data work is collaborative and code-driven. We introduce Git for version control and project collaboration, ensuring students adopt best practices in managing code and data pipelines. This is a key industry skill often missing in traditional coursework.
Data Warehousing with BigQuery: Handling large-scale data is a must in corporate settings. We cover data warehouse design and use Google BigQuery for scalable cloud analytics. Participants learn how to replicate and aggregate data in a warehouse and why data warehousing matters for business intelligence.
Data Visualization & BI Tools: Communicating data findings is half the battle. The course features Tableau Cloud and Metabase for dashboarding and visualization, teaching students to turn analyses into interactive, impactful visuals for decision-makers.
✅ 100% online & self-paced, study at your own rhythm
🎥 15+ hours of videos, walkthroughs & exercises
📦 Build your own data pipeline from PostgreSQL to BigQuery
📊 Create real dashboards in Tableau & Metabase
🎓 Receive a certificate of completion + 3.5 ECTS credits
💡 Designed for students, aspiring analysts and professionals who want to
bridge the gap between university theory and real corporate practice.
🌍 All content is in English and open to learners worldwide.
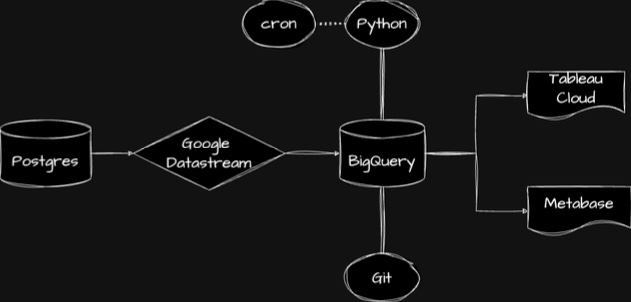
All the above skills form a hands-on capstone project that simulates a real-world business scenario. Participants are given a scenario: a company’s transactional data in PostgreSQL must be continuously replicated to BigQuery (using Google’s Datastream), then integrated and analyzed; code and configuration are managed in Git, and finally insights are delivered through Tableau and Metabase dashboards.
Each student builds this end-to-end solution, essentially experiencing the lifecycle of a data project in a modern corporate environment.
By covering this breadth of topics, the course aims to build confidence and real competence for those stepping into data roles. It’s not just theory; it’s doing the work. For example, when students configure a data pipeline from scratch in our capstone, they often have an “aha” moment – the fog of jargon and abstract concepts lifts, and they can see how things connect in practice. This comprehensive approach ensures that graduates have both the knowledge and the experience to contribute to data projects at work.
Once again, thank you for reading and for being part of the DataConscious community. It feels great to be writing to you again after the break.
I’m looking forward to sharing more insights, interviews and practical frameworks every Wednesday. If Lampros’s journey resonated with you, feel free to share this post with someone who might find it useful or drop a comment with your thoughts. Until next time – stay curious, stay conscious with your data!
Christos Chatzis shares his experience at LeadDev London (LDX3) 2025. It brought together over 2,000 engineering leaders in a festival-style event combining LeadDev, StaffPlus and LeadingEng into one multi-track experience. With 150+ sessions and speakers from companies like Salesforce, ThoughtWorks, and Softwire, the conference covered topics from AI-assisted development to building resilient teams and aligning engineering with business goals. Senior leaders also benefited from the exclusive DirectorPlus Pass for workshops and networking. LDX3 stood out as a premier gathering for engineering leadership, offering both strategic insights and strong community connections.
George Dedes describes that tech layoffs are rarely about individual performance. They’re systemic, driven by shifting markets, cost-cutting and the rise of AI. This piece emphasizes the human side of layoffs: the shock, but also the strange gift of time for reflection and recalibration. It offers practical advice, financial preparation, continuous learning, networking, and empathetic leadership while reminding us that resilience and community are what truly carry us through uncertain times.
Great engineering starts with great awareness. Be mindful, be DataConscious.
❤️ Liked this article? Make sure to push the button
💬 Community needs your voice, do you have something to add? Feel free to
🔁 Know someone that would find this helpful? Feel free to share
No posts
Comments
Nothing yet. Say the first thing.
Sign in to join the conversation.