
The Series B deck was clean. Forty-two slides. The strain had been optimised over three years by a team of six molecular biologists in a converted warehouse in the Netherlands. Titer: 45g/L. Expression system: proprietary secretion tag, patent pending. The cost curve on slide 18 showed EUR 5.20/kg by Year 3. The investors had scheduled the next call.
Then a process engineer - contracted, not full-time, brought in two weeks before the raise - ran the downstream numbers properly for the first time.
The purification train required five unit operations: centrifugation, microfiltration, ultrafiltration/diafiltration, a polishing step, and spray drying. Step recovery at each stage was estimated at 82-88%. The team had never measured it across all five steps in sequence.
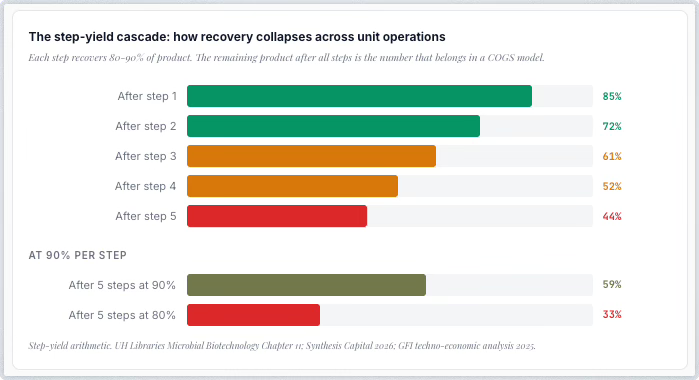
The engineer did the arithmetic. Five steps at 85% average recovery: 0.85 to the power of five. Total downstream recovery: 44%.
The 45g/L titer that had closed the Series A did not produce 45g/L of saleable product. It produced 19.8g/L. Every cost assumption in the COGS model was built on the upstream figure. The downstream reality cut it in half.
The moat in precision fermentation sits in the organism, the pathway, the expression trick that produces the target molecule.
Why it persists. Precision fermentation formed its founding narrative around molecular biology. The sector’s heroes are strain engineers, metabolic pathway designers, and synthetic biologists. Venture capital rewarded the upstream story because it was legible: higher titer, novel pathway, defensible IP.
The downstream process - centrifuges, membranes, filtration trains, drying parameters - does not make a compelling slide.
It does not produce a LinkedIn post. It does not generate a patent family that a non-technical investor can point to in a partner meeting.
The myth persists because it serves everyone in the room except the company’s gross margin.
Founders – if your COGS model shows a number built on upstream titer without a measured DSP recovery rate across multiple runs, the number is fiction. Map your cost model. Mark where upstream performance ends and downstream reality begins. The gap between those two points is where your company’s actual economics live.
Investors – the titer number on slide 4 of the pitch deck is not the number that determines unit economics; the DSP recovery rate that is missing from slide 17 is. If you have not asked for it, you have not stress-tested the cost model.
Innovators – your upstream biology is approaching commodity status faster than the sector admits; foundries, CDMOs, and open-source toolkits are compressing the gap between your strain and anyone else’s. The part of the process that cannot be replicated from a publication is the downstream train you have not yet designed.
Evidence layer 1: The quantitative reality behind the purification curtain
The numbers are not in dispute. They are in the published literature, in the techno-economic models, and in the operating data of every precision fermentation company that has attempted to move from pilot to commercial production. The sector has chosen not to foreground them.

Synthesis Capital’s 2026 analysis of precision fermentation cost structures identifies downstream processing as the dominant cost driver in most food protein production systems. The range cited across multiple TEA models and industry case studies: DSP accounts for 50-85% of total manufacturing cost, depending on the target molecule, the required purity, and the number of unit operations in the purification train. For bulk food proteins - whey equivalents, casein alternatives, egg-white replacements - the figure clusters at the higher end of that range. The upstream bioreactor, the strain, the fermentation itself, represents the smaller share of the cost structure.
GFI’s techno-economic work on fermentation-derived ingredients confirms the pattern from a different angle. Their cost driver analysis identifies three primary levers: feedstock, facility capital, and process performance. Within process performance, the single largest variable is not titer. It is recovery efficiency - the percentage of product that survives the downstream train and exits as a saleable product meeting the customer’s specification. A company operating at 45g/L titer with 85% DSP recovery and a company operating at 45g/L titer with 50% DSP recovery have the same biology. They have radically different businesses.
The step-yield arithmetic is unforgiving. A downstream train with five unit operations - a typical minimum for a secreted food protein requiring clarification, concentration, purification, polishing, and drying - at 85% recovery per step produces a total recovery of 44%. At 90% per step, total recovery rises to 59%. At 80% per step, it drops to 33%. The sensitivity is non-linear: a 5-percentage-point improvement at each step does not produce a 5-percentage-point improvement in total recovery. It compounds multiplicatively. This is the arithmetic that most COGS models either ignore or assume away with a single line labelled ‘DSP recovery: 80%’ - a number that represents no specific step, no measured performance, and no defined process.
The Lever VC scale-up cost model reinforces this from the capex side. Upstream process equipment costs approximately USD 17 million for a representative facility. Total upstream capex, after engineering and construction, reaches approximately USD 59 million. The model notes that the major capex variation between facilities comes from downstream processing requirements - the part of the plant that most founders have not yet designed when they present the cost model to investors.
Genetic Engineering & Biotechnology News summarised the sector’s structural problem precisely: in fermentation-derived ingredients, margins are set by the cost of recovery, not by the cost of production. The bioreactor is the smaller bill. The purification train is the larger one. And the purification train is the one that receives the least engineering attention, the least R&D budget, and the least time in the pitch meeting.
Evidence layer 2: Three forces that make downstream the real moat
The mechanism is structural, not circumstantial. Three forces compound to make downstream processing the source of durable competitive advantage rather than the upstream biology.
Comments
Nothing yet. Say the first thing.
Sign in to join the conversation.