
What if breaking down below a key level isn’t the start of a new trend but a buying opportunity?
What if the thing most traders are using to go short is also generating edge on the long side?
And what if the exit is just as unconventional as the entry?
This post breaks down Strategy #20, a daily system that flips the Donchian Channel to the reversed and creates a mean-reversion signal out of a commonly used trend-following tool.
Markets don’t trend forever. Especially in liquid indices like the SP500 or NQ100, sharp moves below recent lows tend to attract dip buyers, institutions, systematic funds and mean-reversion algos.
The Donchian Channel is usually a trend-following tool. When price breaks the band, most traders see a continuation signal. But in markets with strong mean-reverting tendencies, that breakdown is often near the bottom rather than the beginning of a new downtrend.
The hypothesis: when price closes below the recent lowest low, it’s stretched. Buyers will step in. The recovery may be quick so our job is to catch it and exit fast.
This is a long-only mean reversion system designed for the S&P500 & Nasdaq100 on the daily timeframe. It uses a Donchian Channel to identify when price has punched below recent lows and then buys the market.
The position sizing is dynamic, using ATR to scale contracts relative to portfolio equity so risk stays consistent regardless of volatility regime. The exit logic comes in four variants, each with a different balance between trade frequency, holding period and returns/drawdown.
All these four exit variants have their own strengths, some are better used for CFDs with shorter holding periods and some are better suited for Futures swing strategies with multiple days as holding periods, feel free to try these exits in any of your other trading systems, you might find something interesting.
Market: S&P 500
Instrument: Futures
Platform: ProRealTime
Timeframe: Daily
Backtest period: Jan 2000 - June 2026
Fees / commissions: 1p spread included
Starting capital: $20.000
Four exits were tested against the same entry logic. Here’s how they look like:
Exit 1: Details about this exit is found in the code below
MAR: 0.330
Avg holding period: 3 Days 12h
Decent average holding period. Good performance.
Exit 2: Details about this exit is found in the code below
MAR: 0.175
Avg holding period: 22h
Most trades. Shortest holding period which is best for CFD traders.
Exit 3: Details about this exit is found in the code below
MAR: 0.185
Avg holding period: 1 Day 9h
Decent overall balance of drawdown and holding time.
Exit 4: Details about this exit is found in the code below
MAR: 0.161
Avg holding period: 5 Days 6h
Most total profit but a longer hold and deeper drawdown.
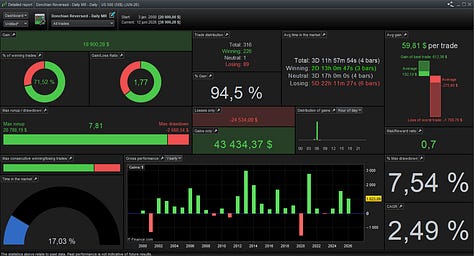
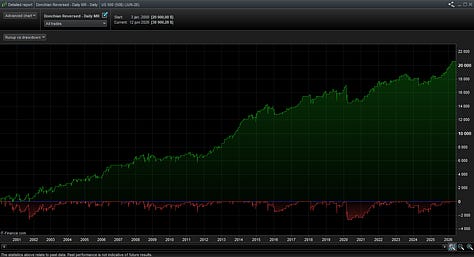
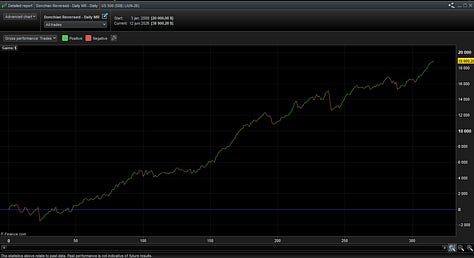
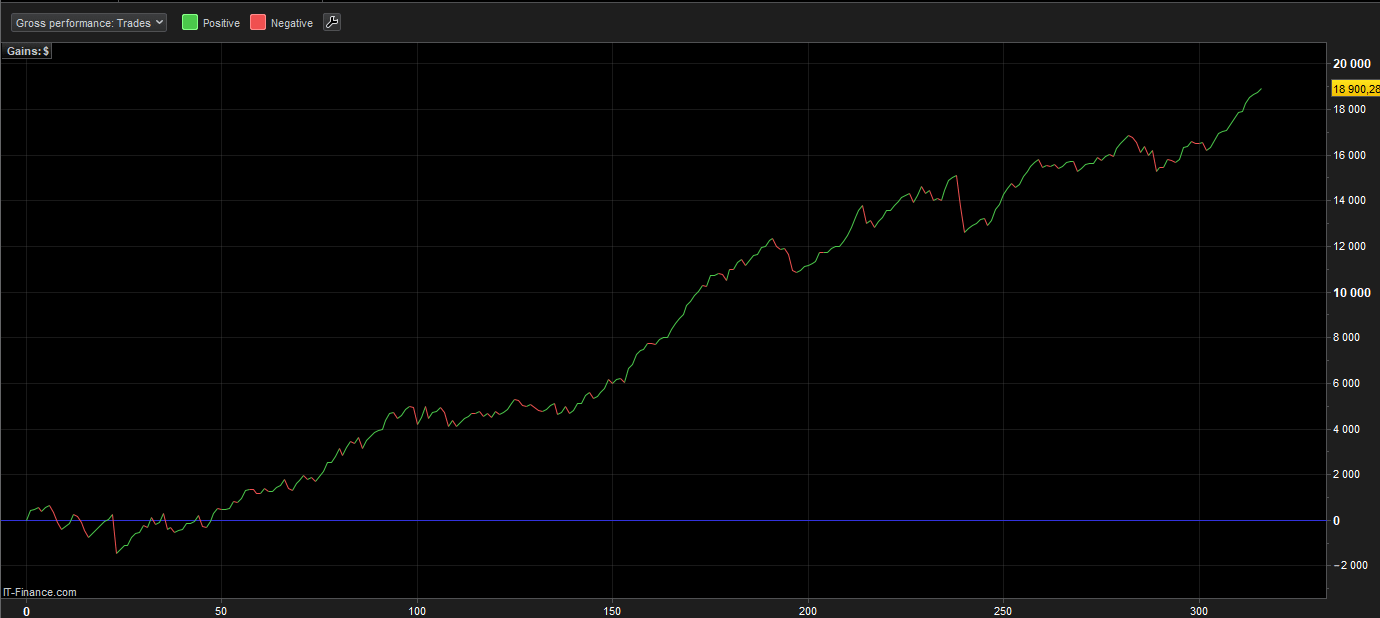
Total gain: $18.900
Average gain per trade: $59.81
Total trades: 316
Winners / Losers: 226/90
Max drawdown: -7.54%
Risk / reward: 0.7
Time in market: 17%
Average trade duration: 3 Days 12h
CAGR: +2.49%
MAR ratio: 0.330
Spread: 1p
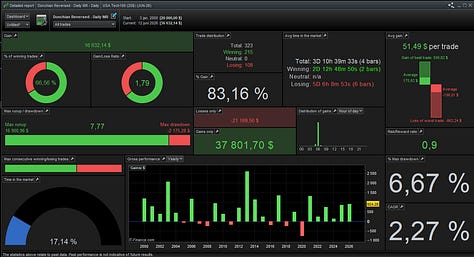

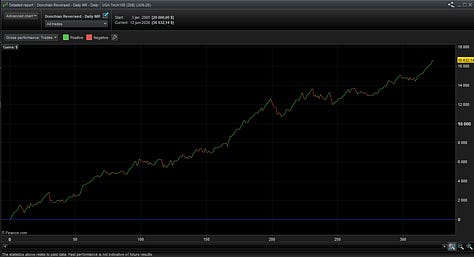
Total gain: $16.632
Average gain per trade: $51.49
Total trades: 323
Winners / Losers: 220/103
Max drawdown: -6.67%
Risk / reward: 0.90
Time in market: 17%
Average trade duration: 3 Days 10h
CAGR: +2.27%
MAR ratio: 0.340
Spread: 3p
Exactly the same code but on another index (Nasdaq100), very similar results which support the robustness of this strategy. But if I would use this system in a portfolio and use it on both of these instruments I would try to use different exits, I will therefore also show you how Exit 4 looks like on Nasdaq100 Futures.
Diversification has multiple layers and trading different instruments is one of them, using different criterias and parameters adds another layer of diversification which can help us spread out the returns and more importantly the drawdowns. Here is the backtest with Exit 4:
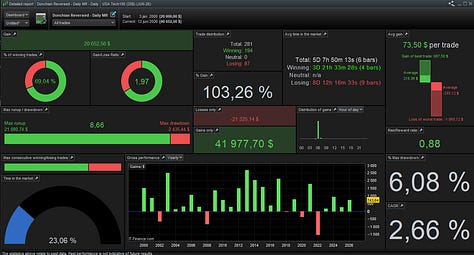
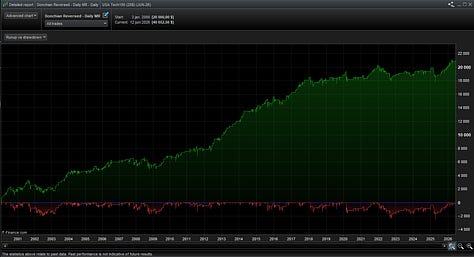
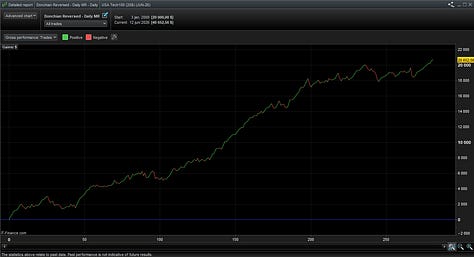
Total gain: $20.652
Average gain per trade: $73.50
Total trades: 281
Winners / Losers: 194/187
Max drawdown: -6.08%
Risk / reward: 0.88
Time in market: 23%
Average trade duration: 5 Days 7h
CAGR: +2.66%
MAR ratio: 0.437
Spread: 3p
Below you’ll find the complete ProRealTime code including all four exit variants described in plain english and clearly separated so you can test them yourself and add them to your existing systems.
Comments
Nothing yet. Say the first thing.
Sign in to join the conversation.