
Hey Friend!
June handed Bitcoin everything it was supposed to want. A peace deal. An oil crash. A pro-Bitcoin Fed chair. The Clarity Act eventually around the corner. Bitcoin fell roughly 20% anyway, to eight-month lows.
Before I explain why, let me own last month first. In early June I called sub-$60k one of the best accumulation windows in a while. The long-term logic hasn’t moved, but the current weakness points to lower prices. What I underweighted wasn’t macro. It was a credit cycle running inside Bitcoin itself, and it’s still unwinding.
That’s the whole edition in one line: The macro backdrop seems still good, and the price has never been worse relative to it. Something internal is overriding everything external. Let’s take it apart and get into the broader picture and how to set up for the coming months:
️ ⚡ On today's Episode:
📈 Market Update – Bitcoin dropped roughly 20% to eight-month lows despite a peace deal, collapsing oil prices, improving regulation, and a supportive macro backdrop. The real pressure is internal: Strategy’s treasury flywheel has reversed, ETF outflows hit a record $4.29B in June, and crypto’s credit cycle continues to contract while speculative capital rotates into AI, biotech, semiconductors, and space equities.
🐂 Alpha Insights – Bitcoin is entering long-term accumulation territory, but the unwind may need another three to four months. The tactical plan: watch the $44K–$45K, $37K–$38K, and $28K–$30K spot-buy zones, while using STRC above $95, slowing ETF outflows, and sustained basis above 8% as confirmation that the cycle bottom is forming.

The risk trade is alive but it moved
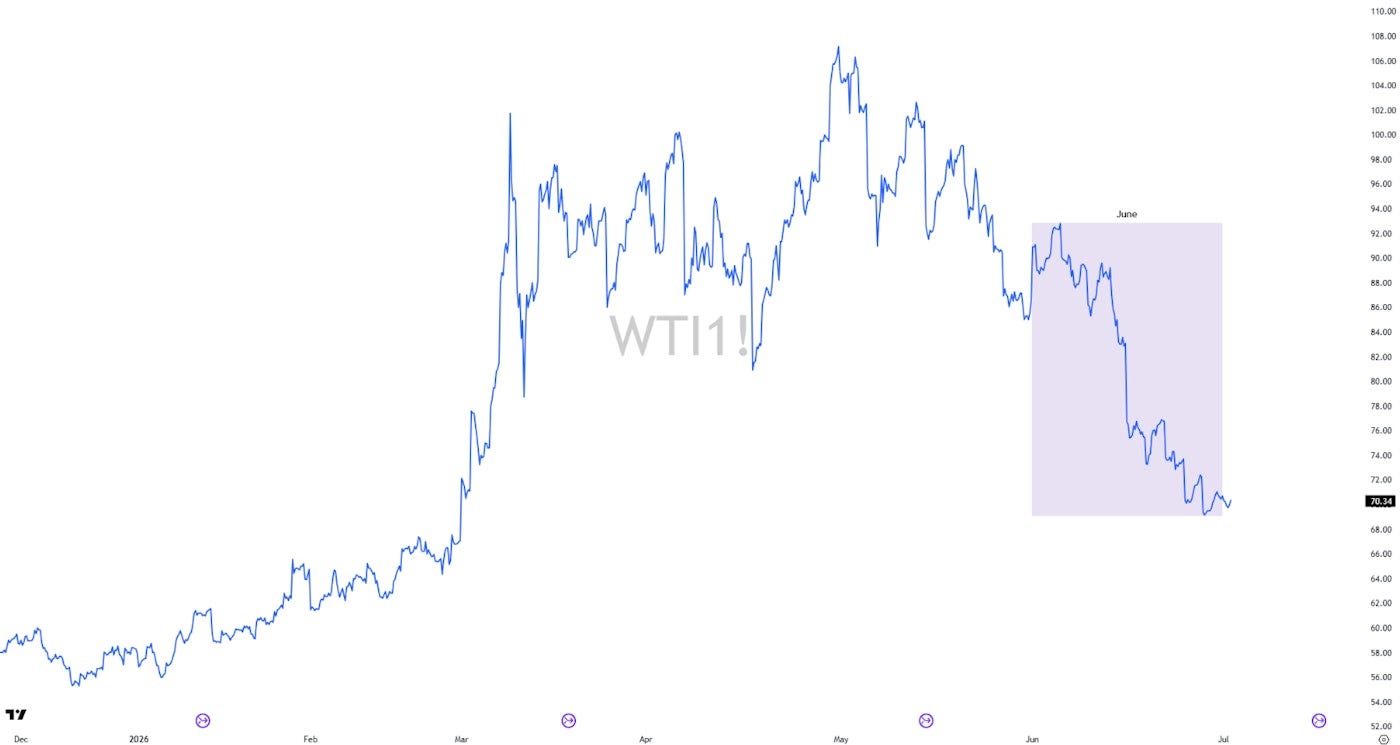
Oil dropped 22% in June, from ~$90 to ~$70 which is the biggest monthly fall since the war began. The US-Iran peace deal signed June 19 pulled the geopolitical premium out of crude almost overnight. WTI sat at $55-60 before the war started, so we’re now only $10-15 above pre-war levels. The energy trade that ran the first half of 2026 is unwinding fast, and that’s a tailwind for risk assets.
The June sector table looks defensive at first glance. Healthcare +6.92%, Financials +4.74%, Industrials +3.81% on top. Communication Services -8.74%, Basic Materials -7.78%, Energy -6.40% on the bottom, with Technology negative at -2.24%.
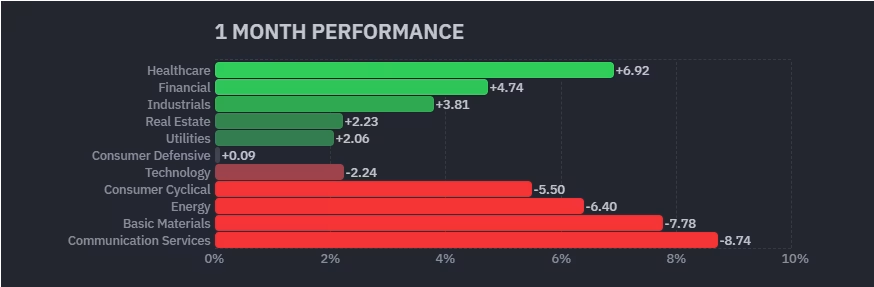
Healthcare is structurally defensive, financials are earning wider margins with the 30-year at 5% and the Fed on hold. Read that way, risk appetite is contracting which leads to the the worst environment for a zero-yield, narrative-driven asset like Bitcoin.
Go one layer down and the story changes. SpaceX IPO’d June 12, spiked 55% to ~$225 in days, then round-tripped the whole move. It traded like a low-float, high-FDV coin, because structurally it kind of is one.
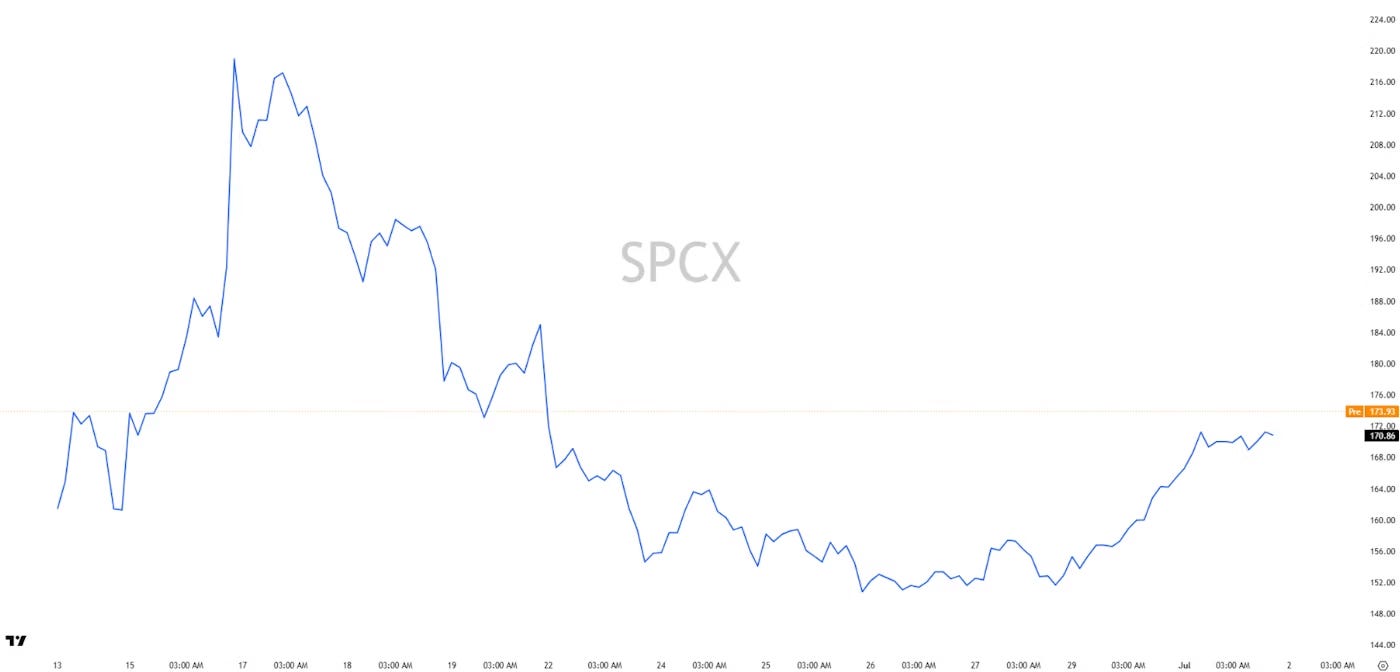
The speculative appetite we’ve been waiting to return to crypto is back. It just went to equities instead: Some into biotech small-caps for the moonshots, a lot into SpaceX for the narrative chasers and semiconductors for the AI believers.
The framework: The pool and the waves
Two forces move markets, and you need both to understand why equities sit at all-time highs while Bitcoin sits at eight-month lows.
Macro liquidity is the water level in the pool — Fed reserves, money supply, the Treasury General Account. When the Fed prints or the Treasury draws down, the level rises.
Credit is what banks and institutions do with that water: mortgages, corporate debt, leveraged buyouts. Credit turns the water into waves.
Markets rally hardest when both rise together. That was 2021: the Fed printing while banks lent aggressively and crypto-native lenders (Luna, Celsius, BlockFi) pumped leveraged capital into BTC and alts.
Right now the pool is full and the equity credit cycle is expanding: banks lending, corporates issuing, AI capex driving a credit-fuelled boom. That’s the equity ATHs explained. Bitcoin’s own credit cycle is contracting. The problem isn’t macro. Macro’s fine. The problem is the leverage built on top of Bitcoin through corporate treasury structures, and it’s now running in reverse as Saylor, the only buyer, can not raise more cash to buy BTC.
The DAT unwind: Strategy’s flywheel spins backwards
The mNAV premium was Bitcoin’s internal credit machine. When digital asset treasury stocks traded above the value of their Bitcoin (mNAV above 1), they could sell $1 of stock and buy more than $1 of BTC creating buying power out of thin air. That premium was leverage. During the expansion, 199 public companies used it to accumulate 1.264 million BTC.
The premium is gone. Strategy now trades at just 0.71x the value of its Bitcoin. Below 1, the machine runs backwards: selling stock to buy Bitcoin destroys value for shareholders, so the buying stops. But the bills from the boom years — dividends and debt — still have to be paid. The market's biggest Bitcoin buyers have turned into potential sellers.
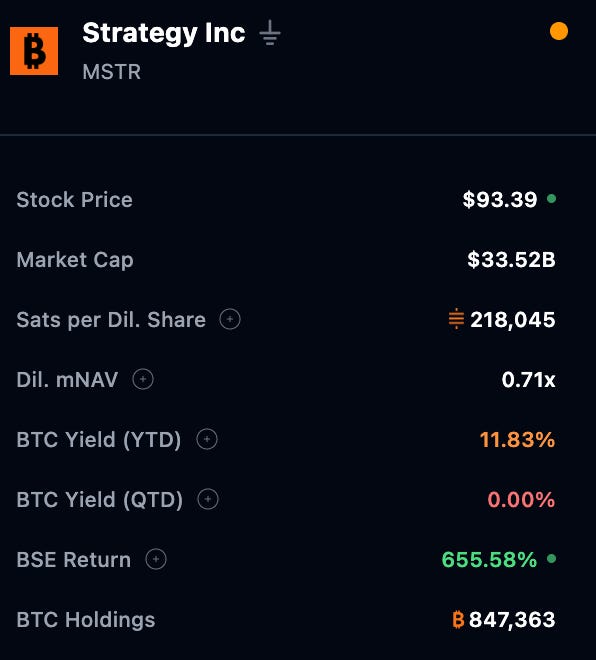
June showed the stress:
Strategy added only ~3,657 BTC.
Its average buy price is $75,651. At ~$59,200, that’s $13.9 billion in paper losses, more than double March’s $6B.
MSTR fell to $86, down 82% from its July 2025 peak of $455.
STRC — the fixed-dividend share Strategy issued to raise cash, think of it as a bond-like IOU — hit a record low of $71.25, 29% below its $100 face value. At that price it technically yields over 16%, but nobody’s buying it for the yield. The market is pricing the risk that the dividend gets cut or suspended.
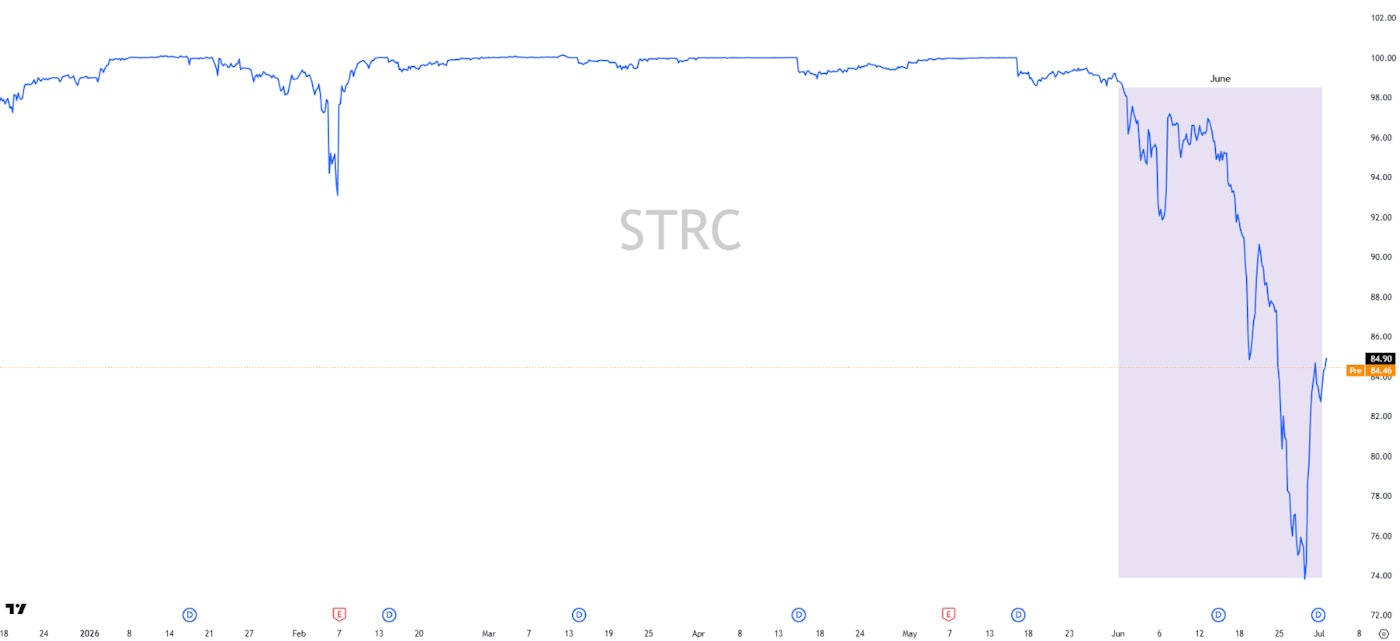
That last point matters most. When holders of an instrument like STRC get nervous, many are forced to sell no matter what they think of Bitcoin. Their selling pressures MSTR, which weakens confidence in STRC further, which forces more selling. A loop that feeds on itself, and it has nothing to do with Bitcoin's fundamentals.
Saylor's answer, announced June 29: a defensive package. A rebuilt $2.55B cash reserve (~17 months of dividend coverage), the STRC dividend raised to 12%, $1B to buy back STRC at its discount, $1B to buy back MSTR stock, and — the big one — permission to sell up to $1.25B of Bitcoin, about 2.5% of the stack.
My read: This could be the smartest thing Saylor’s done in some time. Buying back STRC at 71-75 cents on the dollar retires his obligations cheaply. But notice the shift. The plan is built to survive the bear market, not to buy through it.
The $1.25B sale permission is what matters for us. Even if he never uses it fully, the market will front-run it. When Strategy sold just 32 BTC ($2.5M) earlier, both MSTR and BTC dropped. The signal outweighs the size.
So: is this the bottom of the unwind, or the middle? If STRC climbs back above $90, the worst is over and Strategy resumes as a buyer. If the cash reserve drains away paying dividends, the bleed accelerates. To understand the BTC chart right now, watch STRC.
Market Pulse and Flows
The ETF exit is mechanical now
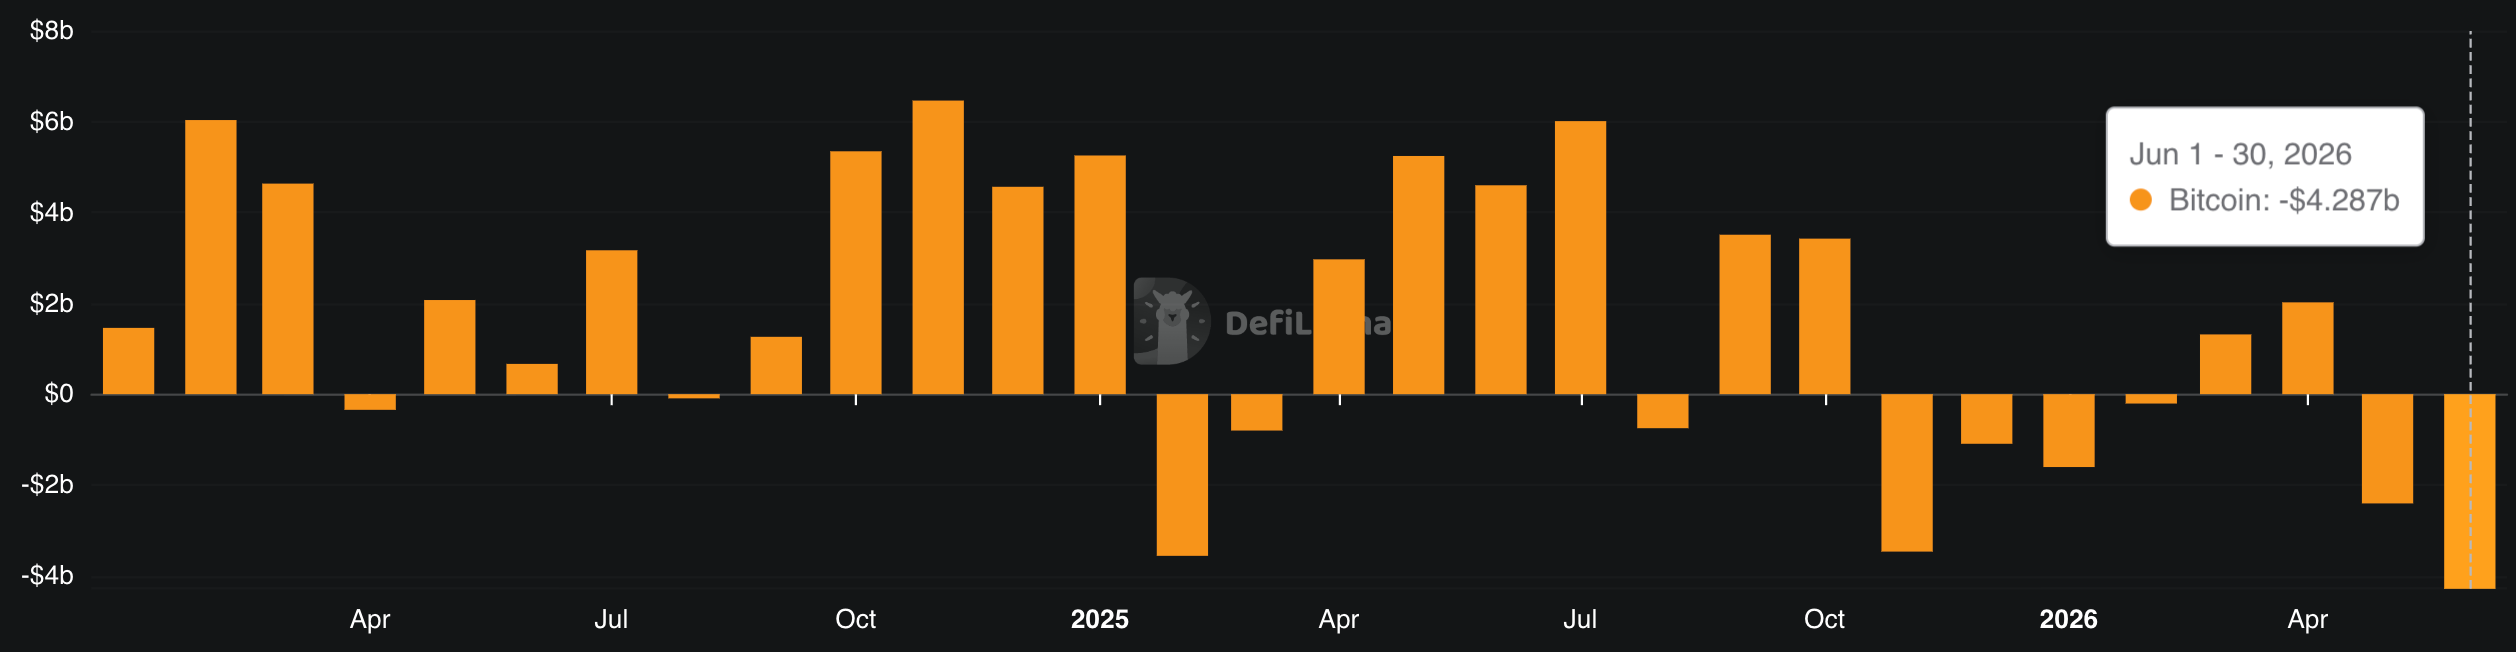
June was the worst month for Bitcoin ETFs since launch: $4.29 billion out. Add May’s $2.41B and you get $6.7 billion, the largest sustained institutional (and retail) exit in ETF history. In coin terms, ETFs dumped 71,600 BTC in June while DATs added just 7,500. The ETF ecosystem is now the marginal price setter — more influential than retail, on-chain, or corporate treasuries.
One nuance keeps me from panicking. The average IBIT investor is ~40% underwater, yet only 6.6% of total AUM has redeemed. 93.4% are sitting through the pain. At -40%, the discretionary sellers are mostly gone. What’s left is mechanical: risk committees with drawdown mandates, rebalancing triggers. That’s why the selling has been so orderly.
After months of tracking these flows, I haven’t found an S-tier leading indicator. The most reliable analysis could be to check daily redemptions shrinking from $400M to $200M to $50M while BTC holds $58-60k instead of breaking lower. That would mean the forced sellers are nearly done.
Where this leaves the asset
Bitcoin’s risk:reward has changed. At a multi-trillion valuation, integrated into TradFi custody, with price set by ETFs and one leveraged corporate buyer, it doesn’t offer 2021’s returns — back when retail dominated, the Fed was printing, and capital had nowhere else to go. Today capital flows to the new frontiers: AI, semiconductors, biotech, robotics, space.
That doesn’t mean it can’t reclaim all-time highs. I think it does, or I wouldn’t still be here. But it’s hard to argue it deserves its 2021 allocation while every other market prints outsized returns and Bitcoin’s internal credit structure is actively unwinding.
Despite the risks above, my view is that most of the air is already out of BTC and the crypto markets. Based on how Bitcoin has historically traded, and the big-picture outlook, the risk/reward is tilted in our favor on a 1-3+ year horizon for investors who can stomach volatility. One example: supply in profit — the share of all coins currently worth more than their owners paid for them — just hit 48%. Here’s what forward returns looked like the last three times BTC reached that level:
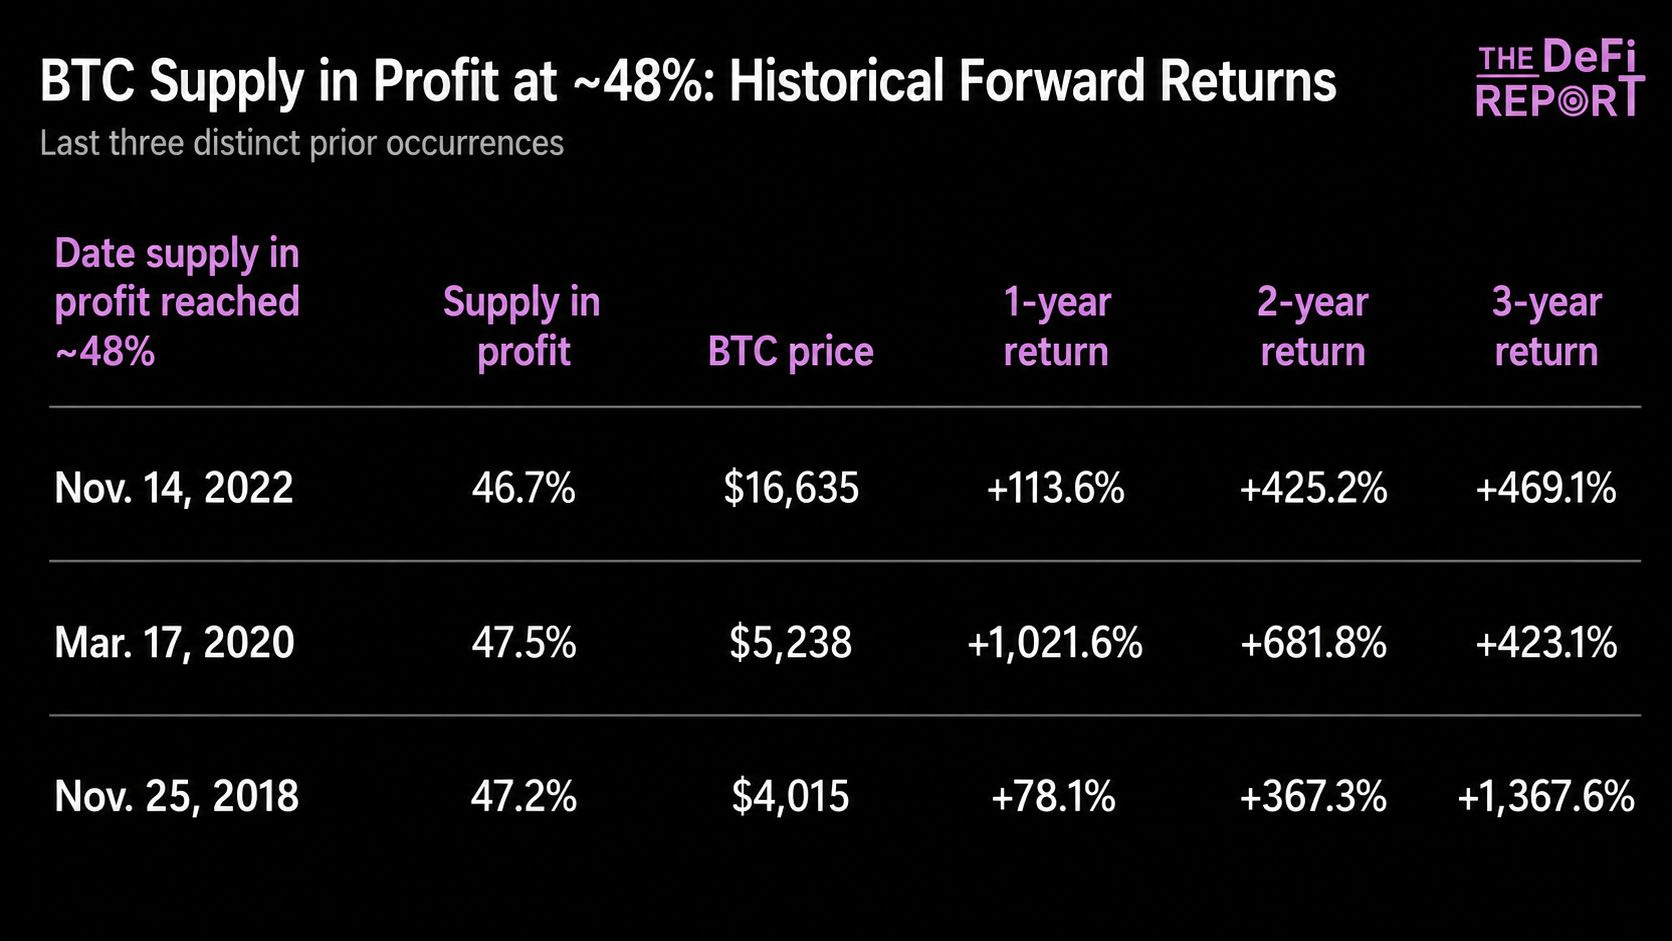
That’s why I think it’s a good time to accumulate. At the same time, the probabilities still point to another 3-4 months before we get clearer confirmation of the cycle lows. Both can be true: good long-term prices, no reason to rush.
What I’m Watching
A caveat first, earned the hard way last update: these are directional guides from flows, credit structure, and positioning. Fundamentals tell you what should happen, not where. Take the specific numbers loosely.
I expect BTC to trade roughly $49k-$64k through July. STRC has recovered to $87 but still sits 13% below par, the sale authorization is largely unexecuted, ETF selling hasn’t shown exhaustion, and the derivatives numbers say nobody’s positioning for upside. Bias: bearish short-term, unchanged long-term.
Thanks for reading Adrian DeFi! Subscribe for free to always receive the best DeFi investment opportunities.

Good opportunities I discovered.
Alpha 1: Planning the long-term Bitcoin spot buy
Everything above points the same way: too early to buy aggressively, too late to be scared. So here’s how I’m planning the spot position — the timing, the levels, and what would confirm a bottom.
The timing. Bitcoin topped in late 2025 and has now spent 267 days in a bear market, down about 50% from the highs. Bitcoin ran so far on a four-year rhythm: top-to-top or bottom-to-bottom, the average cycle is roughly 1,430 days. Project that forward and it points to a bottom around October/November 2026 — another 3-4 months, which lines up with the credit-unwind timeline above.
One caveat: a pattern this famous is also this crowded. The more traders anchor to it, the easier they are to punish. But it’s the only historical rhythm we have, so treat it as a guide, not a guarantee.
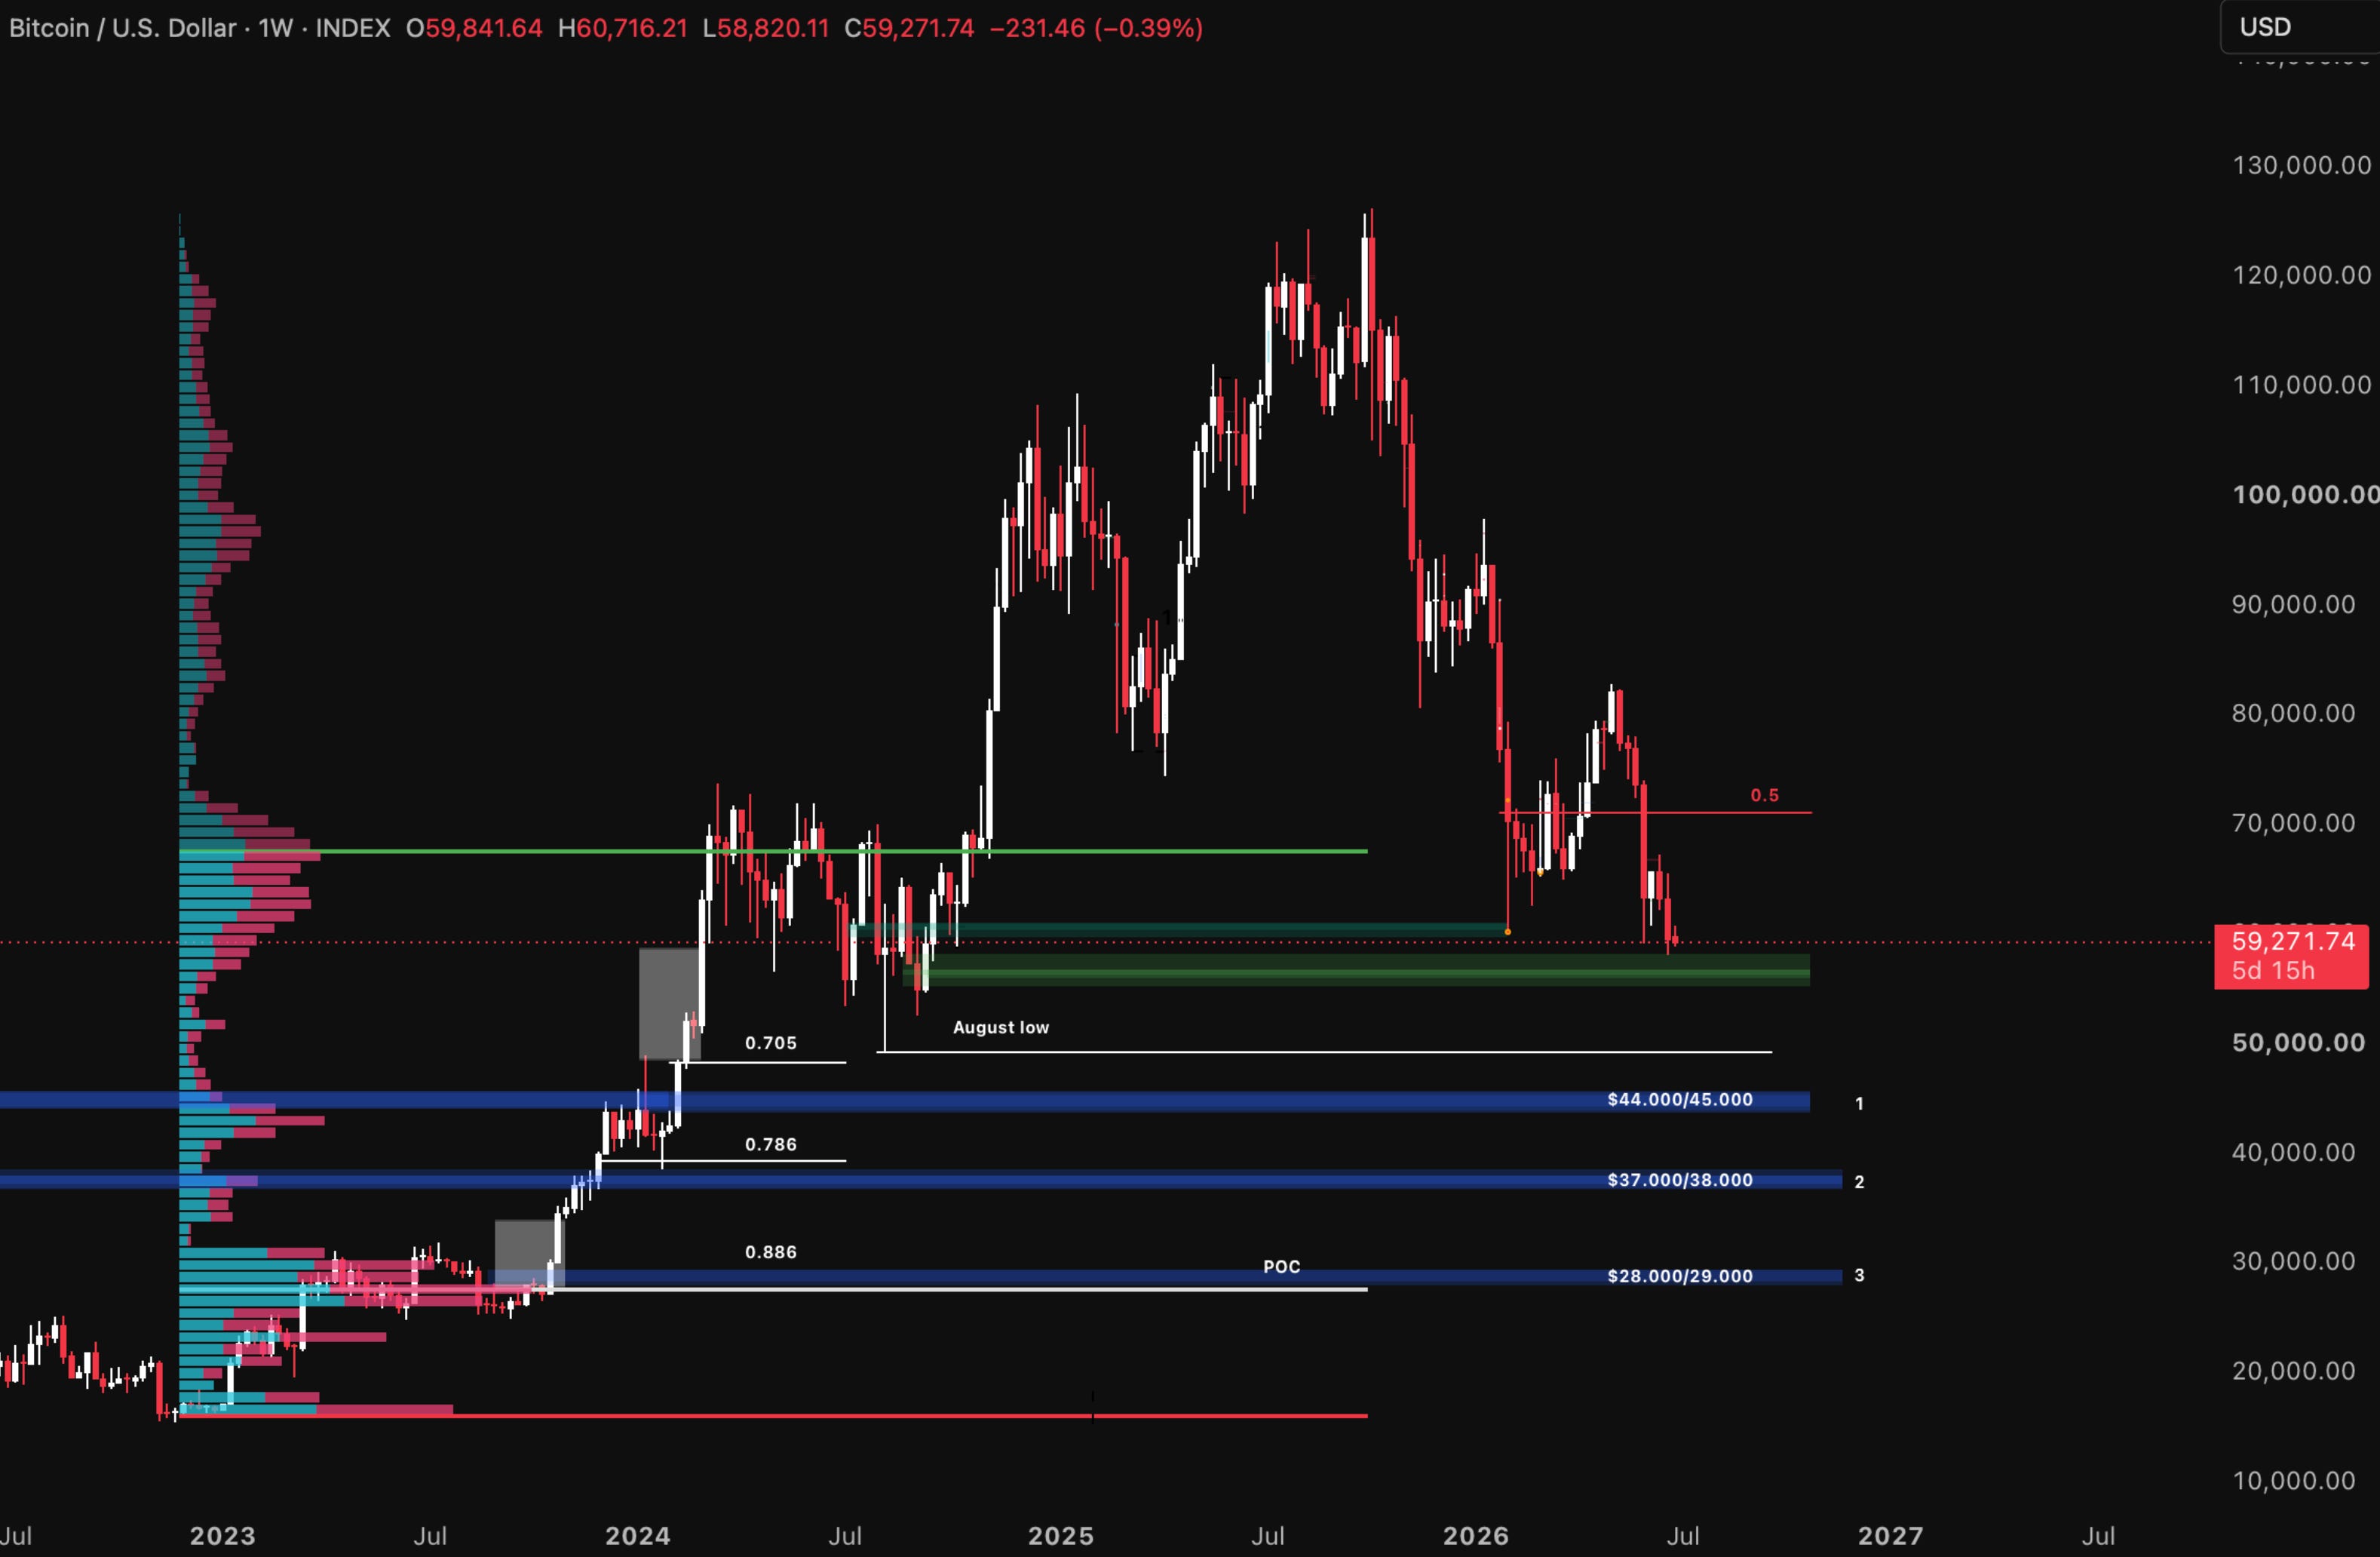
The levels. Price already trades below the midpoint of the last cycle’s range (the fair-value zone between the previous bottom and top), so we’re in discount territory. But the trend is still down and there’s no sign of accumulation yet, so I’m watching three zones for spot buys:
$44,000-45,000
$37,000-38,000
$28,000-30,000 — where more Bitcoin has changed hands than anywhere else in its history, and the most interesting of the three
My base case: the August 2024 low gets swept first (price dips below it to trigger stops before reversing), bringing the $44-45k zone into play. That’s where Bitcoin gets very appealing for DCA — buying in fixed portions on a schedule rather than all at once. That’s my plan.
The confirmation. A bottom isn’t a price level, it’s a process. What confirms it is accumulation: weeks of sideways price action where sellers exhaust and larger buyers absorb supply. That can start at $44-45k or lower — nobody knows which level reacts. On social media we see a lot of calls for $38k which makes this actually less likely. So monitor the formation step by step, open mind, no fixed target.
The exit. Planned the same way: scaling out percentages at key levels on the way up.
What I’m Watching
A caveat first, earned the hard way last update: these are directional guides from flows and credit structure. Fundamentals tell you what should happen, not where. Take the specific numbers loosely.
Through July, I expect BTC to trade roughly $53k-$63k. The unwind isn’t done. STRC has recovered to $84 but still sits 16% below par, the $1.25B sale authorization is mostly unexecuted, ETF selling hasn’t shown exhaustion, and there’s no positioning in the basis. Bias: bearish short-term, unchanged long-term.
Three signals flip my view:
STRC above $95 for more than a week (the credit stress is over)
ETF outflows decelerating while price holds (the forced sellers are done)
Basis above 8%, sustained (forward-looking capital is back)
Two of three, I turn neutral. All three, bullish. Today: zero.
And that’s fine. The buy zones above don’t need a bottom call to work. They need the discipline to wait for one.
Closing Thought
Every metric deteriorated in June while every headline improved. The market is telling you which force is in charge, and it isn’t macro. Until the gauges turn, patience is the position: know your levels, watch the three signals, and let the unwind come to you.
None of this requires predicting the bottom. It requires a framework you trust enough to sit on your hands until the market confirms. That’s the hard part, and it’s the part most serious money gets wrong.
If you have meaningful capital allocated to crypto — or you are planning to — and want that framework in place before your next decision, reply with INTENSIVE and I’ll send the booking link. 90 minutes, 1:1, €500. Built for serious investors.
That’s it for today’s episode, thank you for being here!
Till next time, stay safe!
Comments
Nothing yet. Say the first thing.
Sign in to join the conversation.