
Hey Friend!
We’re walking into the most relaxing and most valuable phase of a crypto cycle.
That roughly three-month window of time capitulation, where nothing seems to happen on the surface but underneath coins are carving out inter-cycle lows and running out of sellers.
Think of it like this. Someone hands you the keys to a shop full of antiques and says: browse for a few months, come and go as you please, no rush. I’ll give you 80% off anything in here.
That’s what the cycle low offers. When tokens run out of sellers, regardless of the macro events or the stock-market correlation of the week, you get a high-confidence floor. A year out, the downside is minimal, with only a sub-1% chance the whole space disappears.
The only reason more people aren’t in here loading up is that it takes patience and guts most don’t have.
Let’s get into the broader picture and how to set up for the coming week:
📈 Market Update – Cooler inflation and a surprise liquidity injection are giving risk assets room to breathe, while capital rotates on-chain into tokenized real-world assets.
🔊 Project Updates – Ether fi fundamentals are improving, and Robinhood's new chain put up numbers most L2s never see. What's real, and what's just subsidized.
🐂 Alpha Insights – Bitcoin is pressing against the exact zone that separates another failed bounce from a real structure change.

The current state of the market.
The macro backdrop turned friendlier this month, and Bitcoin is feeling it.
US inflation came in well below expectations. Core inflation, the measure that strips out volatile food and energy prices, dropped to 2.6% against an expected 2.8%. Headline inflation surprised too, at 3.5% versus 3.8% expected. Producer prices, what businesses pay before those costs reach consumers, also landed under forecast.
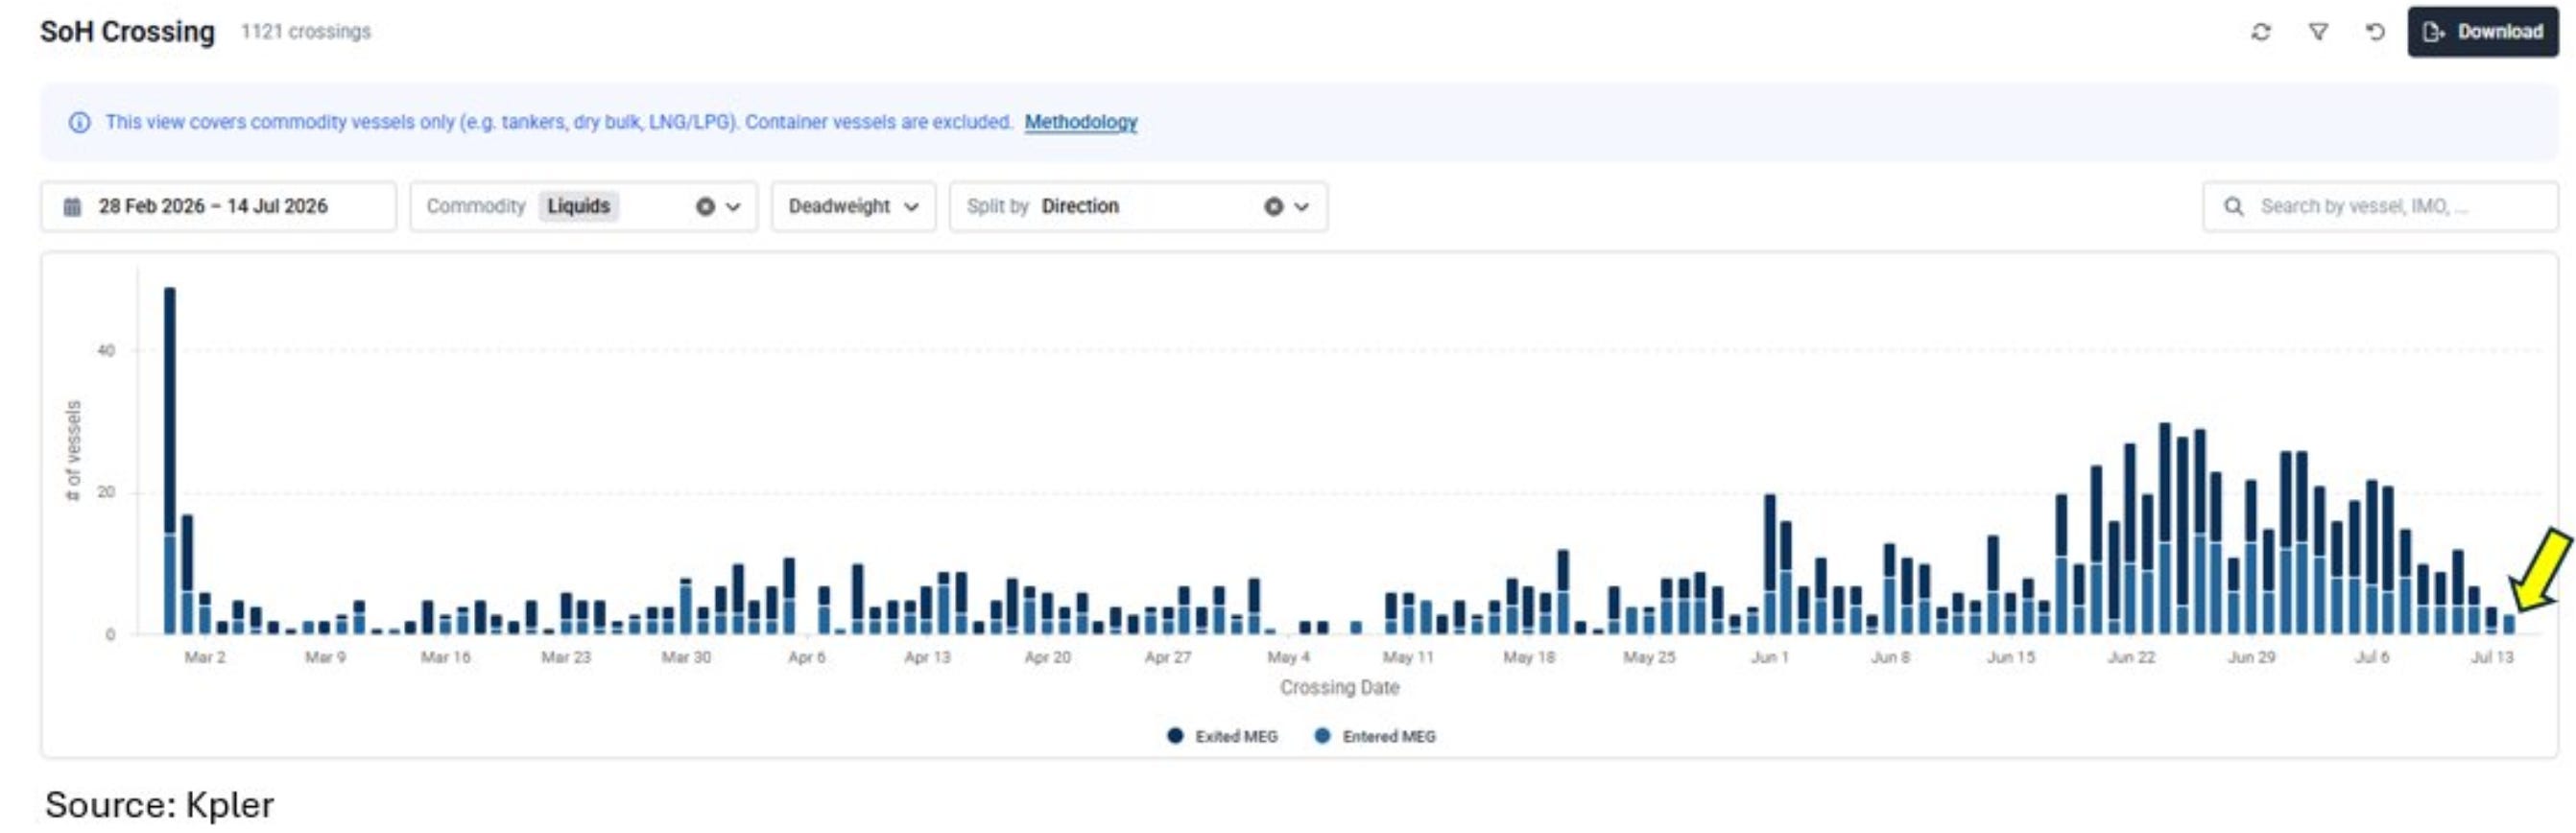
A big driver was a sharp fall in energy prices in June, and that help looks temporary. Oil has already climbed back above $80, recovering roughly 20% off its recent low. The renewed oil move is the main threat to an otherwise supportive setup and the Strait of Hormuz crossings are again tending to 0.
The low level of US strategic oil reserves could also put additional pressure on prices in the medium term. If the reserves need to be replenished, this will create further demand in an energy market that is already under strain.
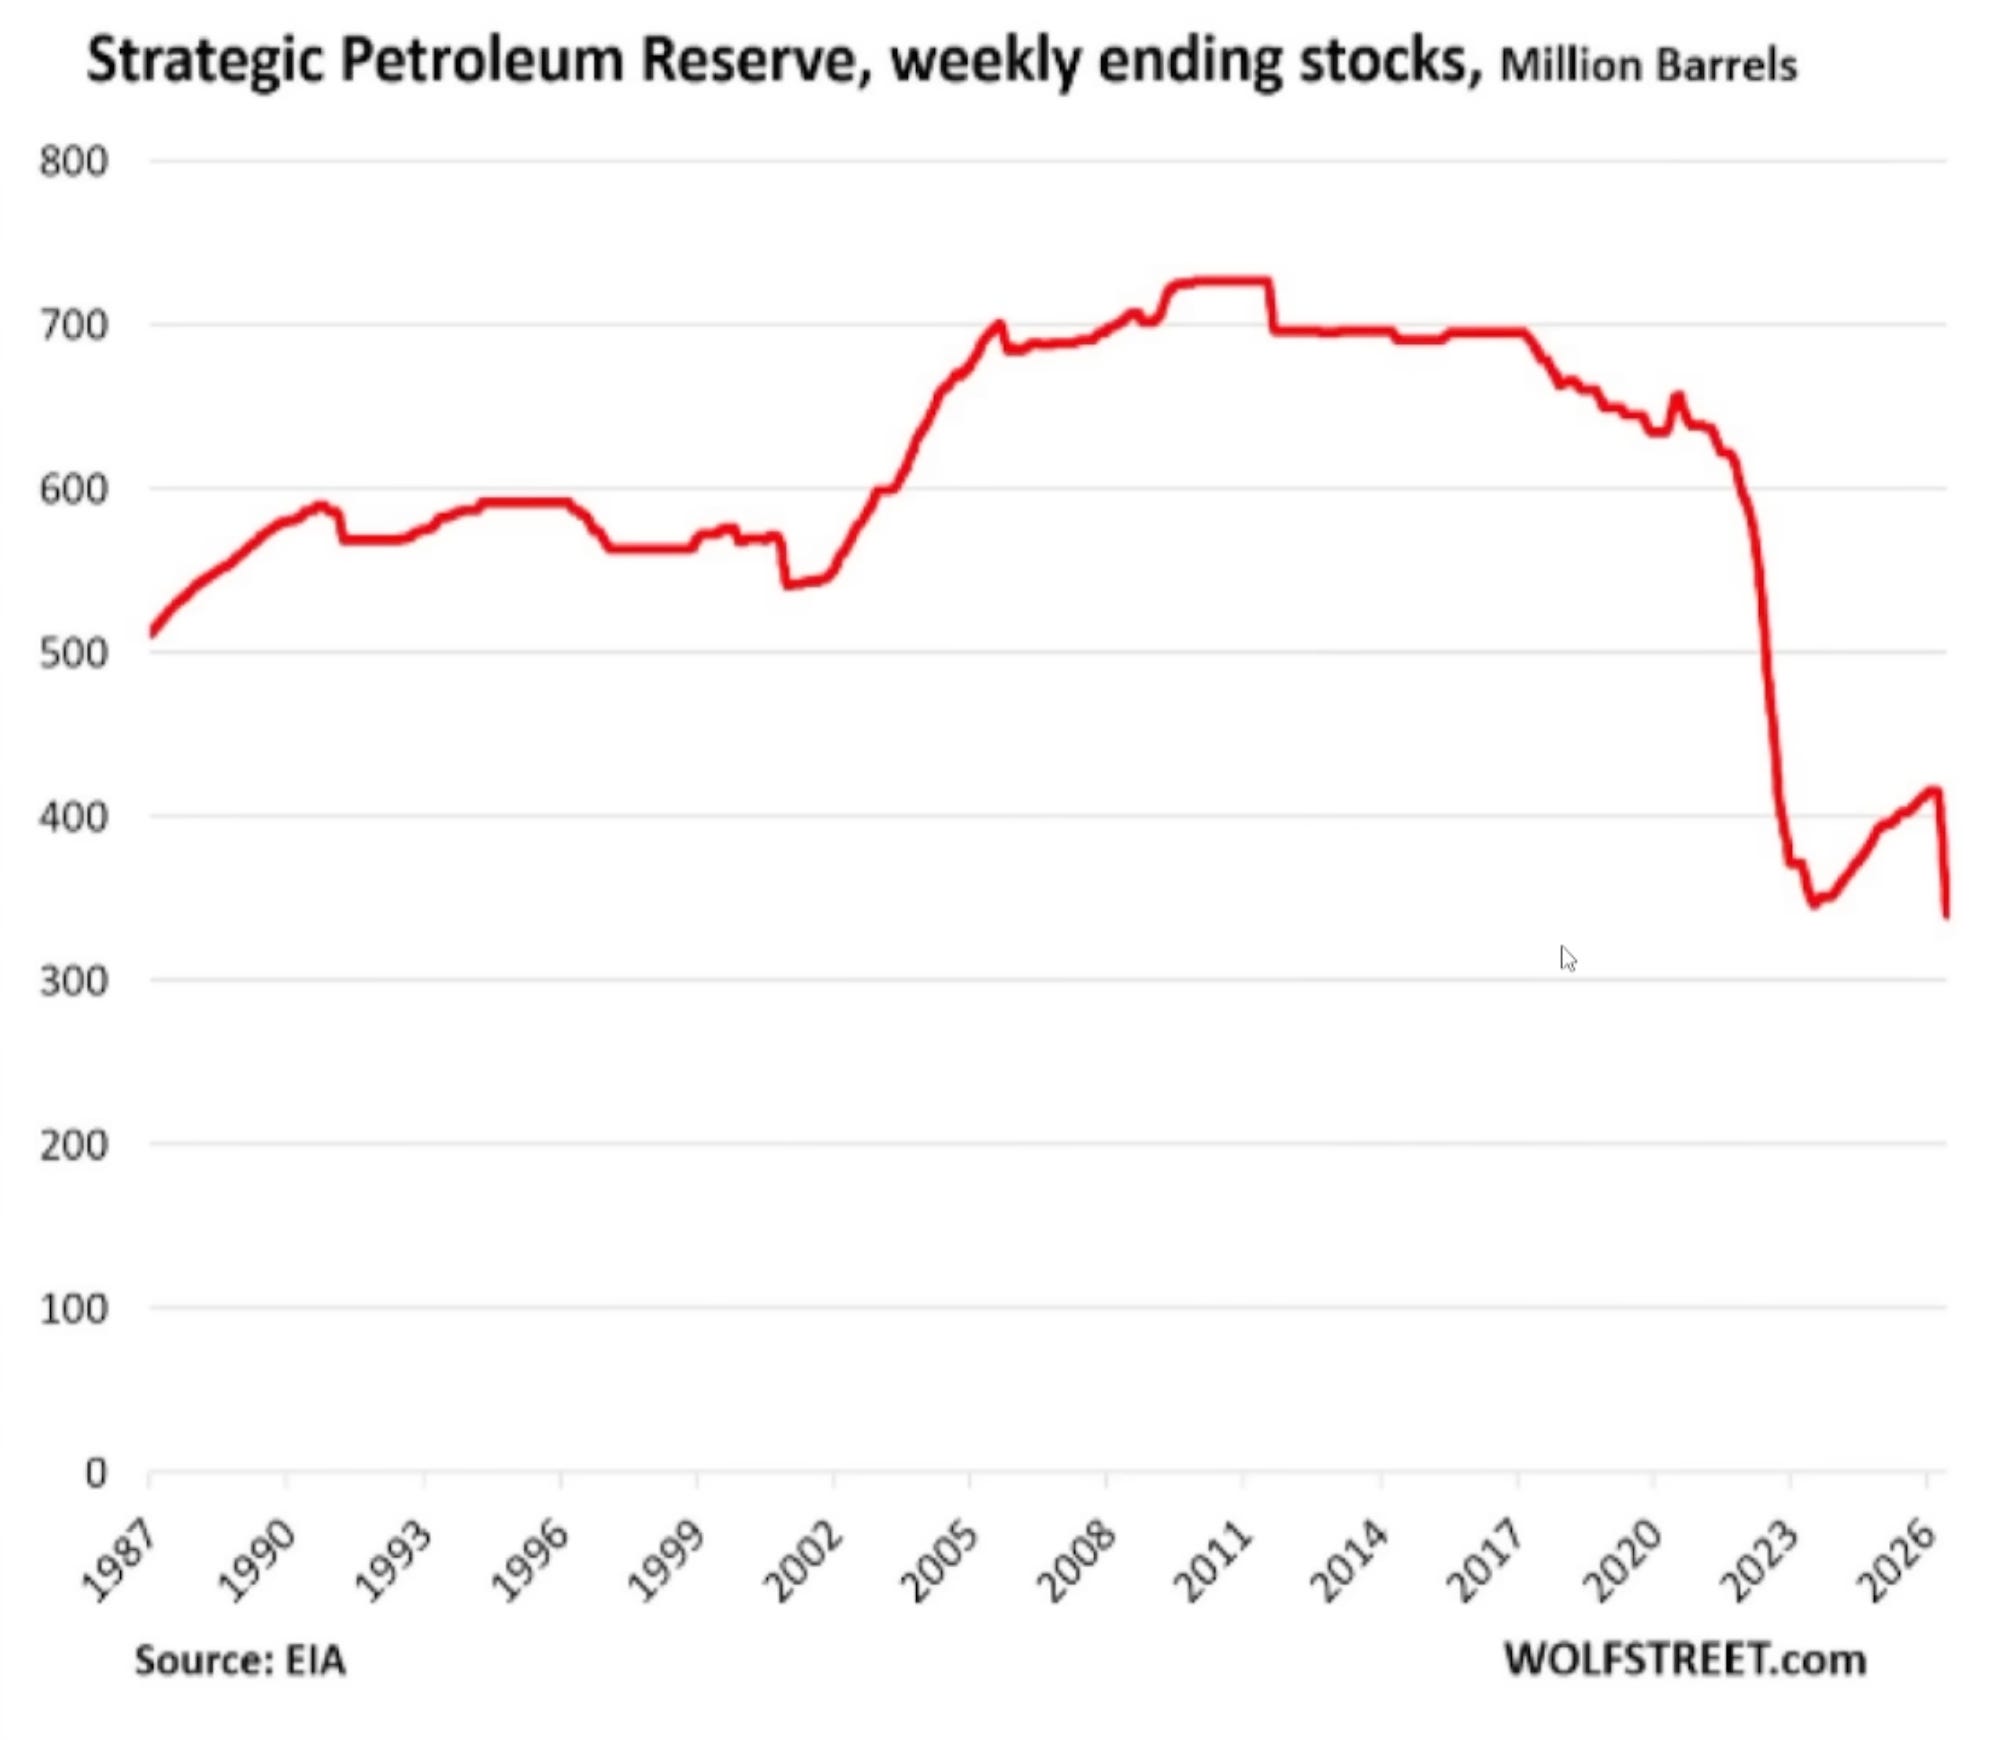
→ The energy relief that helped June’s print is already reversing. That’s the single variable most likely to complicate the setup over the next few weeks.
At the same time, the US economy got an unexpected liquidity injection. After a court ruling, previously collected tariffs are being partly refunded to companies, a net ~$26 billion in June alone. Short term, that acts like an accidental stimulus. What matters now is whether companies invest it, push it into markets, or sit on it.
Regulation is moving the right way too, with Japan proposing to treat crypto like stocks and bonds (a path toward spot ETFs) while the US Clarity Act heads for a possible re-vote around July 20.
Here’s what’s important to track underneath the macro: the money that’s actually moving is going on-chain.
Ethereum is outperforming Bitcoin again, and the clearest reason is where real-world assets are landing. Tokenized real-world assets, or RWAs, are traditional instruments like treasury bills, stocks, and credit represented as tokens on a blockchain. Both the market cap and transaction count for RWAs are climbing.
Solana is steadily winning a slice of the whole RWA pie: 271,500 unique addresses now hold tokenized stocks and ETFs there, roughly 48.1% of all tokenized-stock holders in the market.
Forget which chain wins the tokenization race for a second. Real-world assets have started showing up as measurable onchain throughput. That sets up everything below.

That covers the broader market. Now let’s move to the opportunities I discovered.
The strongest signal in the project layer this week is a business, not a token: ether.fi.
ether.fi was a liquid restaking protocol. Restaking lets you take already-staked ETH and reuse it to help secure other networks, earning a second layer of yield. A liquid restaking token, or LRT, is the tradeable receipt you hold while that ETH stays productive. That’s the boring part the market knows and prices in.
What it’s underpricing is the card business.
New card issuance
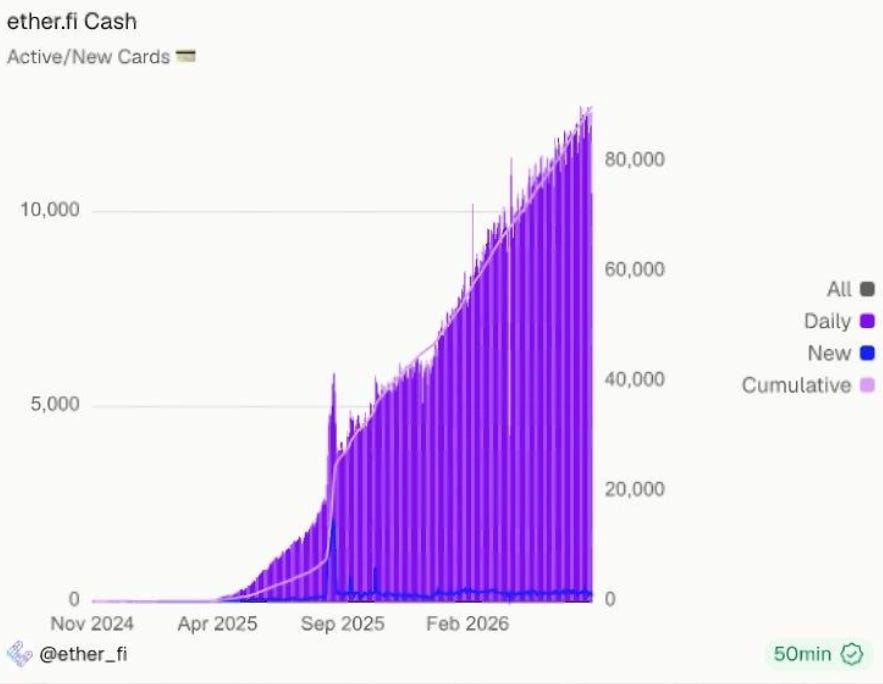
and spending volume are up
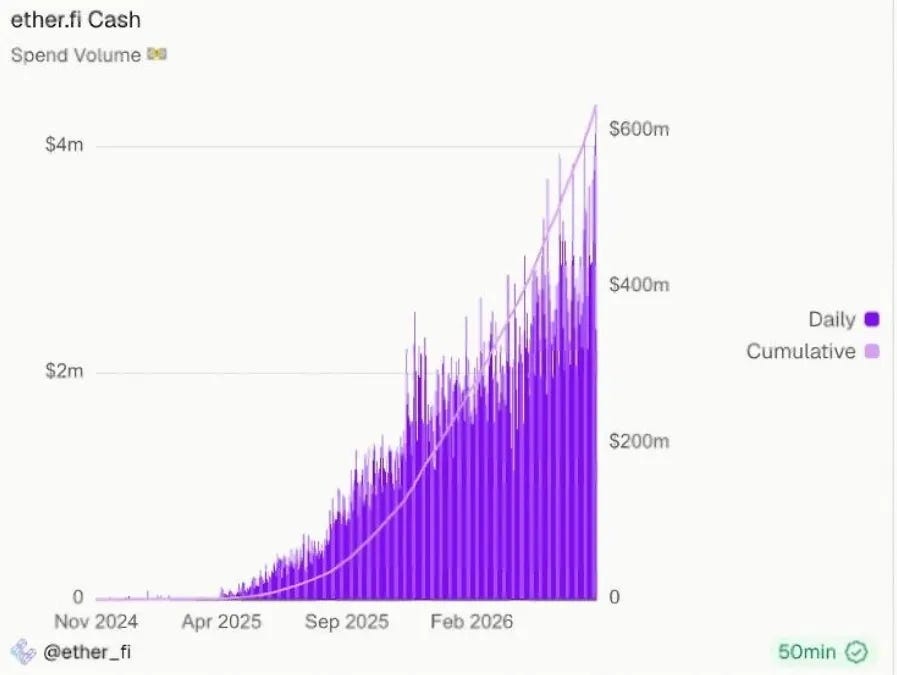
and users actually like the product, which is rare than it sounds in this sector.
On the token side, roughly 92.9% of the ETHFI supply is already circulating, so there’s very little future unlock overhang to absorb, and the team is running buybacks. A real product with real usage plus clean token supply is exactly what you go looking for during time capitulation.
I’m keeping this in the Project layer rather than calling a trade, because the thesis here is a business, not a price move. Dig in yourself before you form a view. I am using the card quite actively in Europe and Asia and like the 3% cashback and easy way to cash out crypto.
The biggest project story this week is a whole chain, not a single token.
Robinhood finally shipped its long-teased chain, and one week in, the numbers say this wasn’t just another quiet L2 launch. An L2, or layer 2, is a faster, cheaper network that runs on top of Ethereum and inherits its security.

The quick 80/20 on what it is:
A purpose-built L2 for tokenized stocks, built on the Arbitrum Orbit stack and settling back to Ethereum.
ETH is the gas token, free for Robinhood wallet users for the first 90 days. No new chain token to dump on you, at least not yet.
One catch: it runs on a single Robinhood-operated sequencer, the component that orders transactions. Decentralization comes later, if ever, so censorship resistance is much weaker than something like Solana.
Why it’s different from every other launch: no cold-start problem. Robinhood already has the app, the wallet, and around 28 million customers across 38 countries sitting on $307 billion in assets. Most chains spend years buying users. This one shipped with them pre-installed, plus a full day-one DeFi stack committed: Uniswap and dYdX’s Arcus DEX on trading, Morpho and Ethena on lending, Chainlink and LayerZero on infrastructure.
The data after 2 weeks:
~300,000 active addresses
3.3 million-plus transactions
$192 million in DeFi TVL, $347 million stablecoin market cap
$15 million in tokenized stocks and ETFs
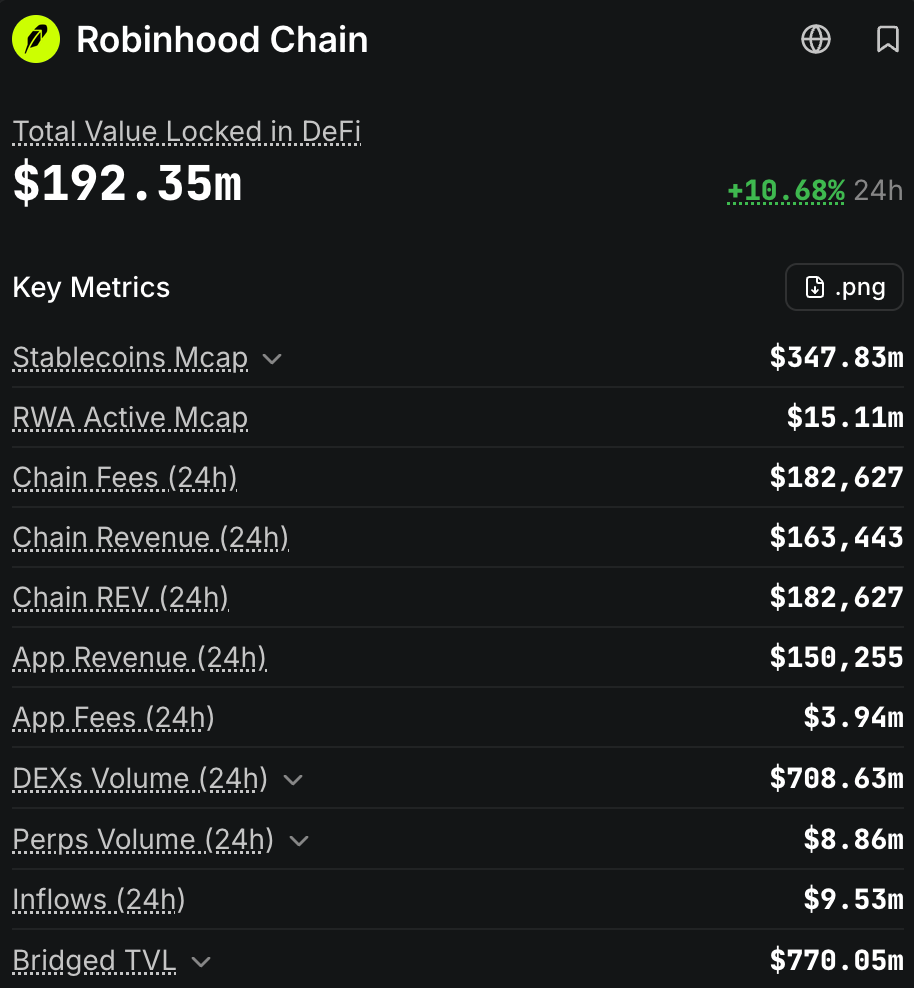
For a 2 week-old chain in a bear market, that’s a serious start. Fair caveat: with gas free for 90 days, some of it is juiced. The more reliable numbers come in October when the subsidy dies.
The flagship product is stock tokens: ERC-20 tokens tracking equities like AAPL and NVDA, tradeable 24/7 and self-custodial. Read the fine print, though. These are not actual shares but tokenized debt securities. You get the price movement, not the voting rights or full shareholder protections. And they exclude US persons, so Americans can’t touch Robinhood’s flagship crypto product.
Another juicy product is Robinhood Earn. Eligible US users can lend USDG, a regulated stablecoin, for around 7% APY via Morpho. That sounds like a nice feature. It’s the biggest business hiding here. Robinhood sits on huge user cash balances that historically earn it a spread through partner banks. Move even a slice on-chain and it stops being just a broker and becomes part of the stablecoin distribution economy, where the real profits concentrate.
Two honest caveats. Perpetual futures run on a fresh Lighter instance, which means bootstrapping liquidity from zero, and perps live or die on depth. And most trading so far is memecoins: DeFiLlama clocked ~$800 million in 24-hour DEX volume on Wednesday and $3.3 billion for this week from 13-19 July so far.
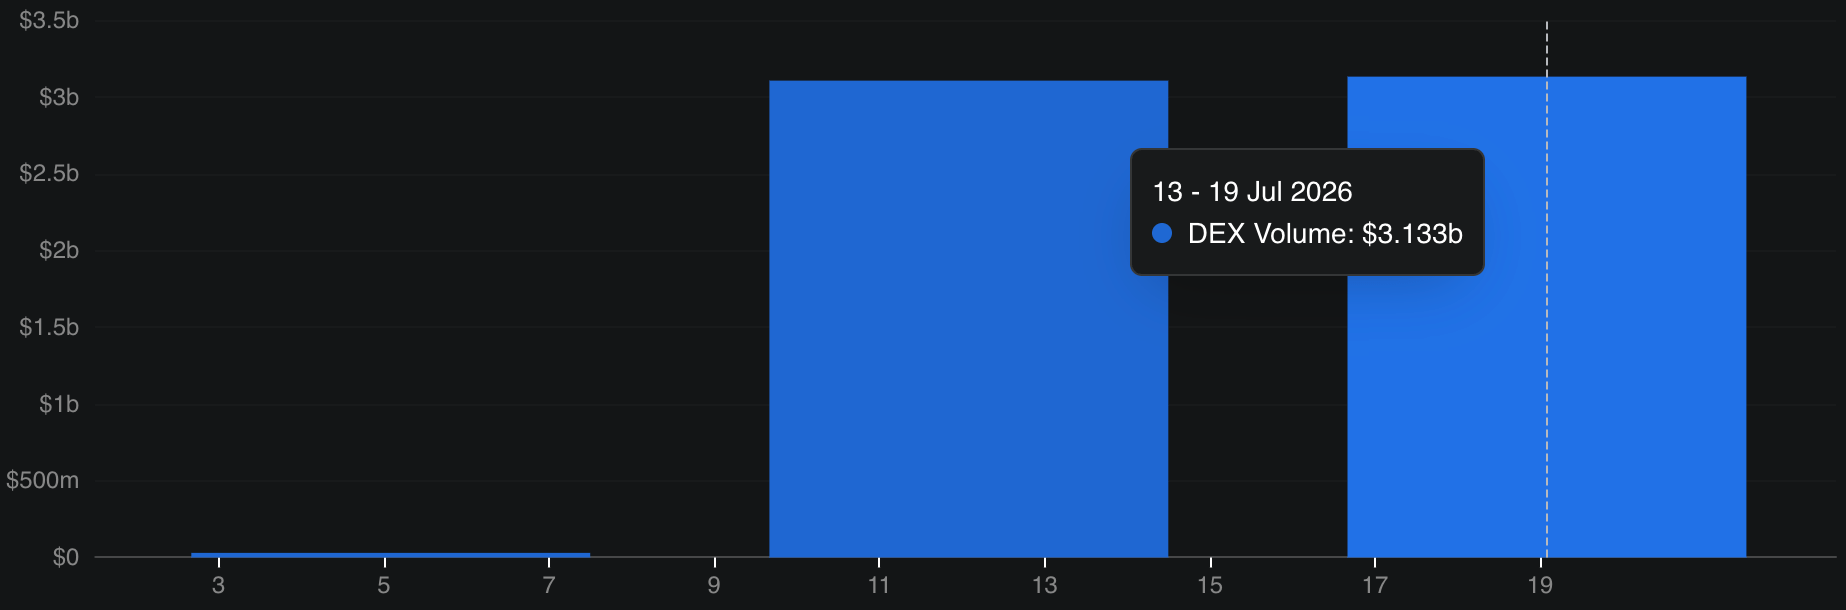
But most of this volume is memes and they lose people money and destroy trust. The bull case is the opposite: that the meme wave previews what happens when Robinhood’s ~27 million funded accounts arrive onchain.
So the honest question: more upside, or is the gas already running out? Volume and active addresses are stagnating at a high level.
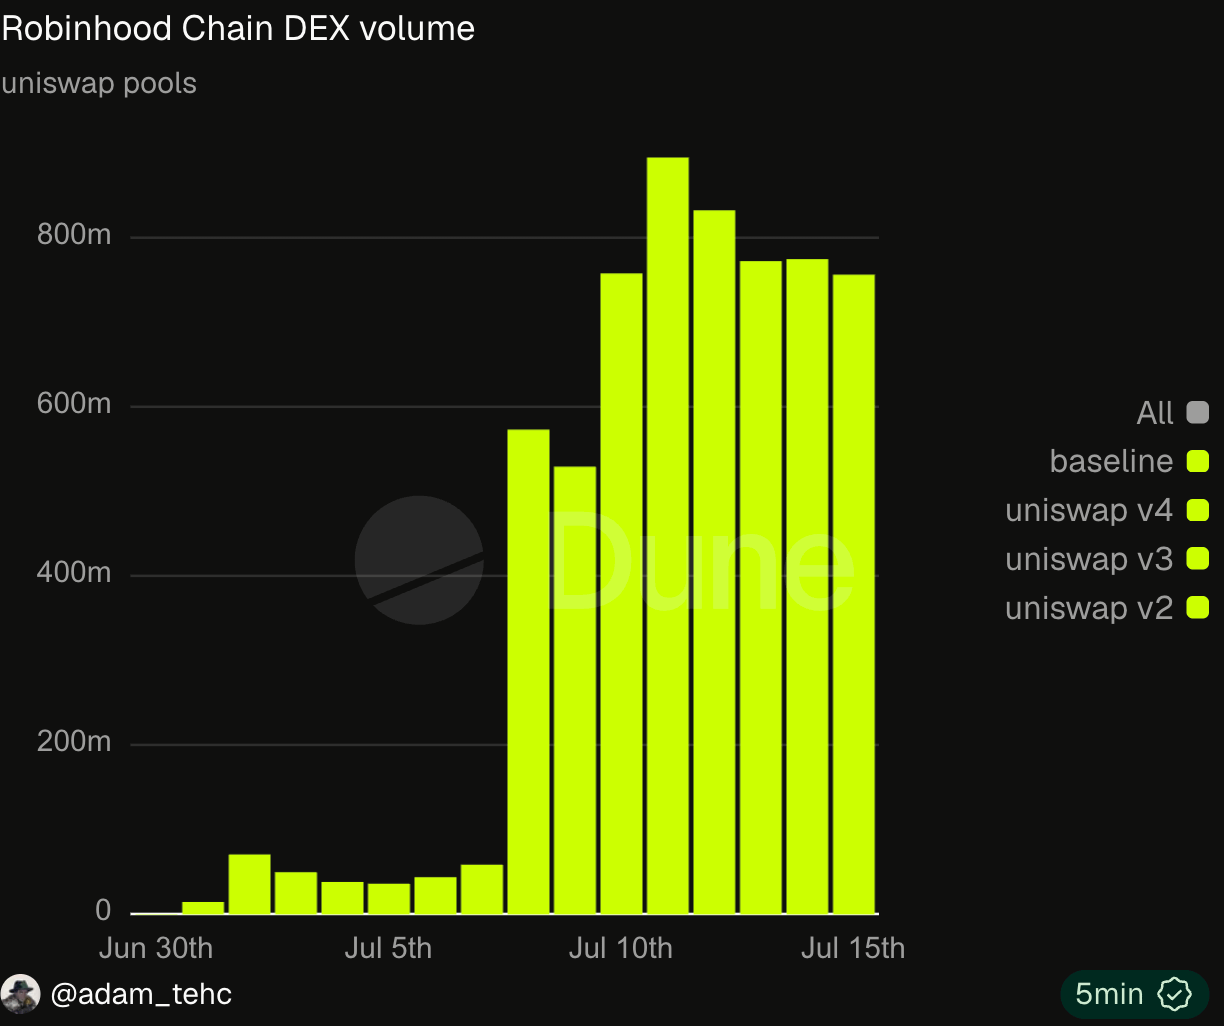
If the broader market keeps performing, it gets harder to keep crypto’s thin liquidity concentrated on one chain. This ecosystem is on my radar. It should be on yours.
The next question is how BTC price is behaving in this environment.

Bitcoin is trading back around $64,000 and pressing directly into the resistance band that has capped every bounce this cycle.
The first level that matters is $65,500, the prior high from June 22.
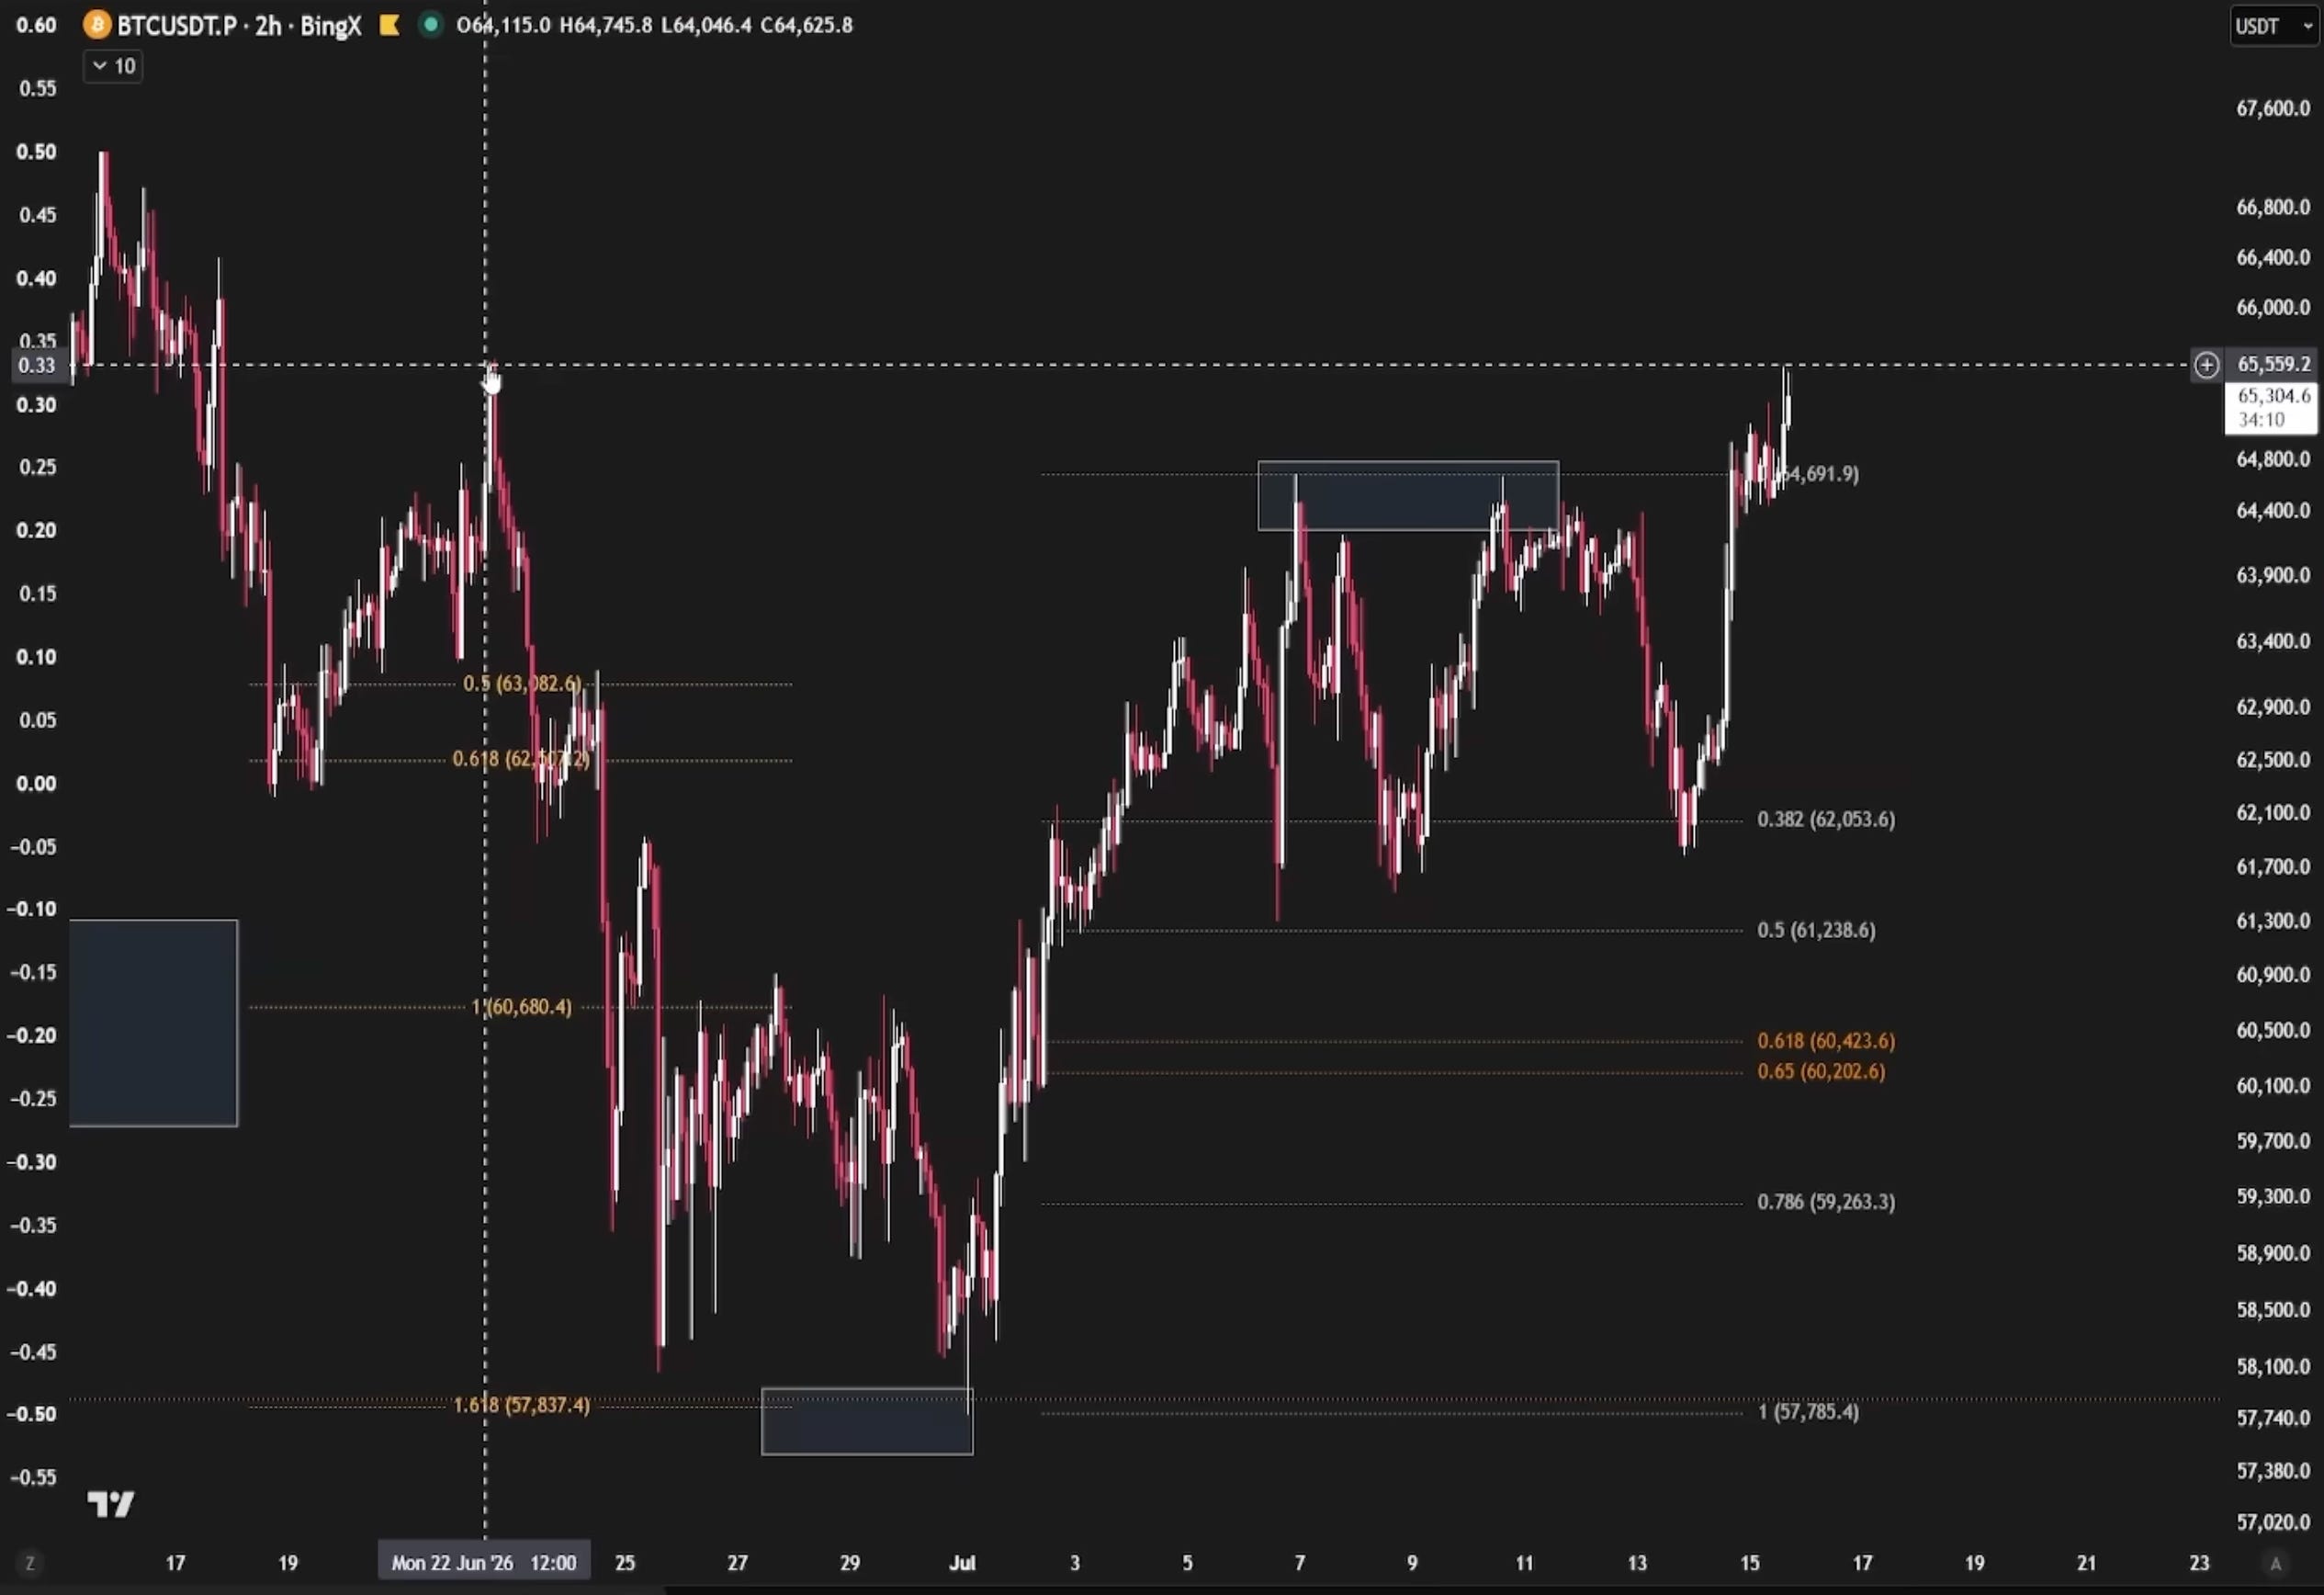
Until Bitcoin clears it convincingly, there’s no new higher high, which means the downtrend structure is technically intact.
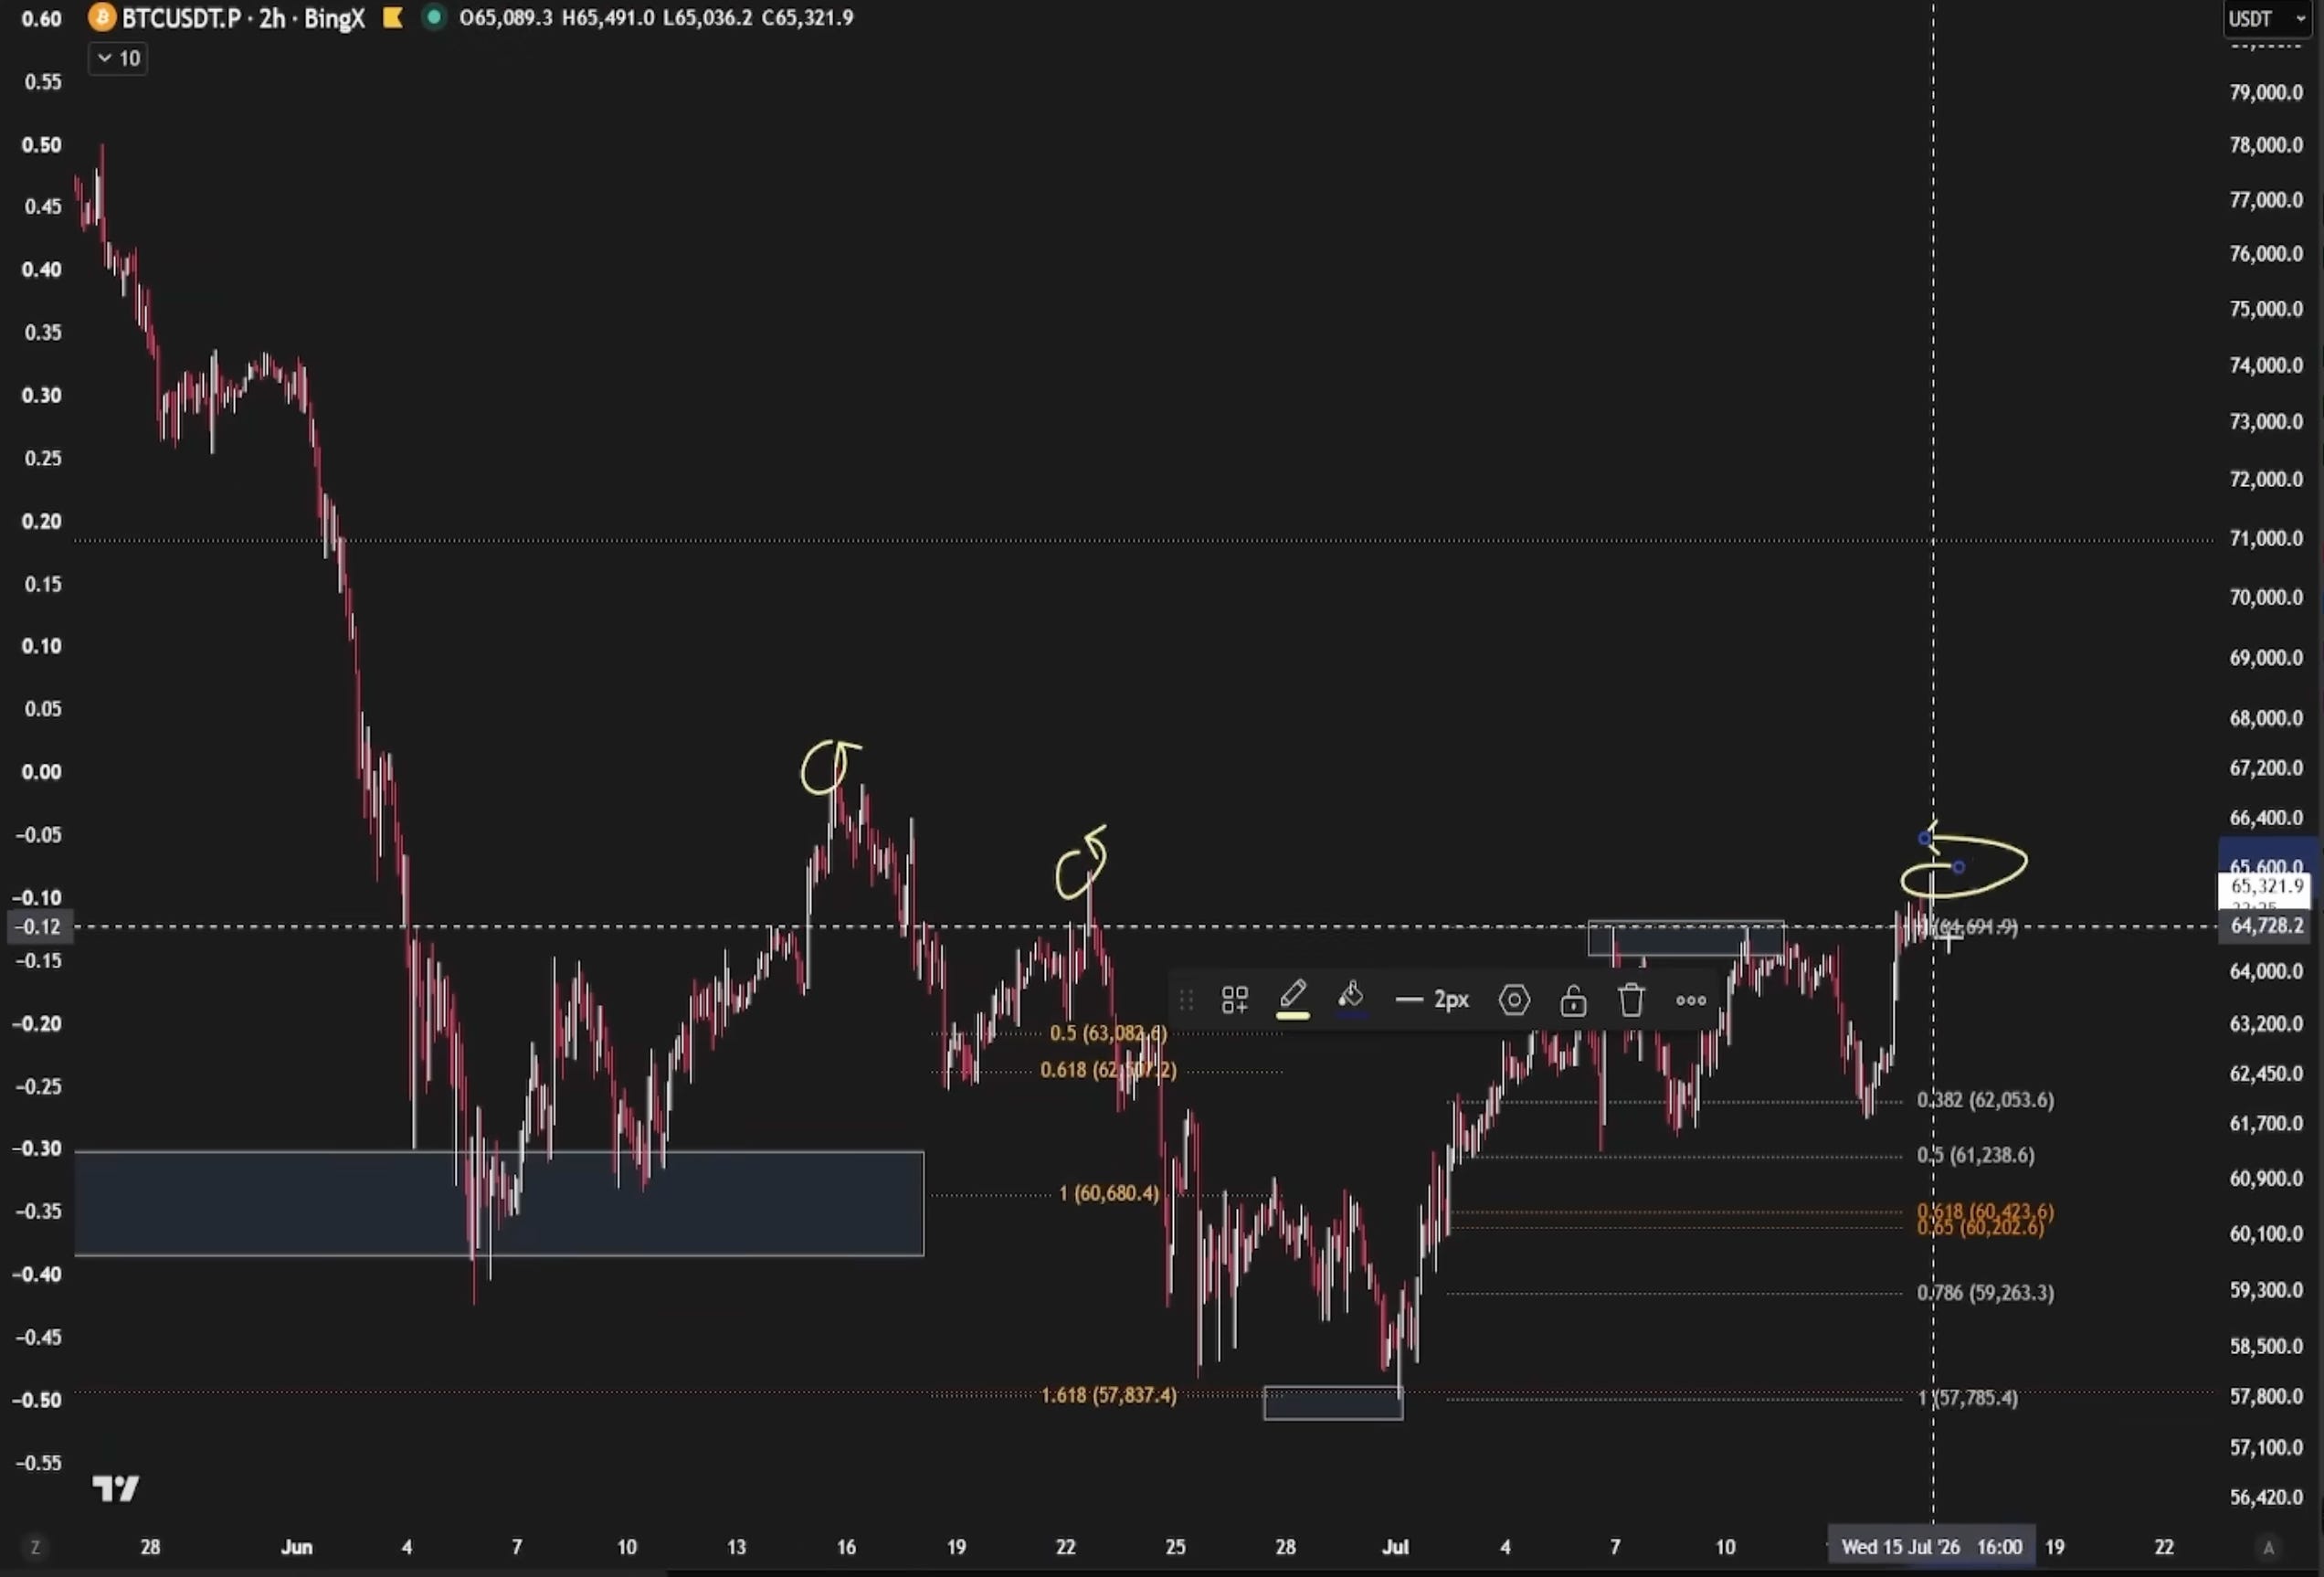
Above that sits $67,200, and then the zone around $68,000, roughly the short-term holder cost basis, the average price paid by wallets that bought recently.
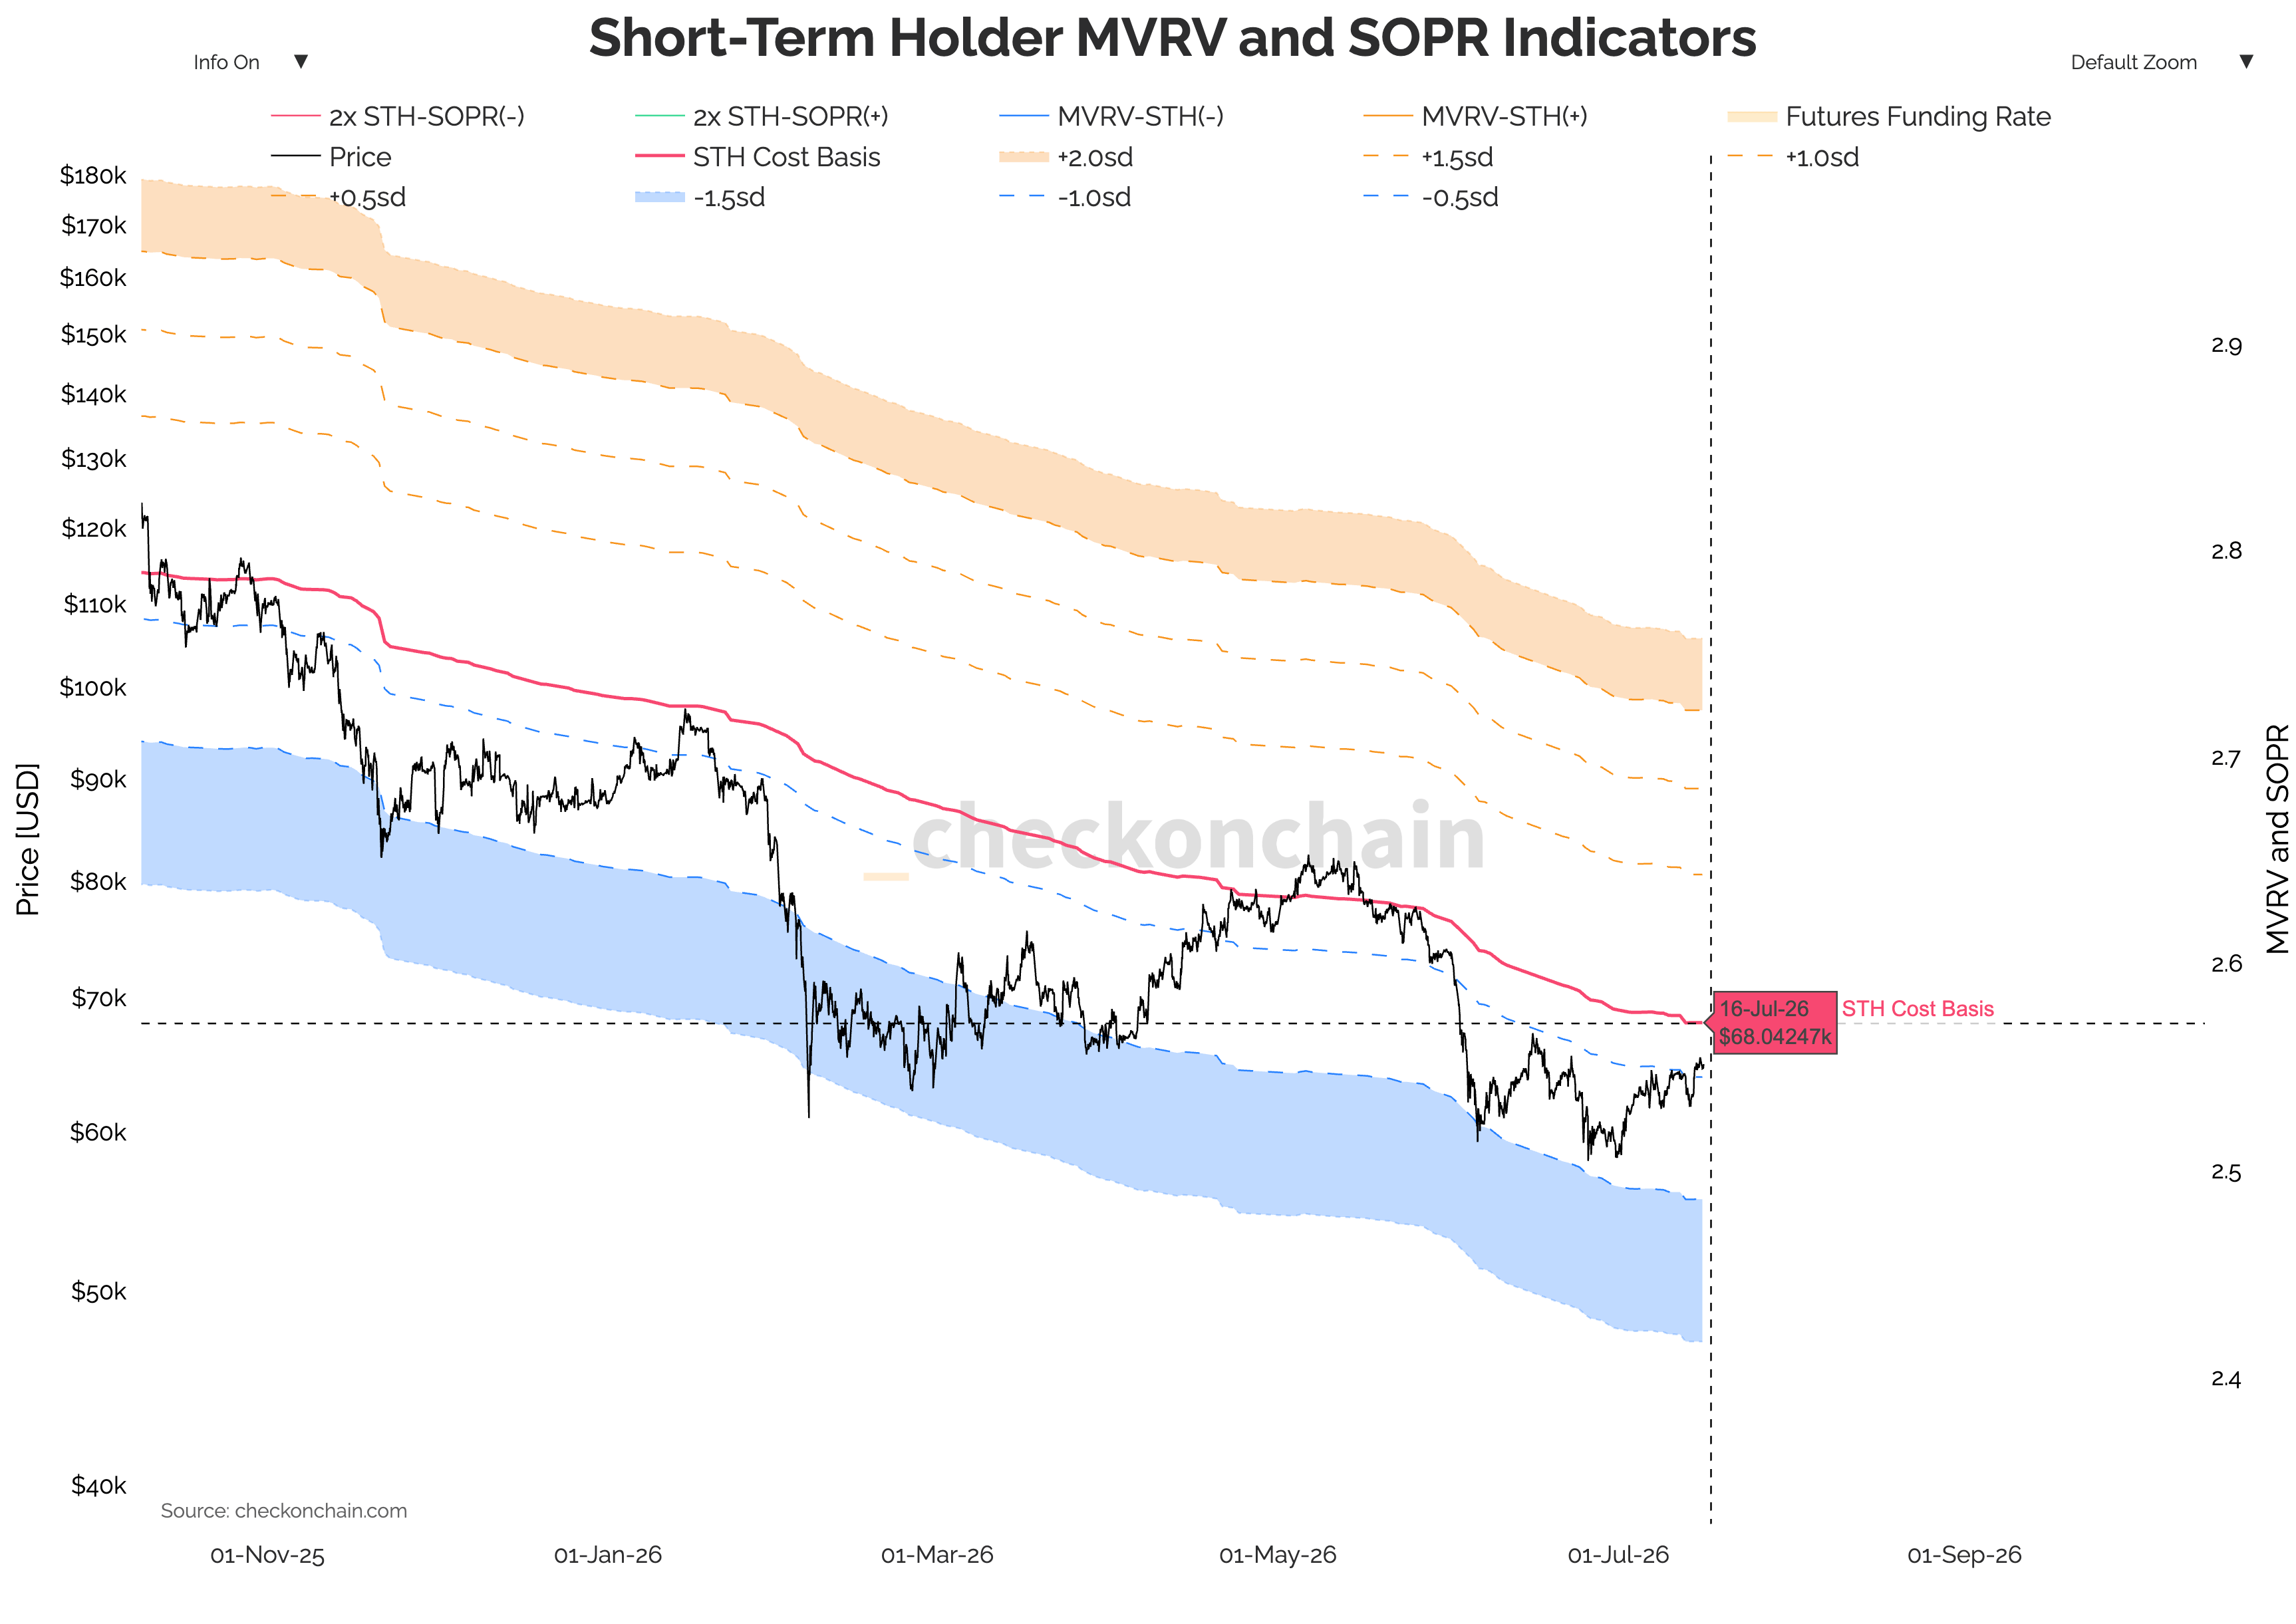
In past cycles, reclaiming that cost basis as support has been one of the more reliable signals that a bear phase is ending.
The levels I’m watching:
$65,500 (the June 22 high, no higher high until it breaks)
$67,200 (next structural resistance)
$68,000 (short-term holder cost basis, what recent buyers paid on average)
Above $70,000 (confirmation of a larger breakout)
$61,800 (downside liquidity where leveraged longs sit)
$55,500 to $47,200 (the larger long-term value zone on a deeper correction)
The move up is real, but the fuel is questionable. Spot demand is still soft: spot CVD is rising far less than futures CVD. CVD, or cumulative volume delta, tracks whether net buying or selling is driving price. When futures lead spot this hard, it tells us the rally is running more on leverage than on people actually buying and holding coins.
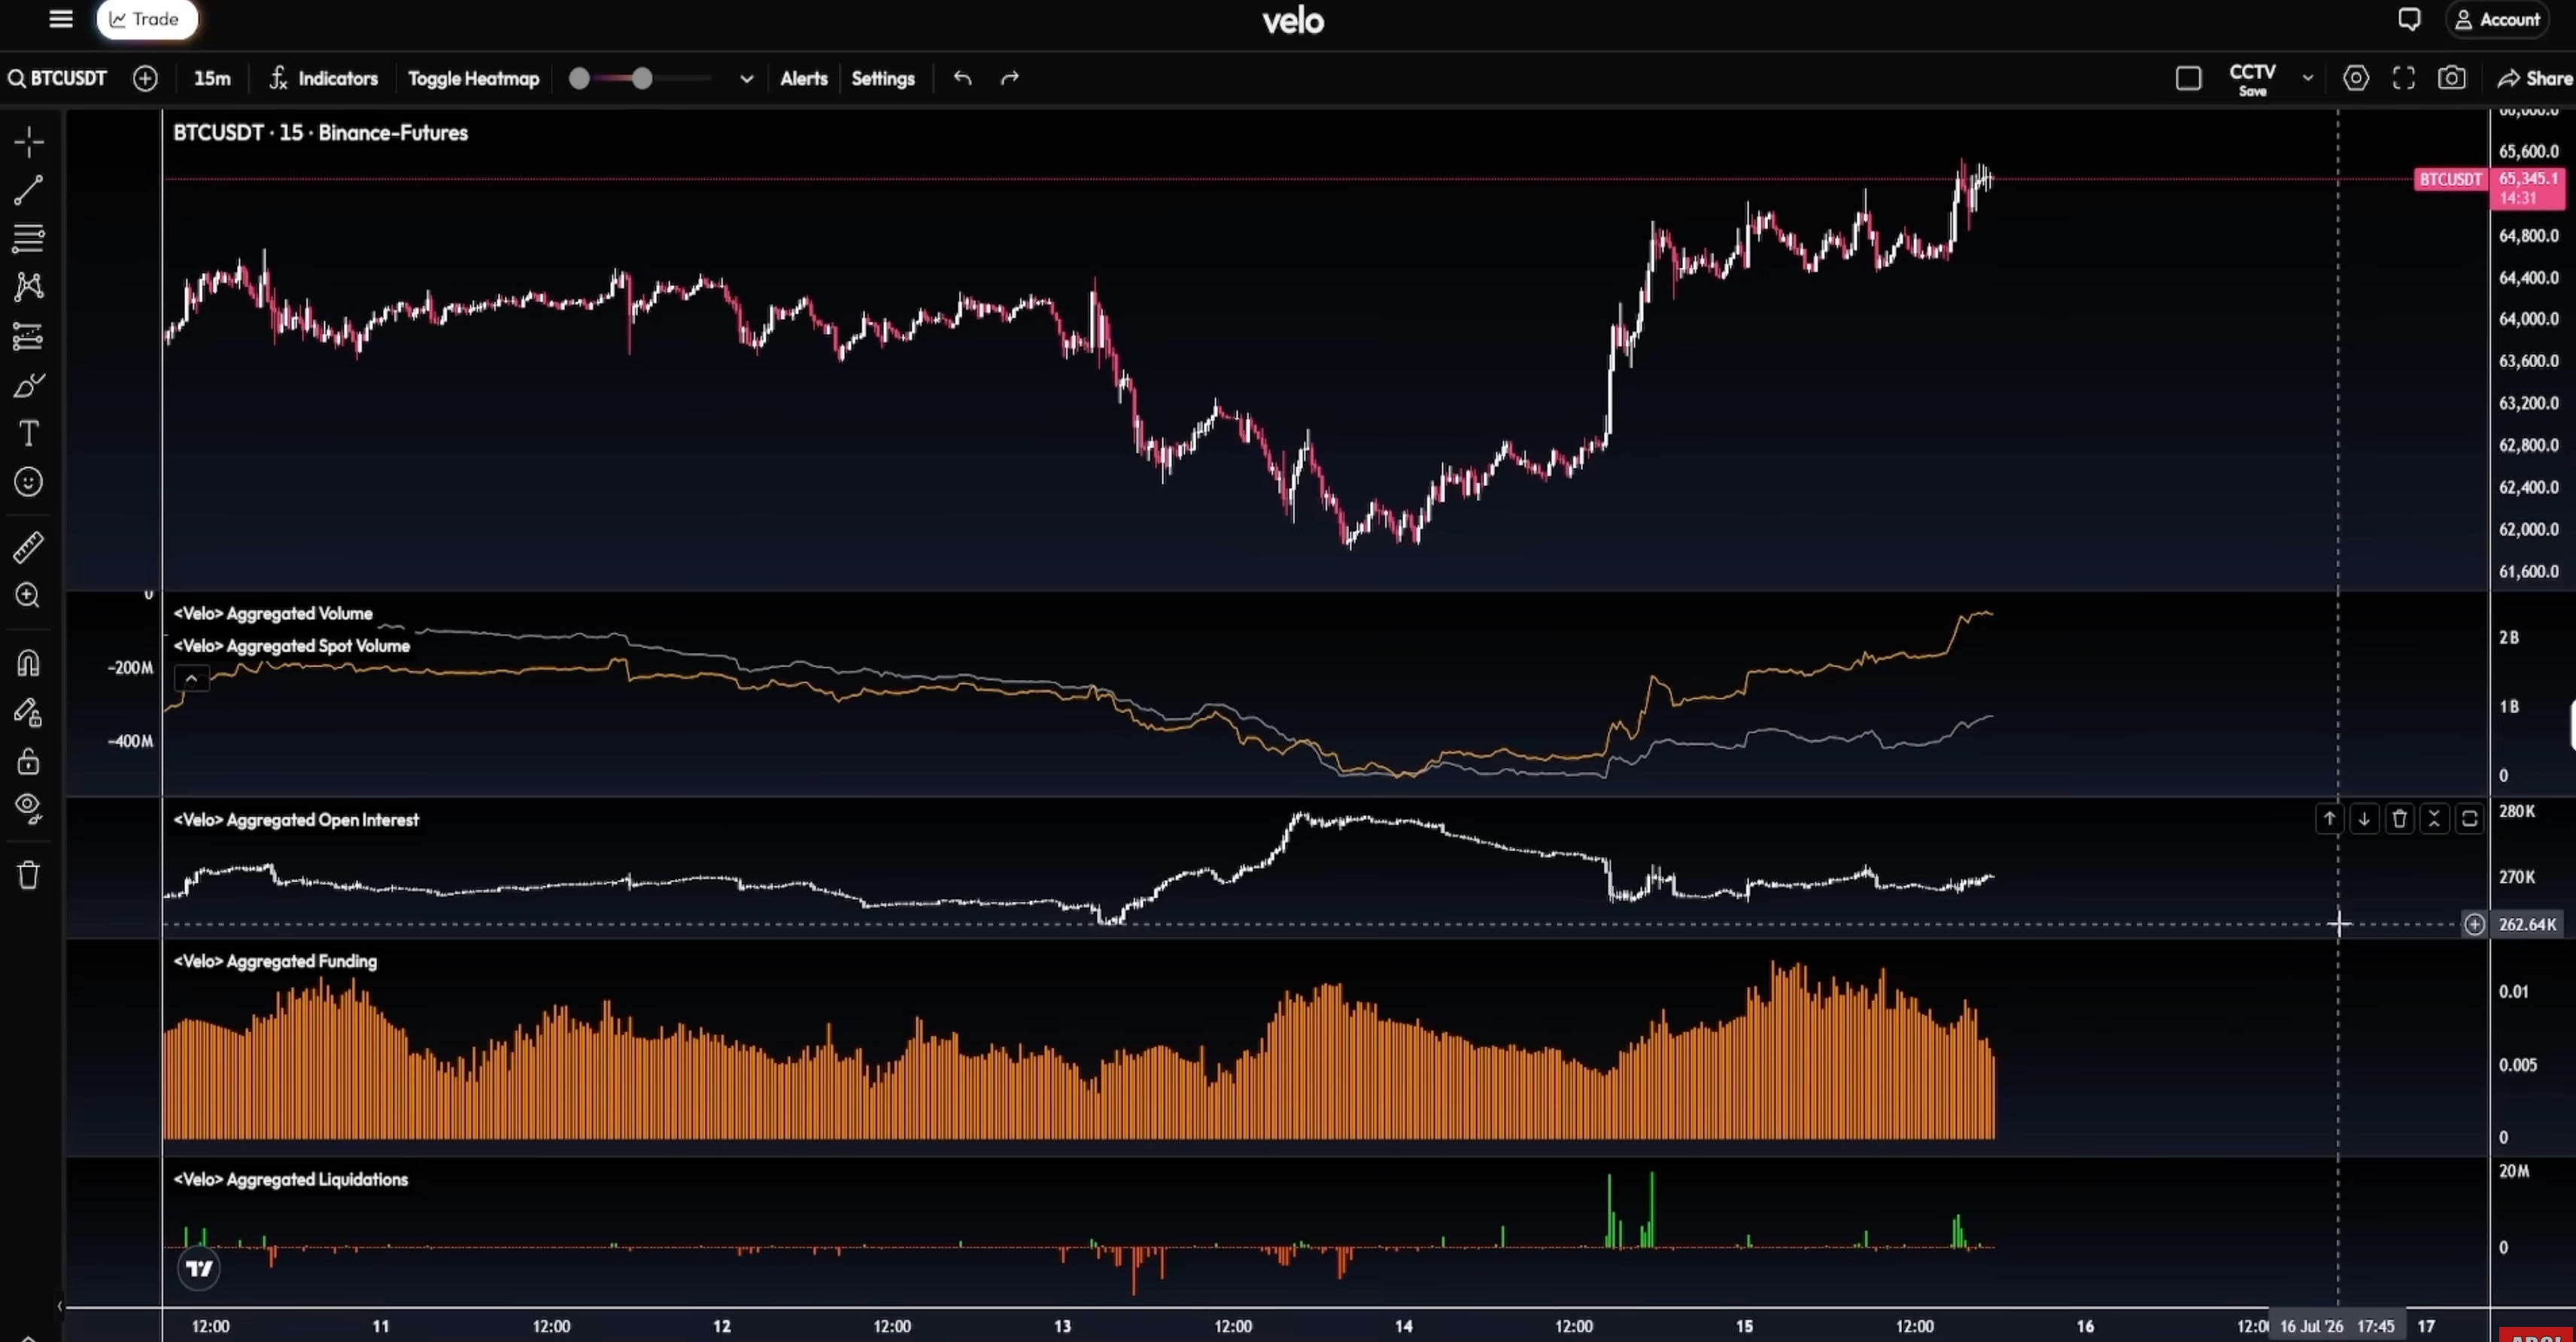
A large part of the push came from short liquidations. Traders betting on lower prices get force-closed, and closing a short means buying Bitcoin, which adds short-lived upward pressure. Open interest, the total value of leveraged positions still open, is roughly flat, so few new positions are entering. This looks more like existing shorts getting squeezed out than fresh conviction coming in.
The risk: above current price there’s only limited short-liquidation fuel left, while $61,800 is where leveraged longs get exposed on a pullback. Without stronger spot demand, the base case is that this move stalls at the prior highs again, exactly where the last few attempts died. A confirmed break and hold above $67,200 to $68,000 flips that read. I’ll keep you updated on Telegram as spot flows develop and when I enter my Bitcoin and Strategy trades.
For education and discussion only, not financial advice.
That’s it for today’s episode, thank you for being here!
Softer macro and on-chain rotation say the environment is improving. Bitcoin still has to confirm it by reclaiming $67,200 to $68,000 on real spot demand, not a short squeeze. This is the patient stretch of the cycle: build your list, size your risk, and let the sellers finish exhausting themselves. The mistake to avoid now is reading a leverage-driven bounce as the turn.
Till next time, stay safe!
No posts
Comments
Nothing yet. Say the first thing.
Sign in to join the conversation.