
Melbourne is a large city with an expansive railway network travelling through a mix of residential densities, from the flats of the Inner South-East to the fields around Wattle Glen. A question worth asking is which train station has the densest catchment area — and whether it might be Wattle Glen (spoiler: no).
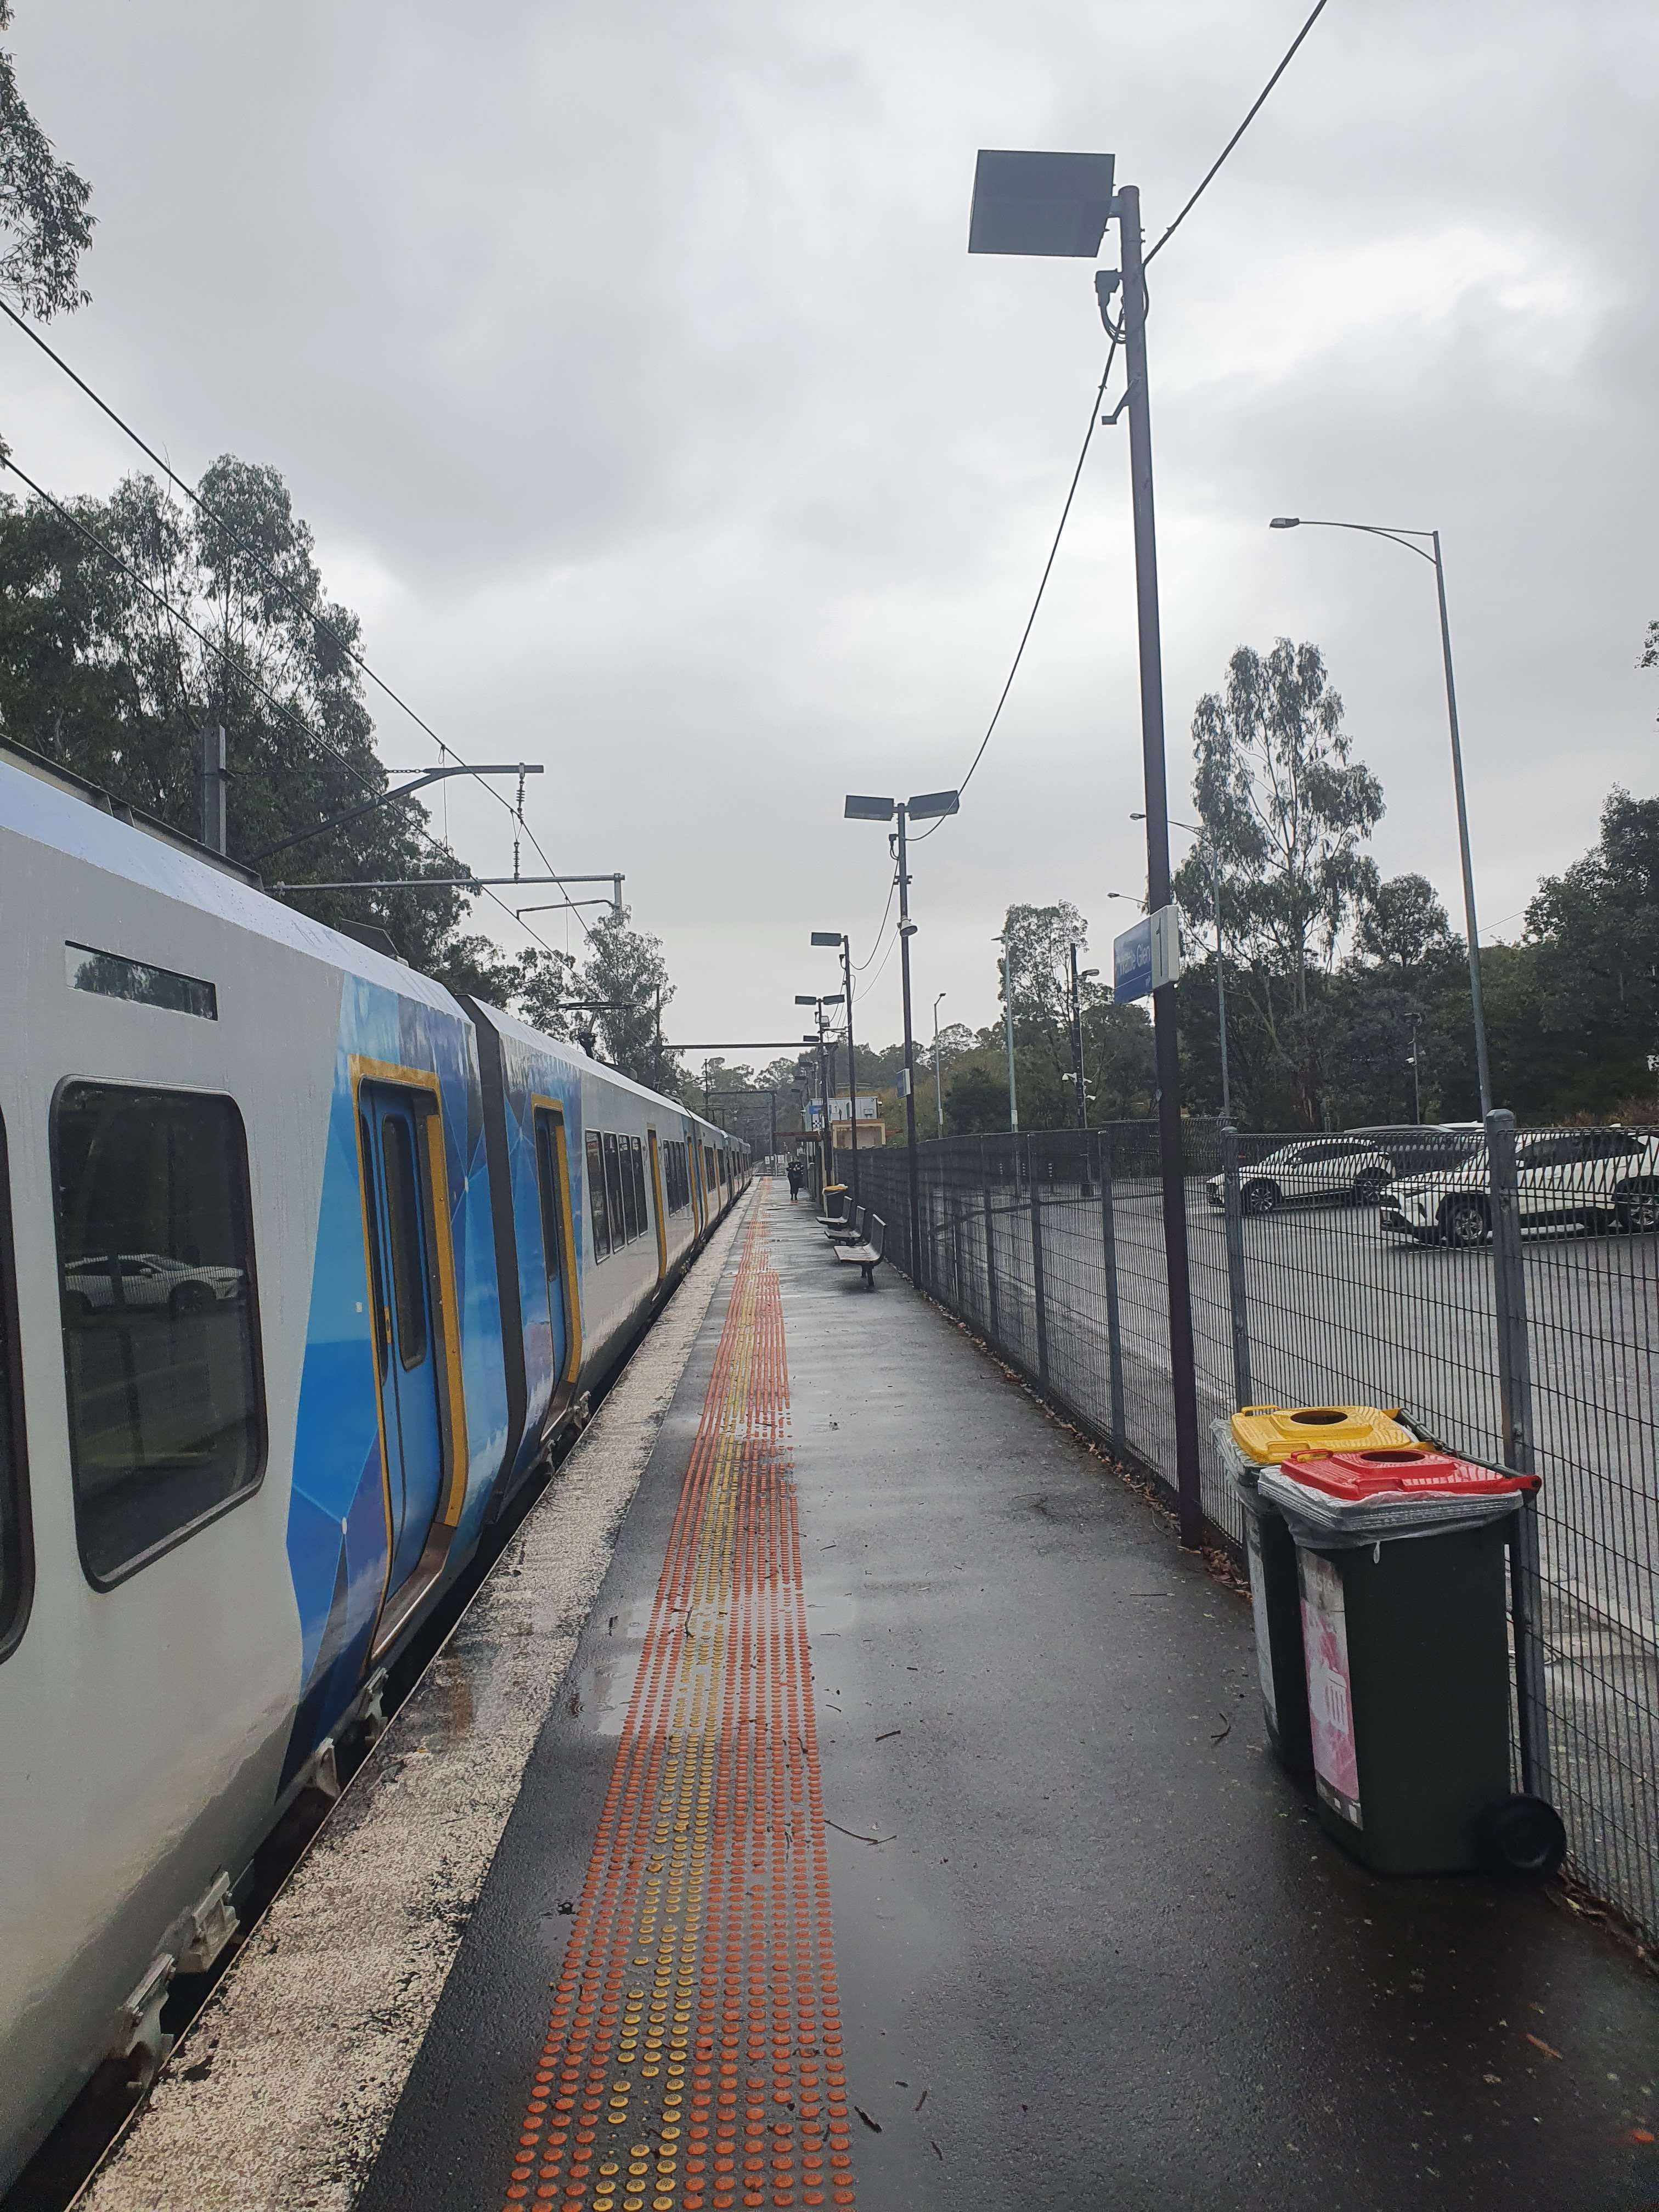
How to calculate station catchment
For this post, I use an 800‑metre radius around each train station as its “walkable catchment”. In areas - particularly in the inner suburbs - that fall within 800 metres of multiple stations, I assign each area to whichever station is closest.
Thanks for reading! Subscribe for free to receive new posts and support my work.
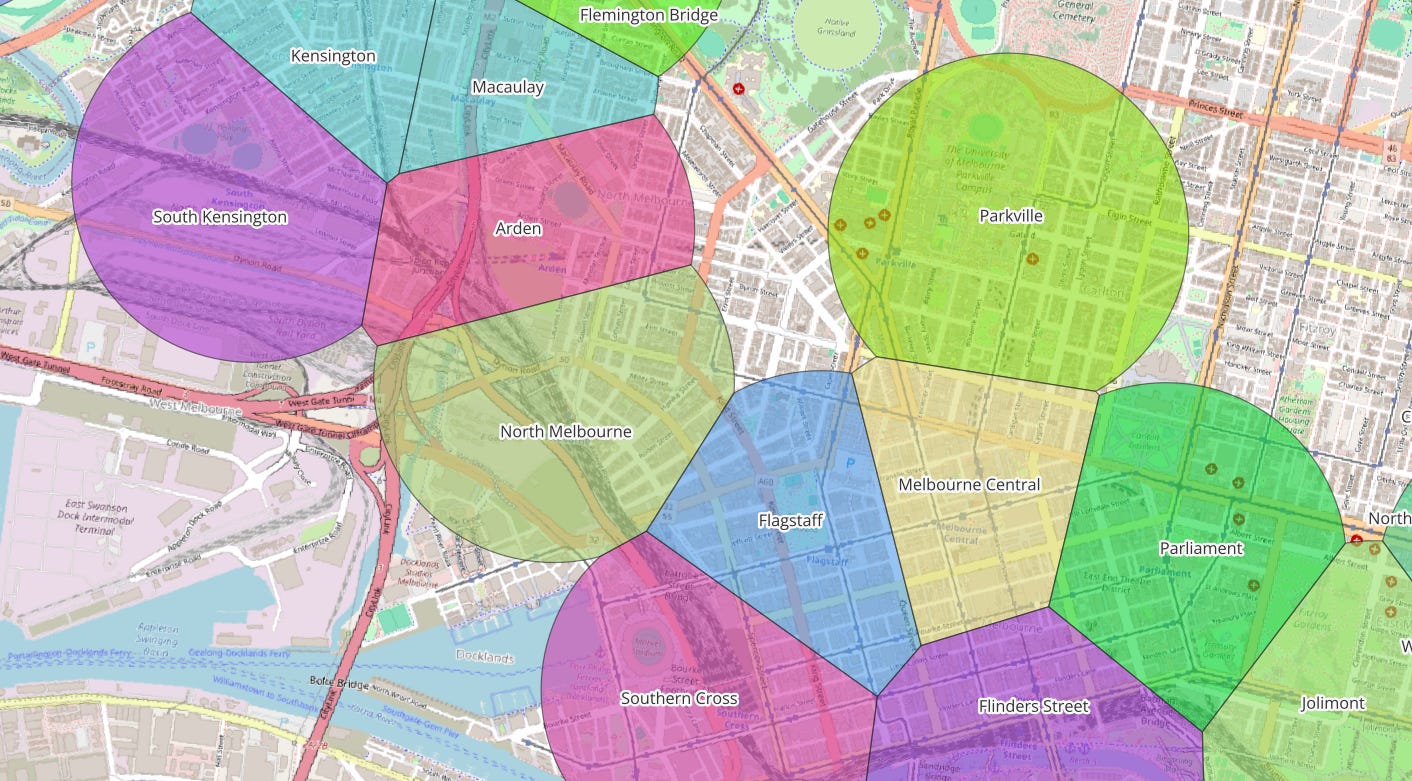
I then intersect SA1s (small census geographies) with the catchments to determine which station they belong to. If an SA1 crosses a catchment boundary, I split it along that boundary.
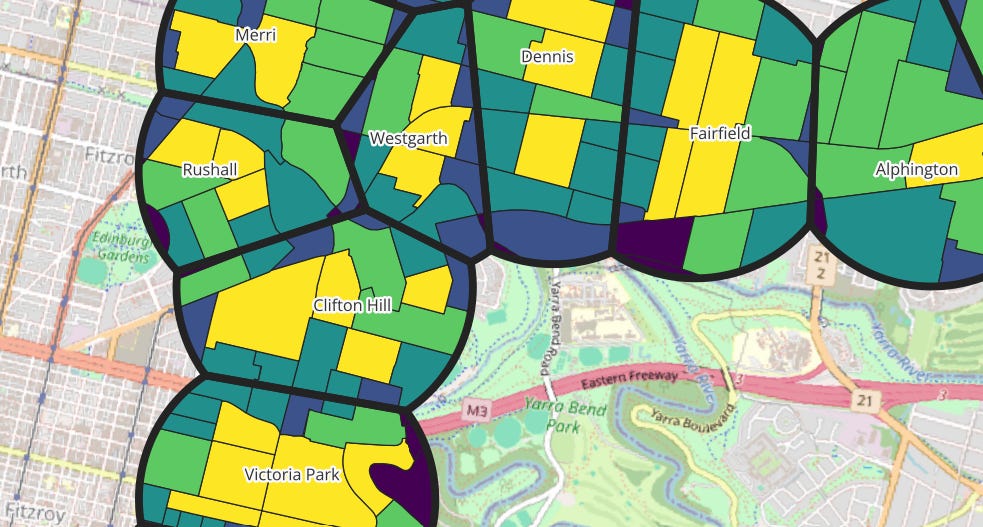
This image shows the process in action, colour‑coded by how much of the original SA1 remains in the resulting shape. Yellow areas are SA1s that did not require splitting.
Of course, there is a potential problem with this approach, being that SA1s are not always consistent across their whole area and may be weighted to one end for a myriad of reasons.
Top 10 Station Catchments by Population
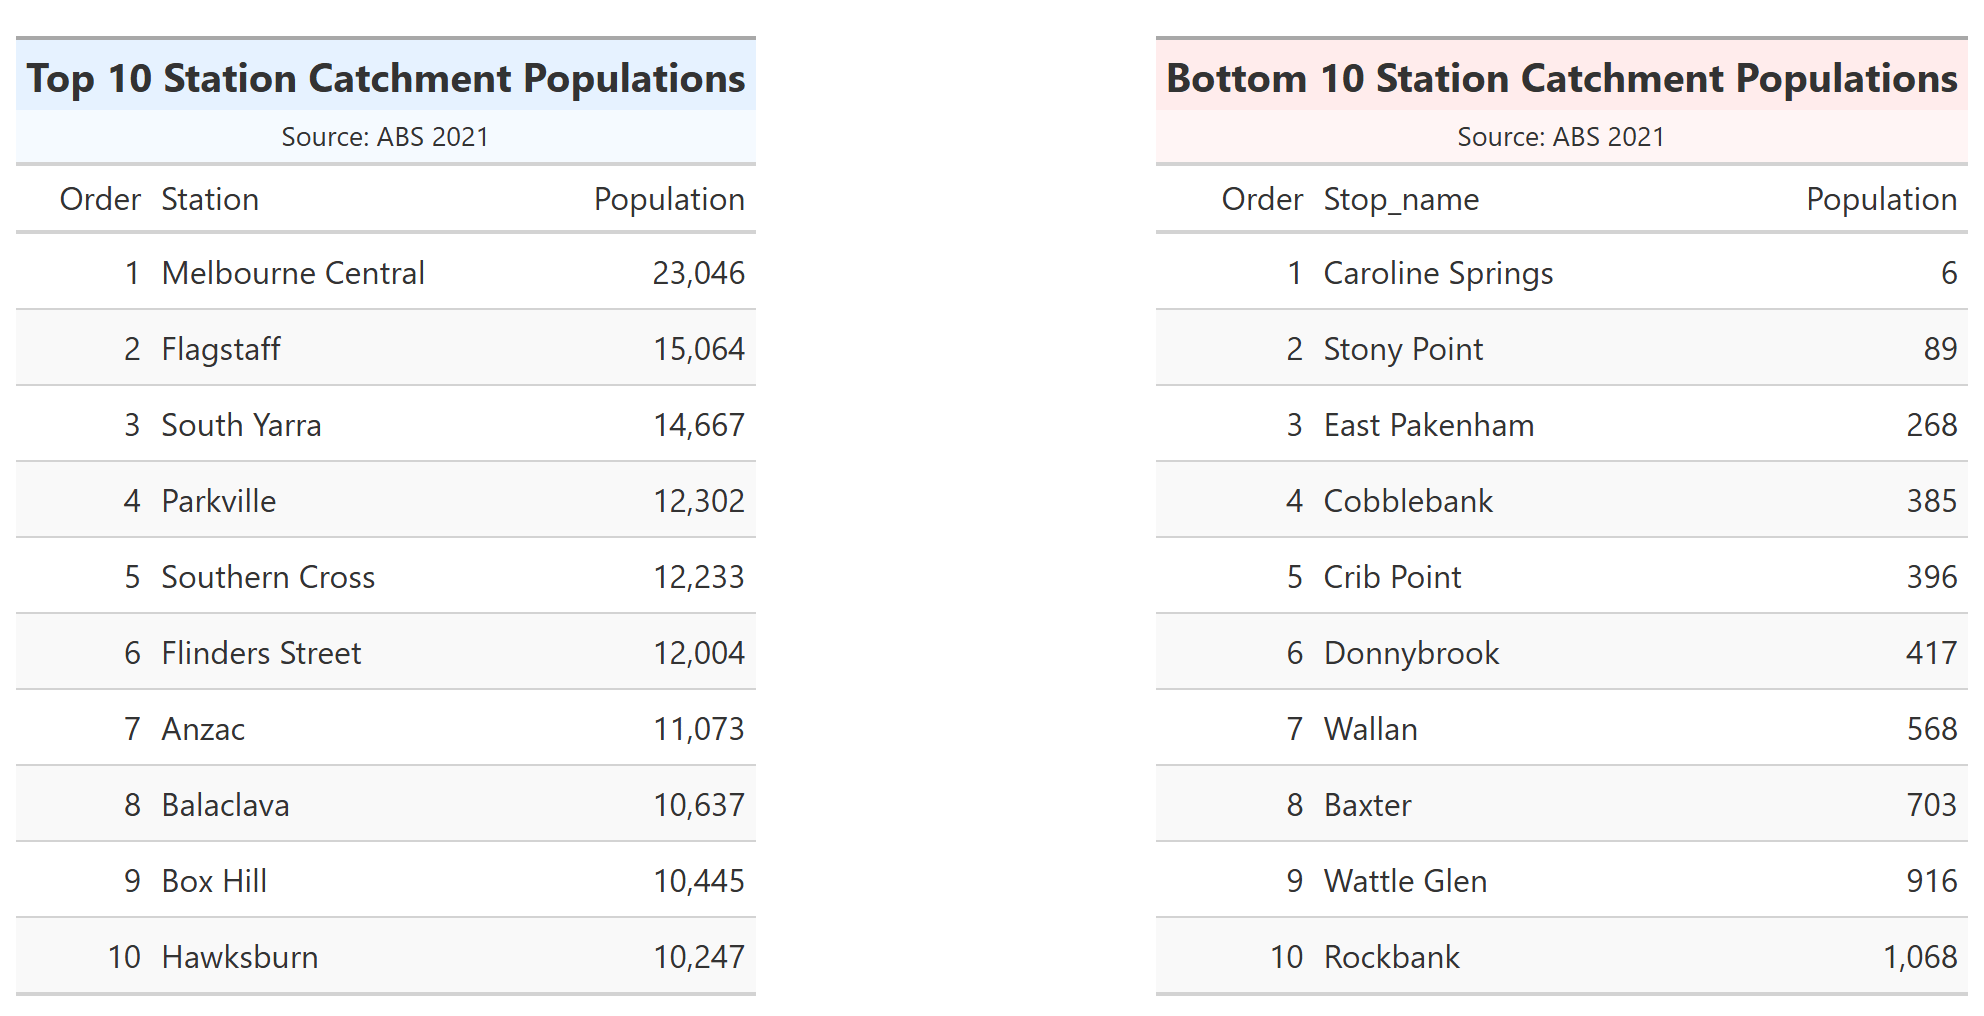
Side by side, we can see the top 10 largest station catchment populations and the bottom 10. The bottom 10 is dominated by stations on the edge of Melbourne, which makes sense. However, as the census data is from 2021, I suspect we might be missing much of the new housing around Donnybrook, Rockbank, Cobblebank and Wallan that has sprung up since.
The other issue that I have run into here is what I warned about in the previous section, some SA1s are uneven, especially on the edge of Melbourne.
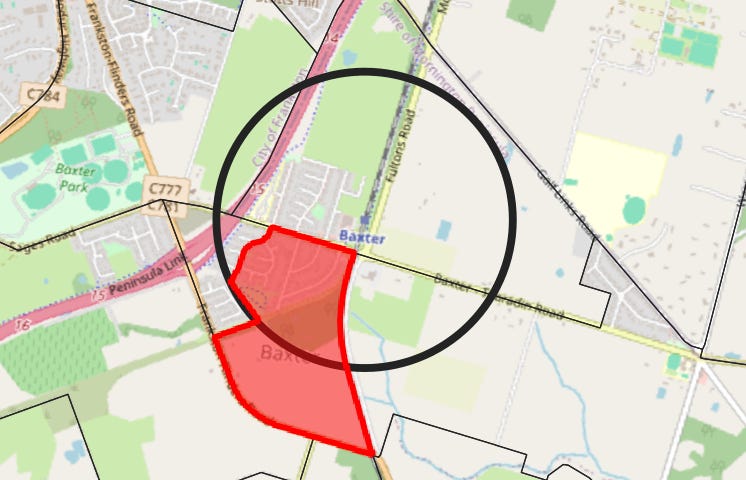
Take this SA1 (“21402138504” — shout‑out if you happen to live there). Near Baxter Station it contains typical suburban housing, but also some fields to the south. My method assumes that the population is spread evenly through the SA1, and thus only around half of the residents will be given to the Baxter Station 800m catchment count. Of course, in reality, all of those residents are within walking distance of Baxter Station.
The top 10 list is dominated by inner‑city stations, along with select suburban locations such as Box Hill and Balaclava. However, due to the splitting of station catchments by whichever area is closest, it is also worth looking at the population density of the station catchments to negate the impact of catchment sizes.
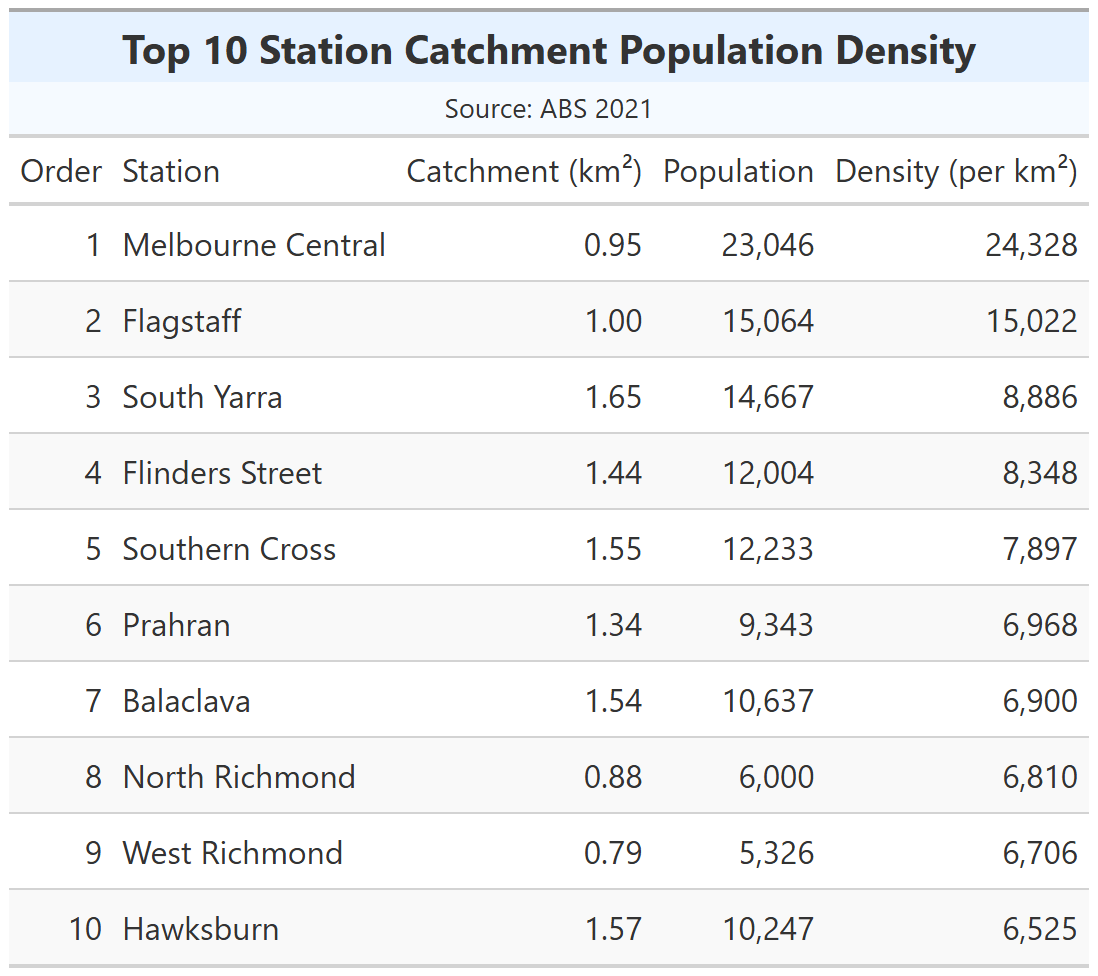
We can see that the catchment of Melbourne Central is by far and away the densest station catchment in Melbourne. The area to the immediate north of Melbourne Central, past Latrobe Street, has a large amount of student housing towers.
South Yarra, at no. 3, is a well-established high residential density hotspot, with its mini skyline being visible as far away as Cragieburn. And going down the Sandringham line, Prahran and Balaclava have strong showings.
A Pretty Map
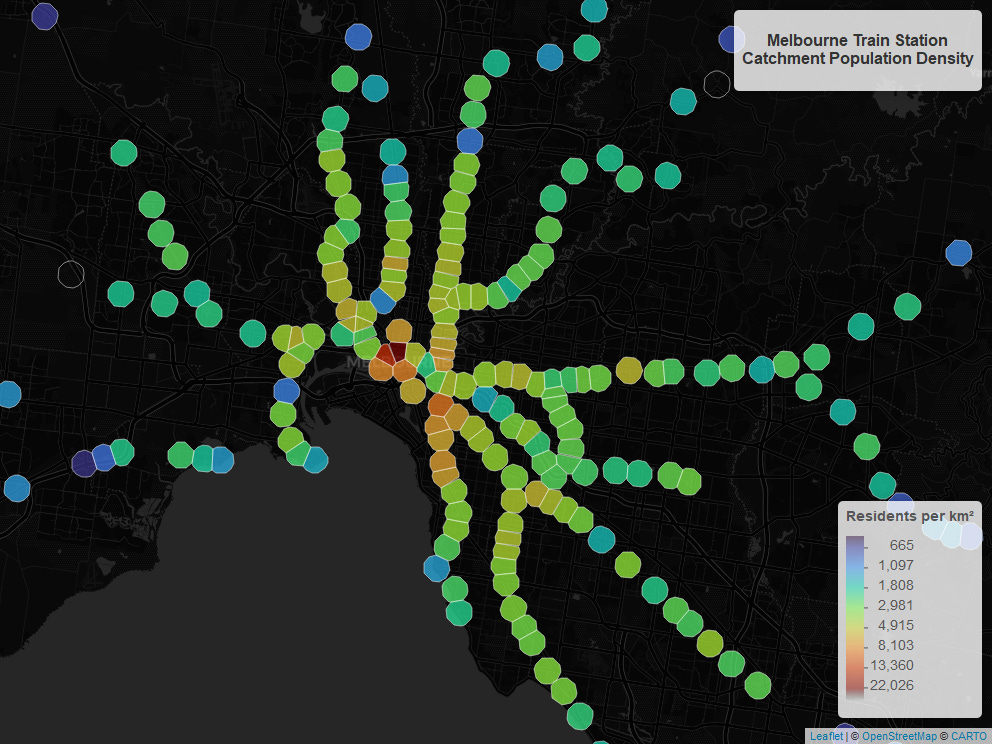
To display all the data, I made an interactive Leaflet map. Unfortunately, Substack is very selective with what it allows me to embed, so check out the map over here: https://adambain014.github.io/VicTrainPatronageAnalysis/density_map.html
Here is a screenshot of the map:
Is Catchment Density Correlated with Station Patronage?
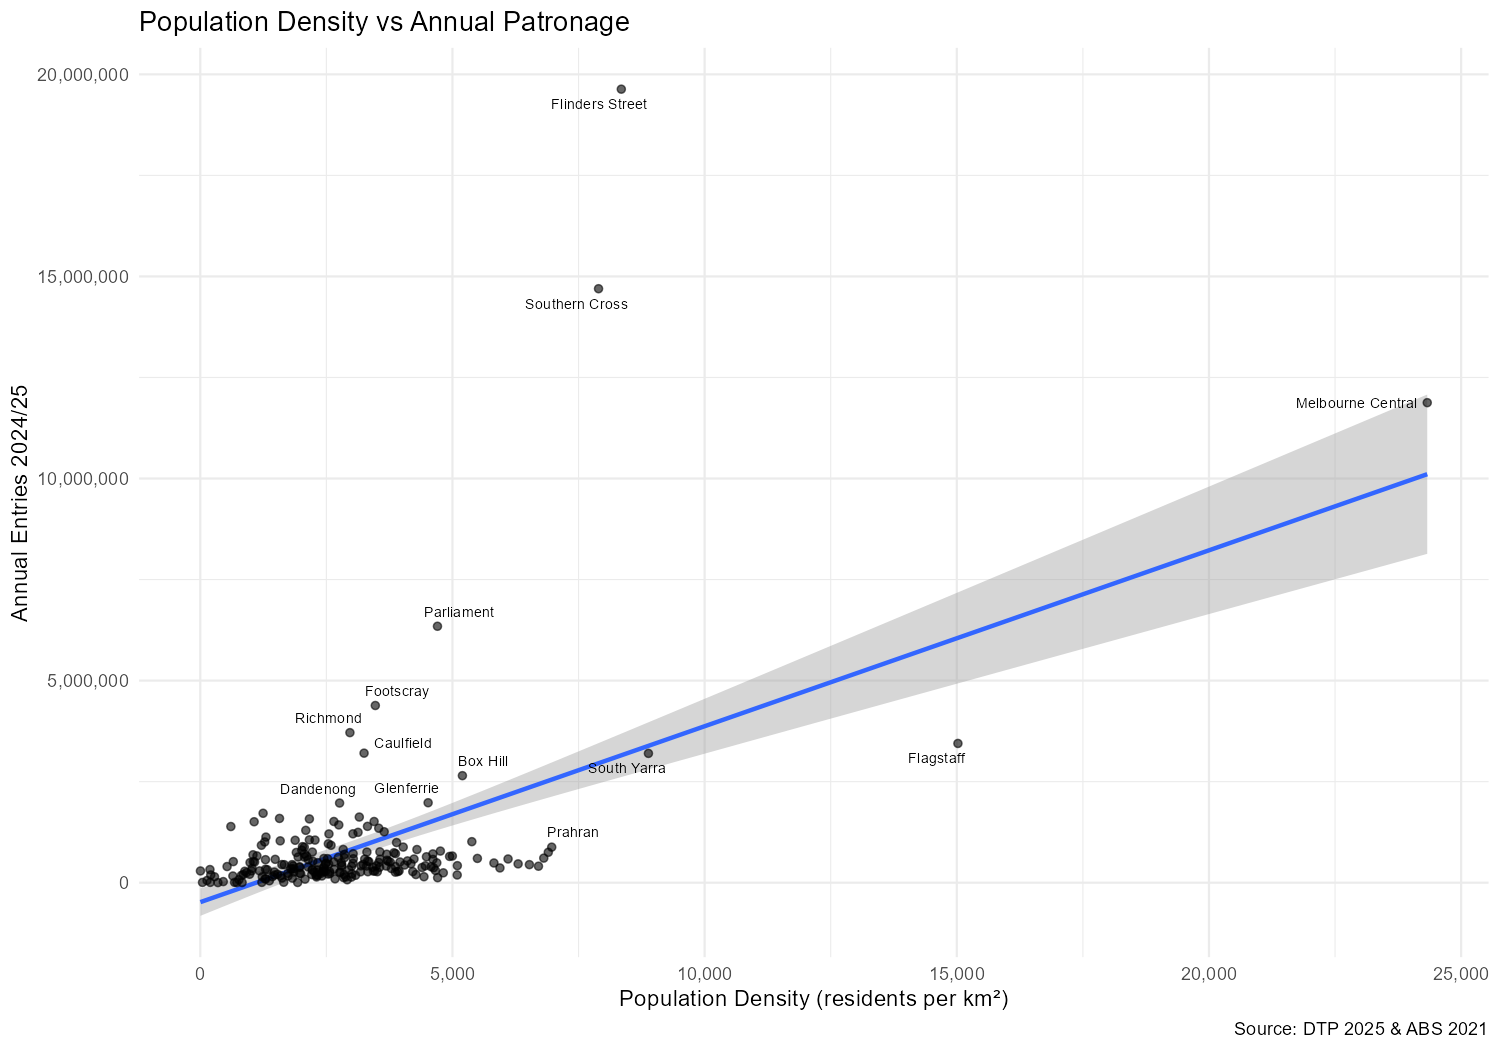
Well, maybe. However, the extreme values make this chart hard to make sense of. To compress the data, I decided to apply a log-log transformation to both metrics.
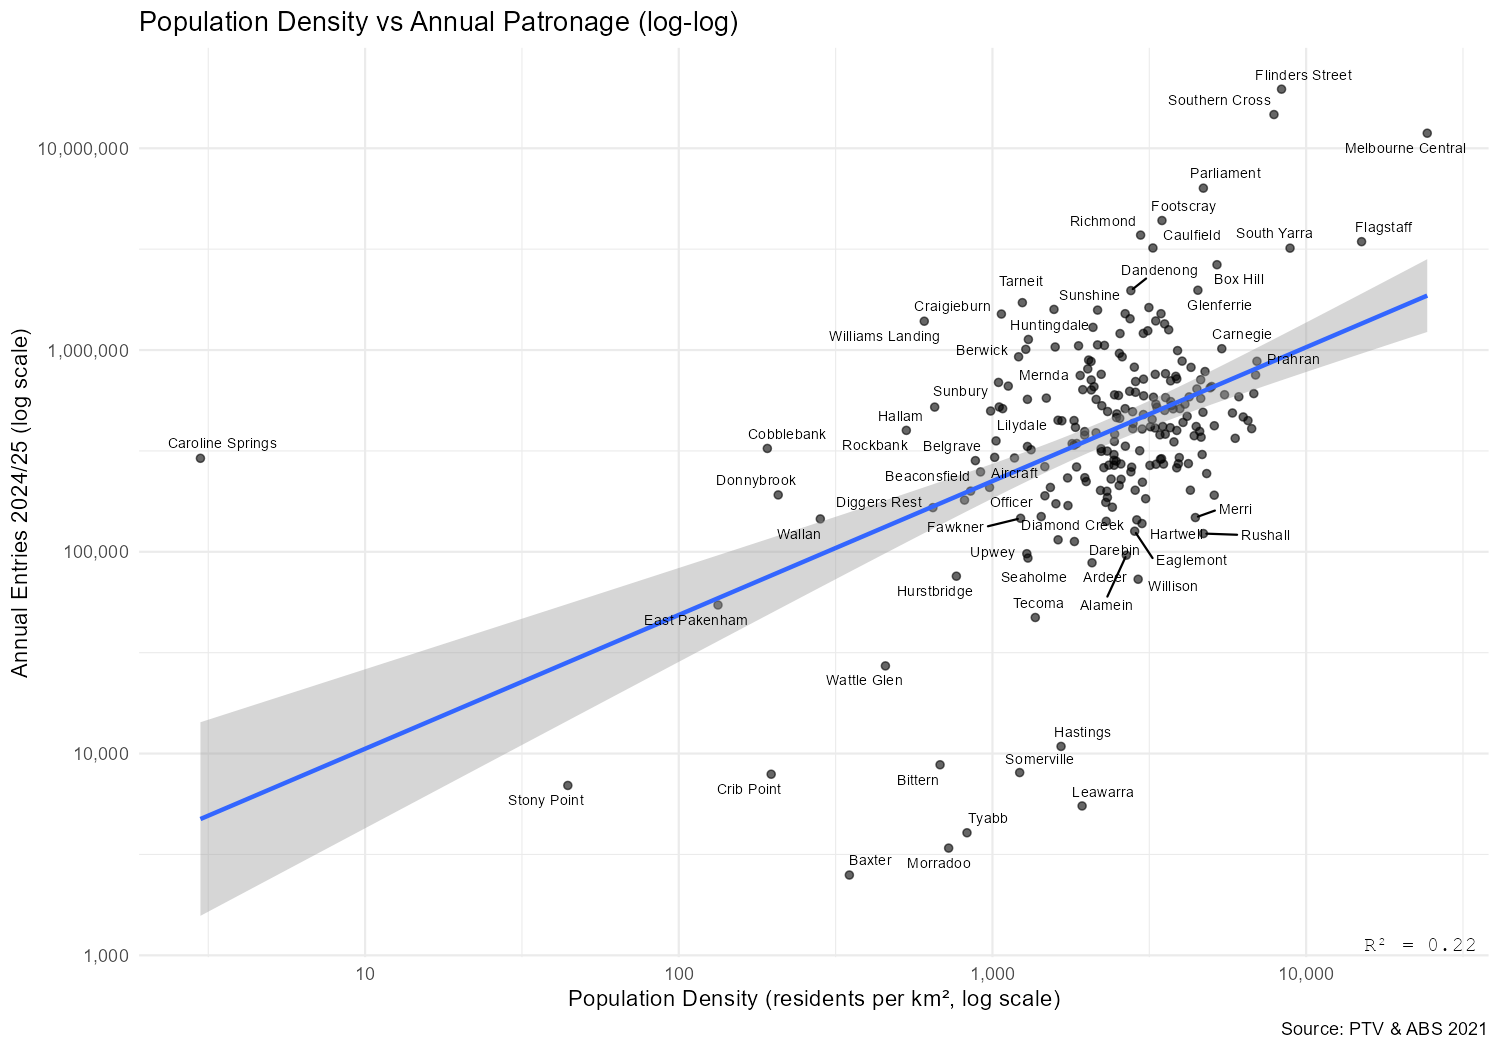
From this compressed chart, I think it is clear that there might be some vague correlation, but the scattering around, particularly the big cluster in the middle, suggests that it is not fantastically predictive.
Final Thoughts
Train station patronage may not be driven solely by residential density around the station, but I think that actions such as the Victorian Government’s activity centres program are still likely to increase patronage, and thus train crowding. I hope that if this comes to pass, that we are ready to run more services on busy train lines, all day.
I also think it would be worth looking at other potential sources of patronage such as:
Bus Connections
Park and Ride facilities
Workplace Density
Each one of these likely drives station patronage. Keep your eyes out for future posts on those topics!
Thanks for reading! Subscribe for free to receive new posts and support my work.
Comments
Nothing yet. Say the first thing.
Sign in to join the conversation.