
Hey, this post is a detailed walkthrough of what Investorstack is, why i built it, and how i use it to research stocks 2x faster.
First, some background on me. I’m Abhay - 20 years old, in my 3rd year of college and contrary to what many people assume, i don’t have a coding background. I don’t even know how to write a single line of code. I wanted to build something that compounds my day to day work - which is investing and reading businesses. Scrolling through X or Google you will find dozens of products in this space; i tried many of them but was never convinced - hence Investorstack was born, to scratch my own itch and build exactly what i wanted to see.
Investorstack is 45 days old, and it’s wild how much i have shipped in the past 30 days. We have crossed 350 active subscribers, and a data point i find particularly telling is that a meaningful chunk of users who sign up for the quarterly plan upgrade to yearly within 7-10 days of using the product. That tells me Investorstack is doing exactly what it was built to do - making investing easier.
Enough of my rant. Now let’s start with what Investorstack has for you - there are many features you won’t care about and that’s fine. Find what fits your framework and double down on it.
Market Summary is the first tab you see when you open the app. This is my morning coffee page - i open it every day before market opens, and sometimes mid-day, to check what’s happening at the market level vs what’s happening under the hood (which is way more important than Nifty closing red or green).
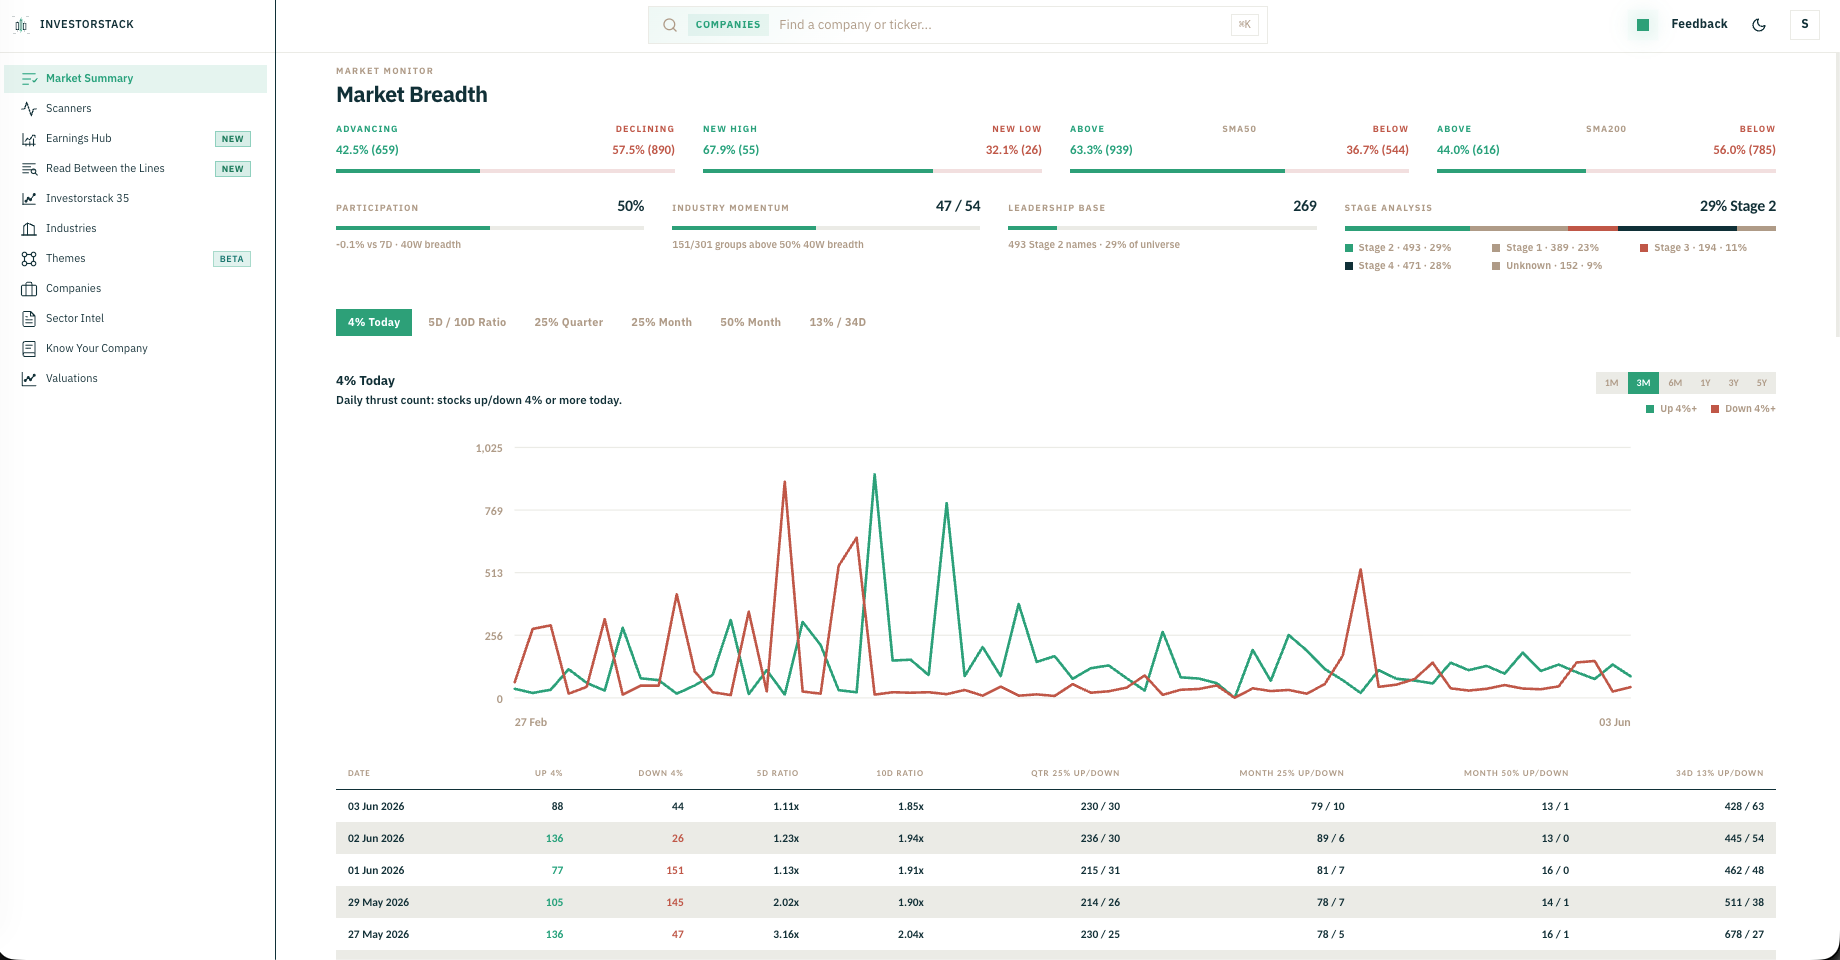
Let me break it down section by section.
First thing u see is the market breadth strip on top, which tells you the actual story of the day - how the markets are really performing.

Advancing vs Declining - How many stocks went up vs down today across the universe (we cover 1700+ stocks).
New High vs New Low - 52w highs vs 52w lows count. When new highs expand you know leadership is firing; when new lows expand you know damage is spreading silently while the index hides it.
Above SMA50 vs Below SMA50 - % of stocks above their 50dma. Short term trend health.
Above SMA200 vs Below SMA200 - Same but 200dma. long term trend health.
Below the strip u get the Market structure snapshot - 4 more cards:
Participation - Average 40 week breadth across the universe + delta vs 7 days ago. This is my are-we-in-a-bull-or-bear-market gauge.
Industry momentum - Count of industries with improving breadth vs weakening, plus how many groups are above 50% 40w breadth (constructive groups)
Leadership base - count of stage 2 + RS 80 companies.
Stage analysis - Distribution of all companies across stage 1, 2, 3, 4 shown as a stacked bar with % in stage 2 highlighted.
Below the cards you get 6 chart tabs - each based on Stockbee’s framework (i shamelessly borrowed his work, all credit to him):
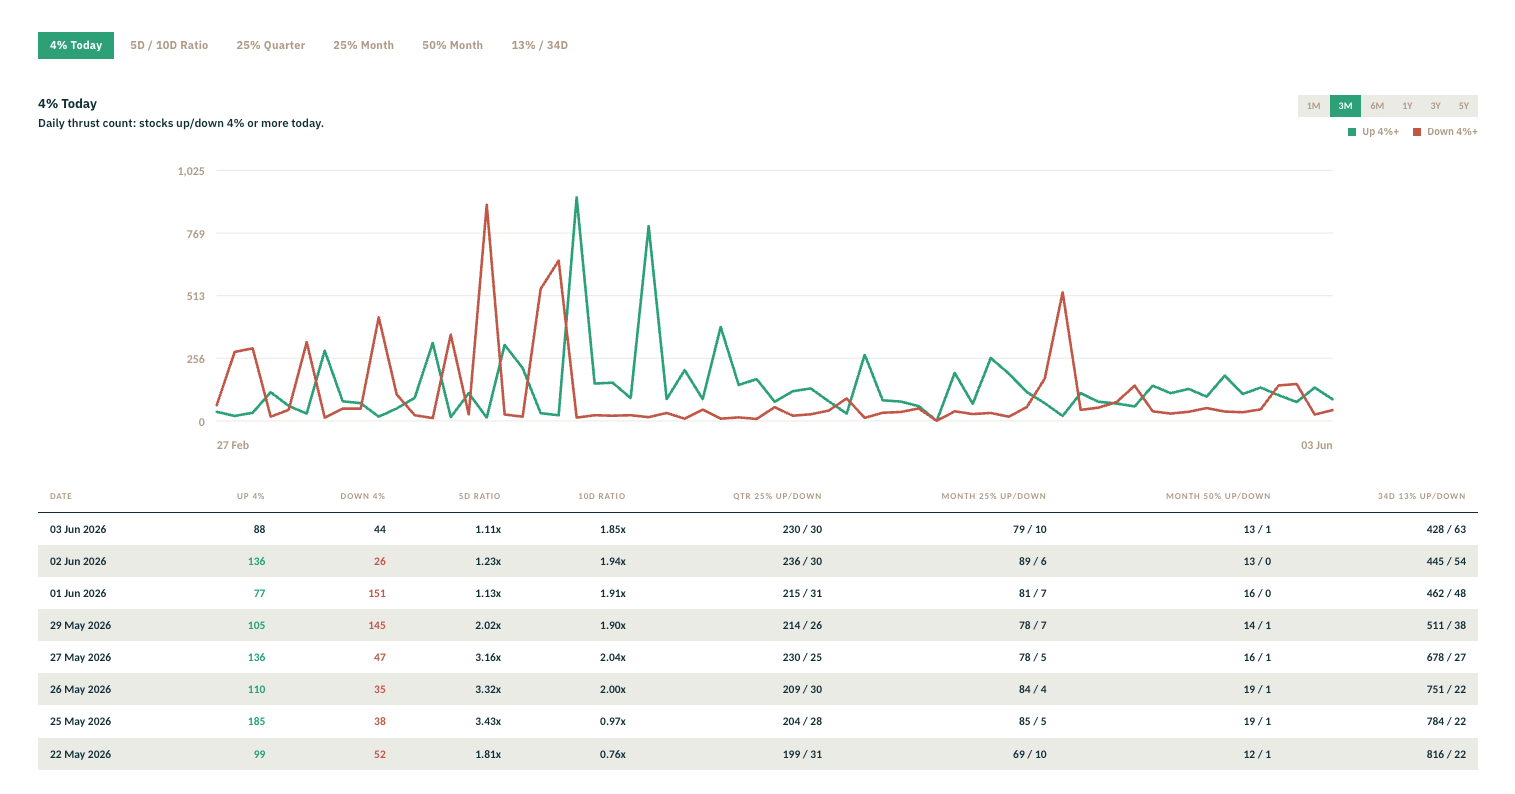
4% Today - Daily count of stocks up/down 4%+ in a single session.
5D / 10D Ratio - Rolling 5d and 10d ratio of 4% up days vs 4% down days.
25% Quarter - Count of stocks up/down 25%+ over a quarter.
25% Month - Same but 1 month.
50% Month - Extreme moves up/down 50% in a month.
13% / 34D - Up/Down 13% over 34 trading days.
Each chart has 6 timeframes: 1M, 3M, 6M, 1Y, 3Y, 5Y - so u can zoom out and see the full cycle. Below the chart is a table of the last 8 sessions - date, up 4%, down 4%, 5d ratio, 10d ratio, qtr 25% up/down, month 25%, month 50%, 34d 13%. This is for people who want the raw numbers without scrolling through a chart.
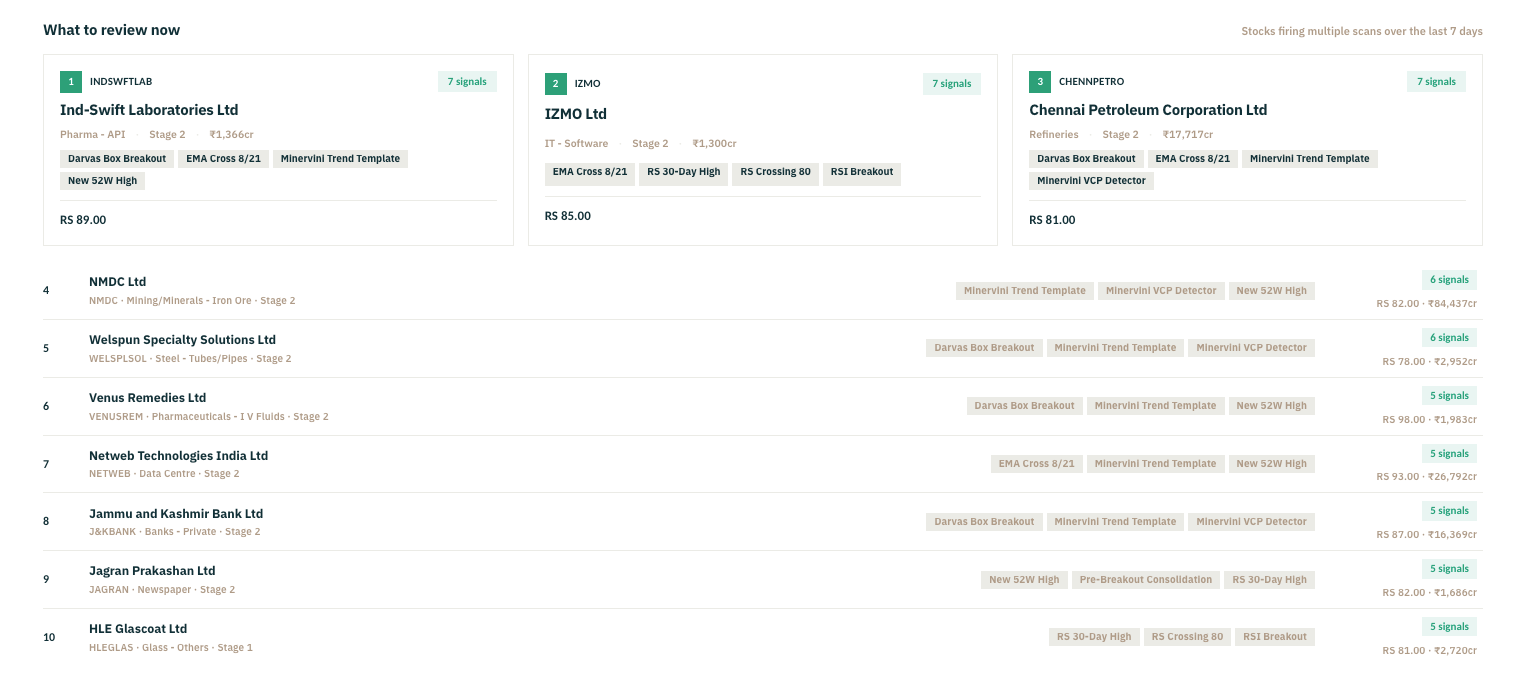
This is honestly my favourite section. It shows stocks that have triggered multiple scanners in the last 7 days. So if a stock shows up in Stage 2 breakout + RS cross 80 + new 52w high + volume thrust - it appears here.
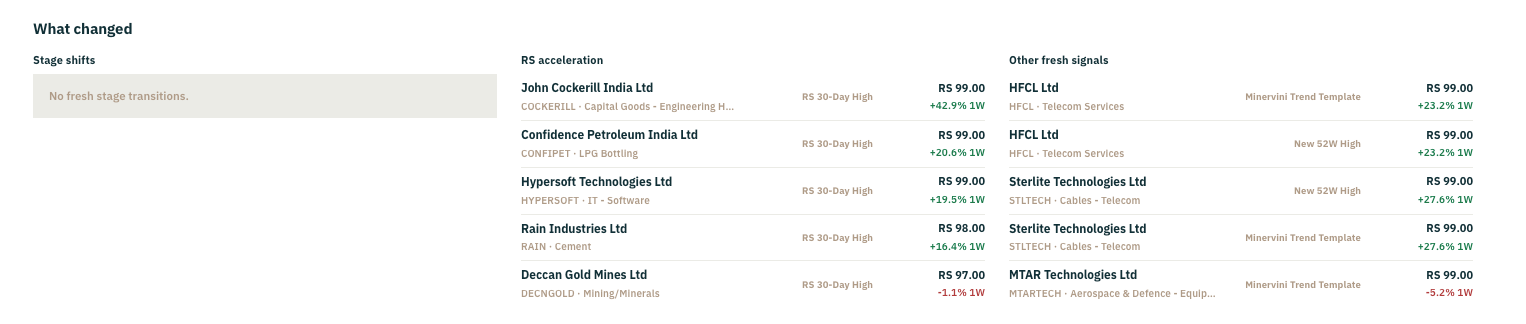
3 columns showing fresh signals from last session - this is the “what moved since yesterday” view:
Stage shifts - Companies that just moved into stage 2 from stage 1, or fell from 2 to 3.
RS acceleration - Companies that just crossed RS 80, or hit a 30 day RS high.
Other fresh signals - Everything else - volume thrusts, base breakouts, no-brainer signals etc.
Each row shows company name, scanner label, RS rating, 1W return. One click takes you to the company page where u get the full deep dive (which i’m covering in a separate section).
This is where i spend most of my day, finding interesting ideas to study. The page is split into 2 categories at the top - Technicals and Fundamentals.
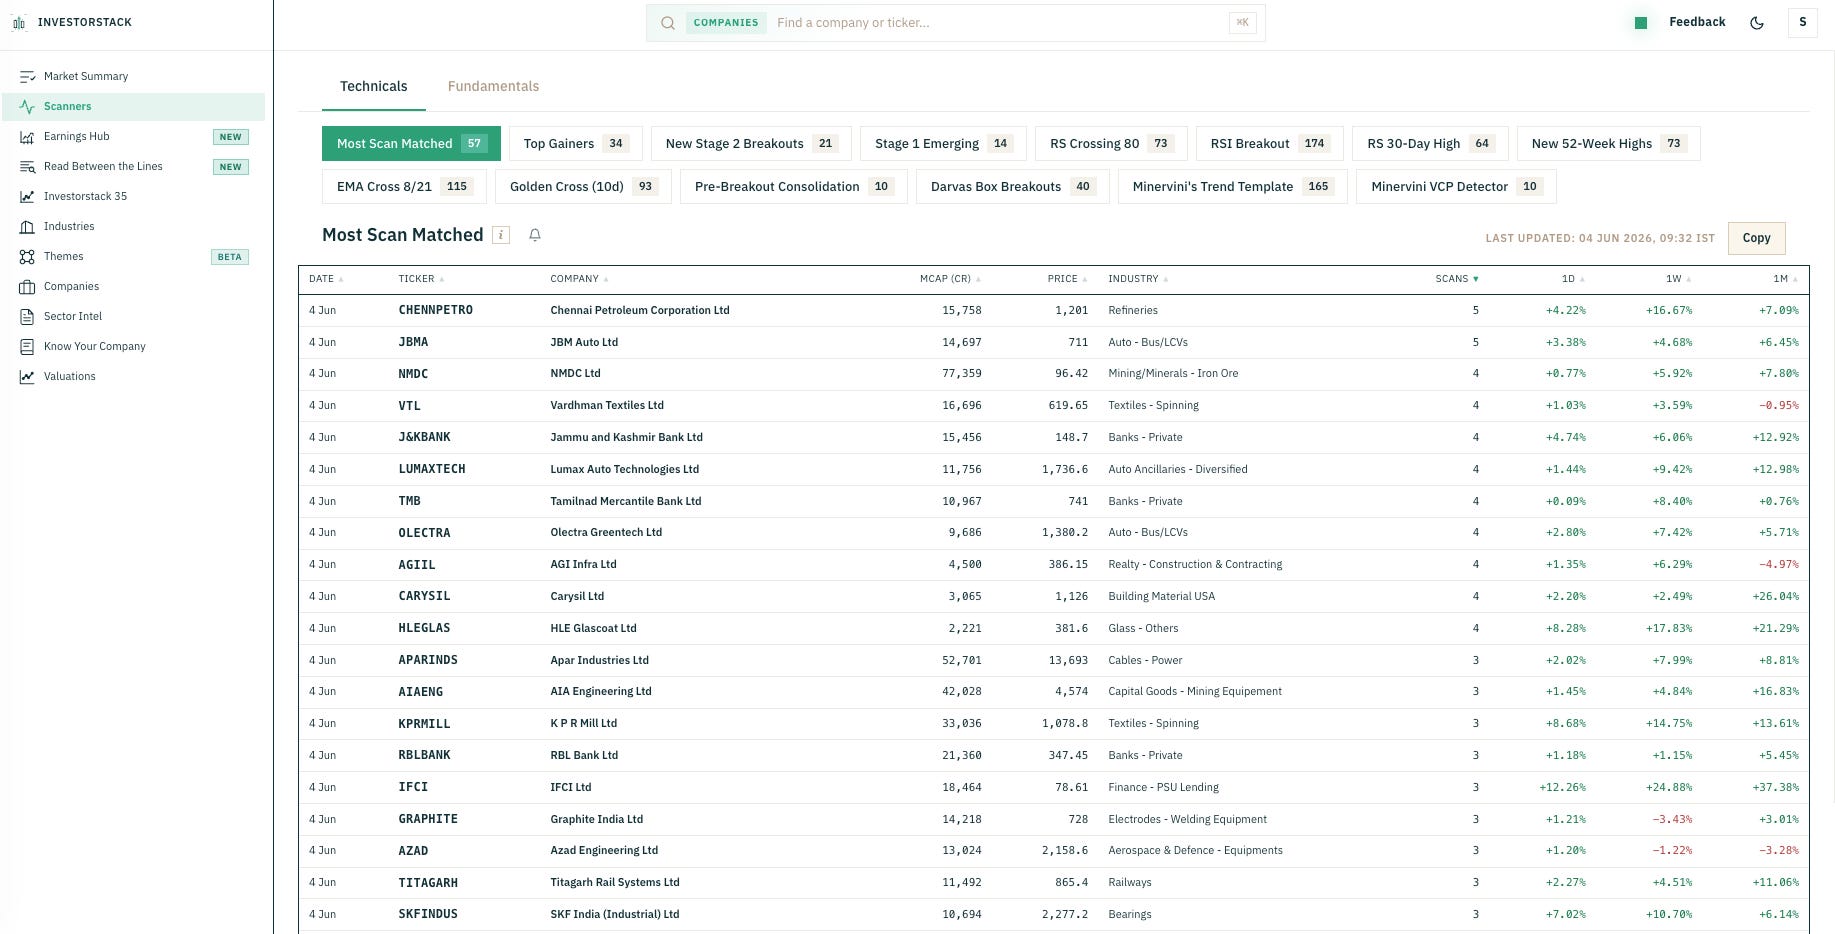
Every scanner has an info popover (the little i icon) that explains exactly what it does + an alert bell so you can get Telegram alerts when a new stock triggers. Alerts is something i personally use a lot.
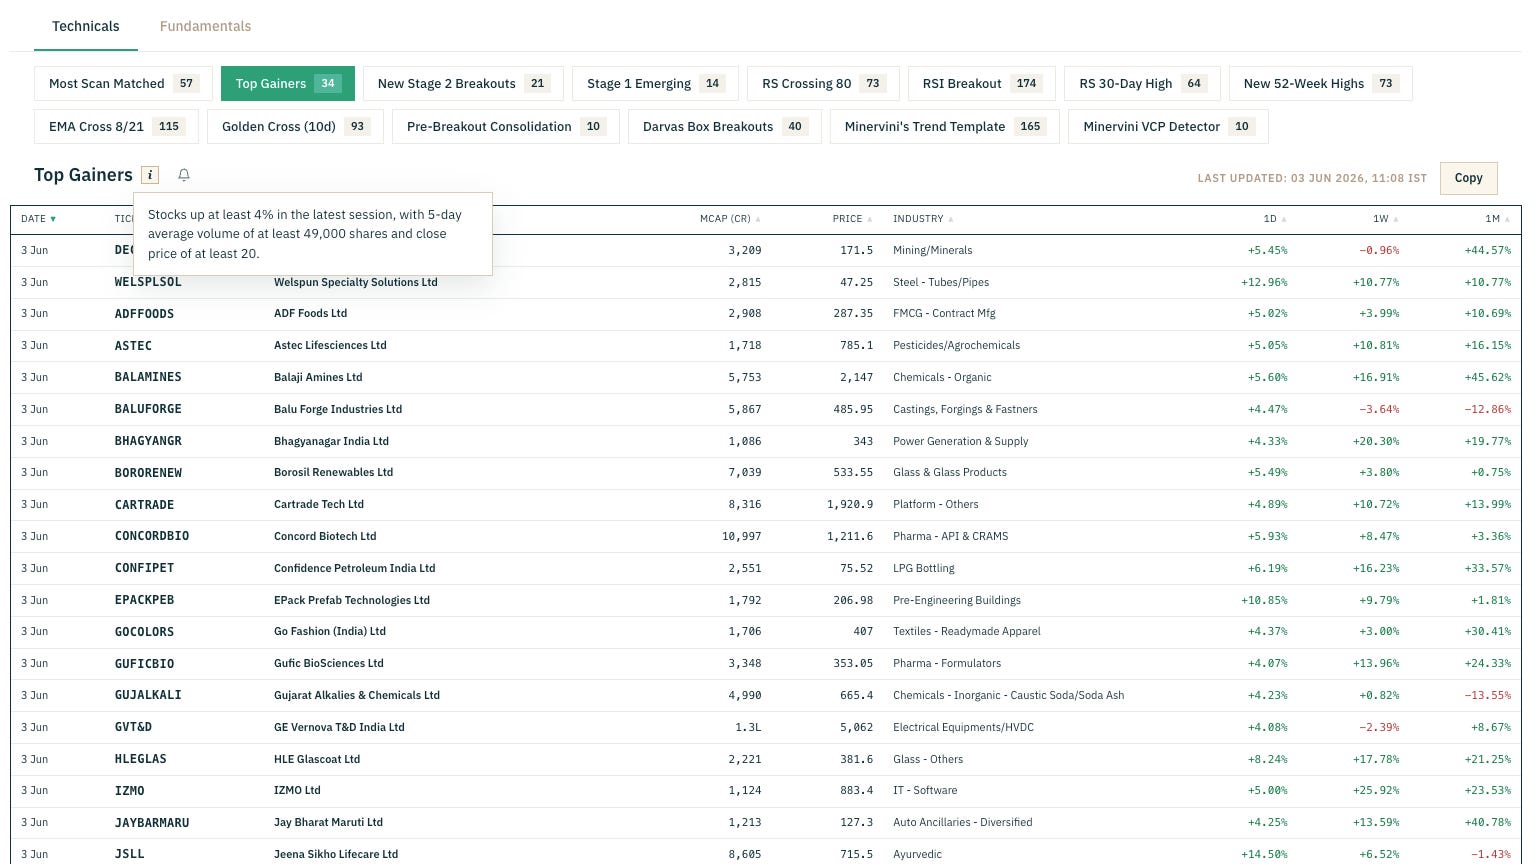
A quick walkthrough of some pre-built scanners we have:
1. Most Scan Matched - Stocks that triggered 3+ different scanners in the recent window.
2. Top Gainers - Stocks up 4%+ today with average volume 50,000.
3. New Stage 2 Breakouts - Stan Weinstein stage analysis. Catches stocks transitioning from stage 1 (basing) to stage 2 (advancing) with relative volume > 1.
4. Stage 1 Emerging - catches stocks shifting from stage 4 (decline) into early stage 1 (basing). Stocks that stopped going down and started flattening near long term moving avg.
5. RS Crossing 80 - Relative strength rating just crossed above 80 (top 20% of universe).
6. RSI Breakout - RSI breaking out of its recent range.
7. RS 30-Day High - Relative strength made a new 30 day high today.
8. New 52-Week Highs - Close at new 52w high.
9. EMA Cross 8/21 - Daily 8 EMA crosses above 21 EMA.
10. Golden Cross (10d) - 50 SMA crossing above 200 SMA, filtered to last 10 candles.
11. Pre-Breakout Consolidation - Stocks near top of 100 day range, tight and consolidating. Some Other Include Darvas Box Breakouts, Minervini’s Trend Template & Minervini VCP Detector.
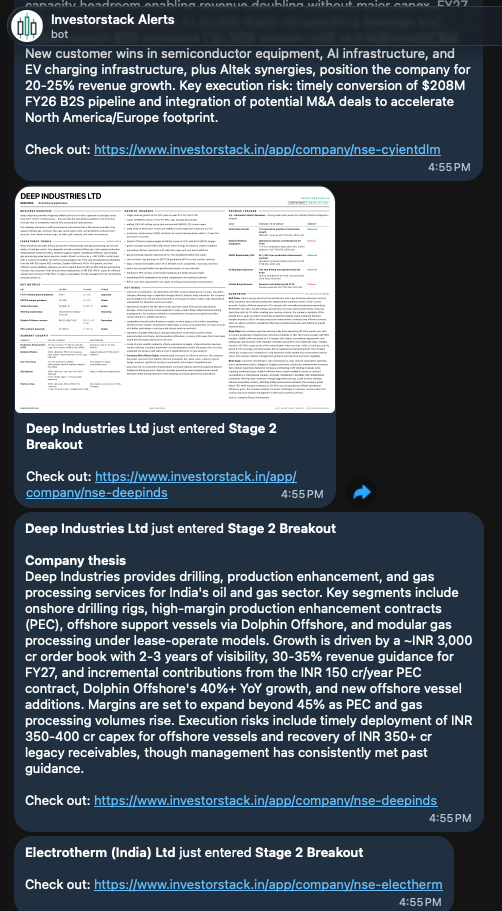
Alerts are an interesting way to use scanners - you get the Company + Thesis + One Pager delivered straight to your Telegram.
Once you’ve filtered the stocks, the Company page comes in handy. This is where you study the business end to end.
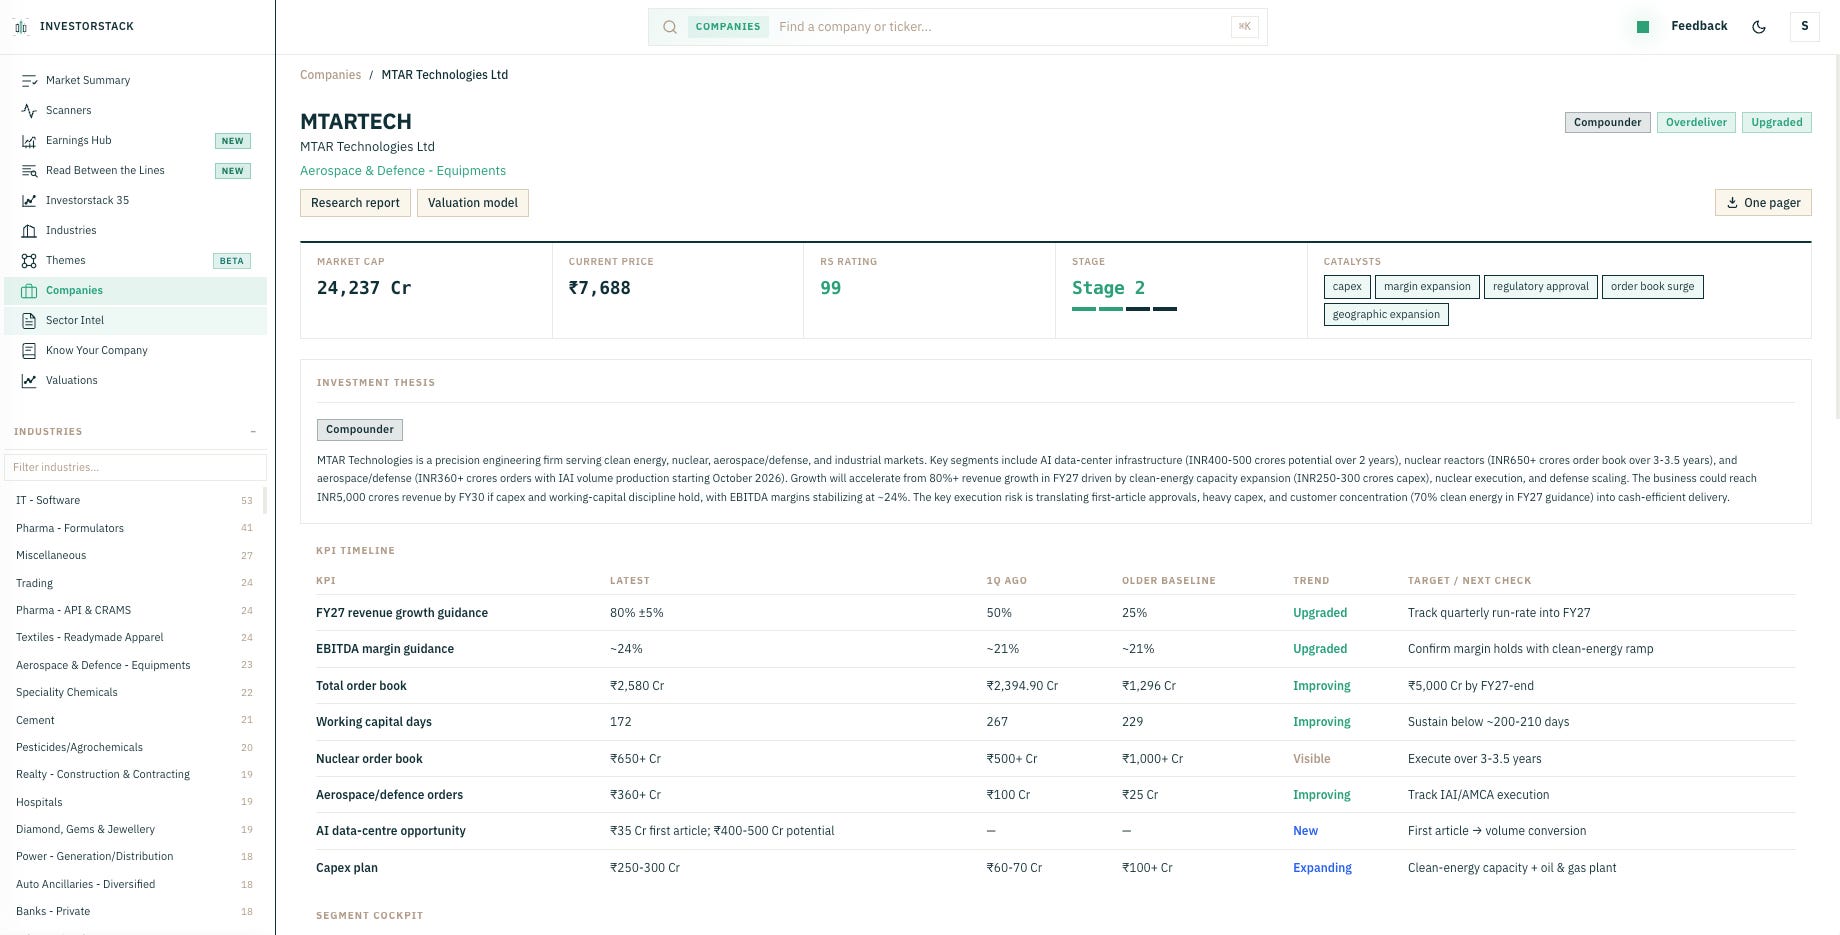
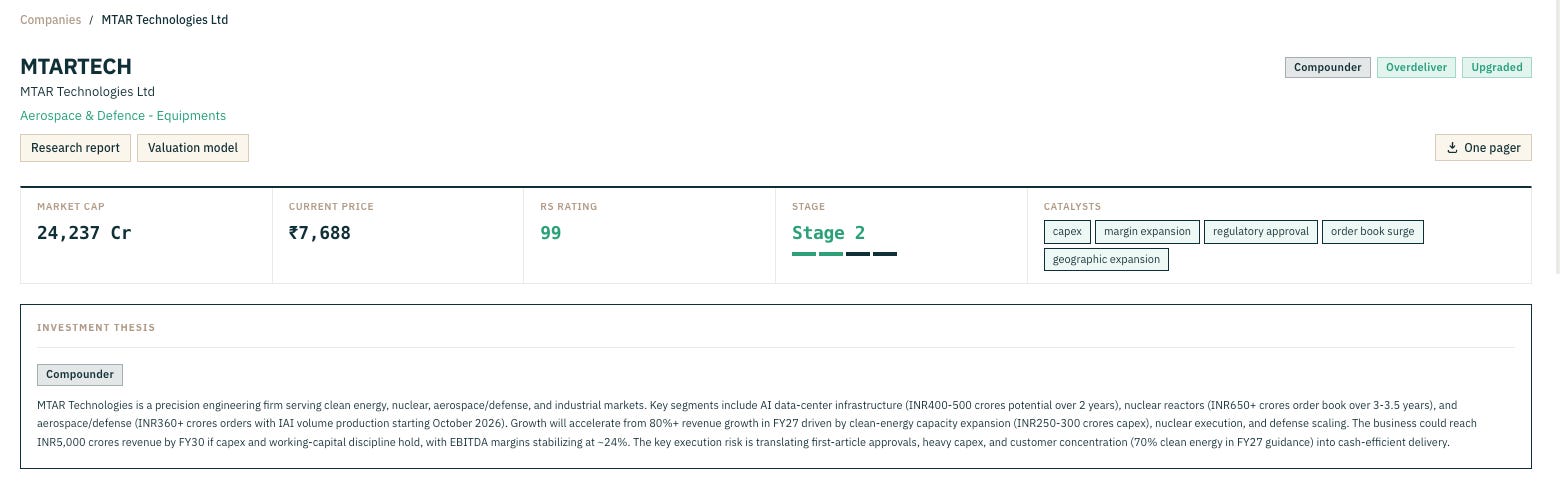
The top of the page shows:
Ticker, company name, industry (click industry to see all peers)
Badges: Thesis type, Management Consistency score, Guidance status (Upgraded / Maintained / Downgraded)
Quick links: Research report, Valuation model, One pager
The investment thesis in one paragraph. A concise 4-5 line explanation of how the business might look 2-3 years out - growth triggers, risks and key catalysts.
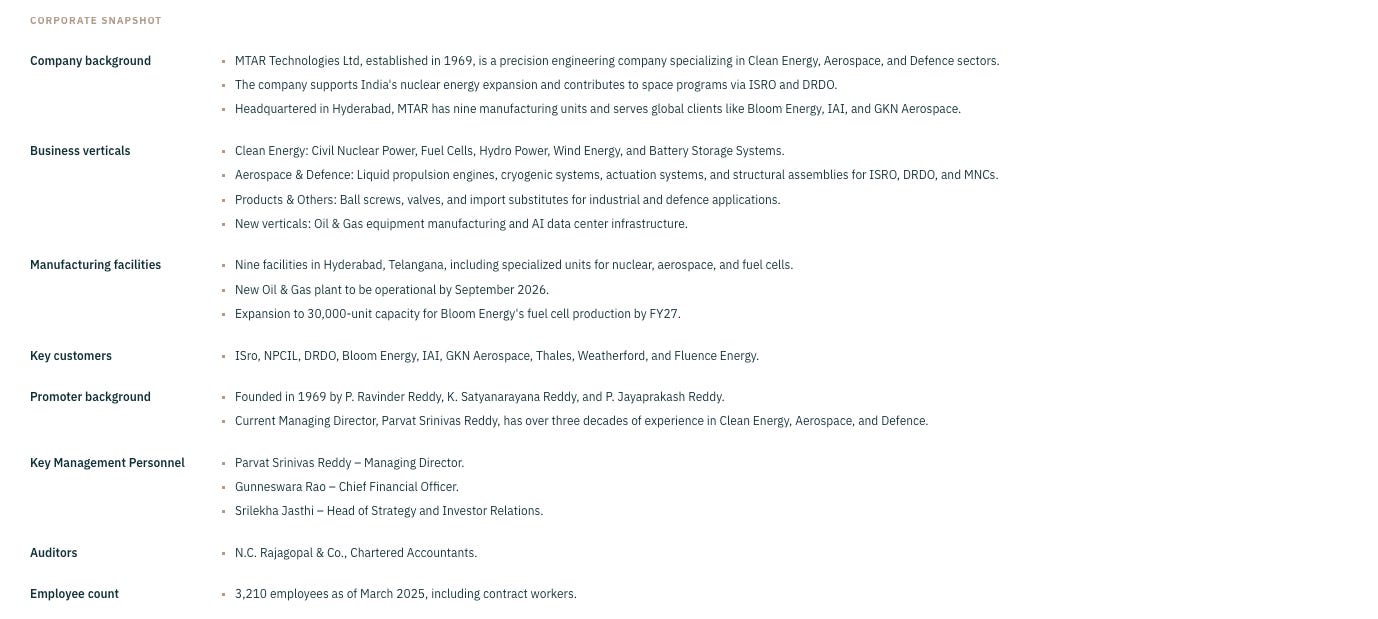
The Corporate Snapshot table covers business model, revenue mix, key customers, geographic spread, capacity, balance sheet etc. - so you get a quick taste of what the company is about.
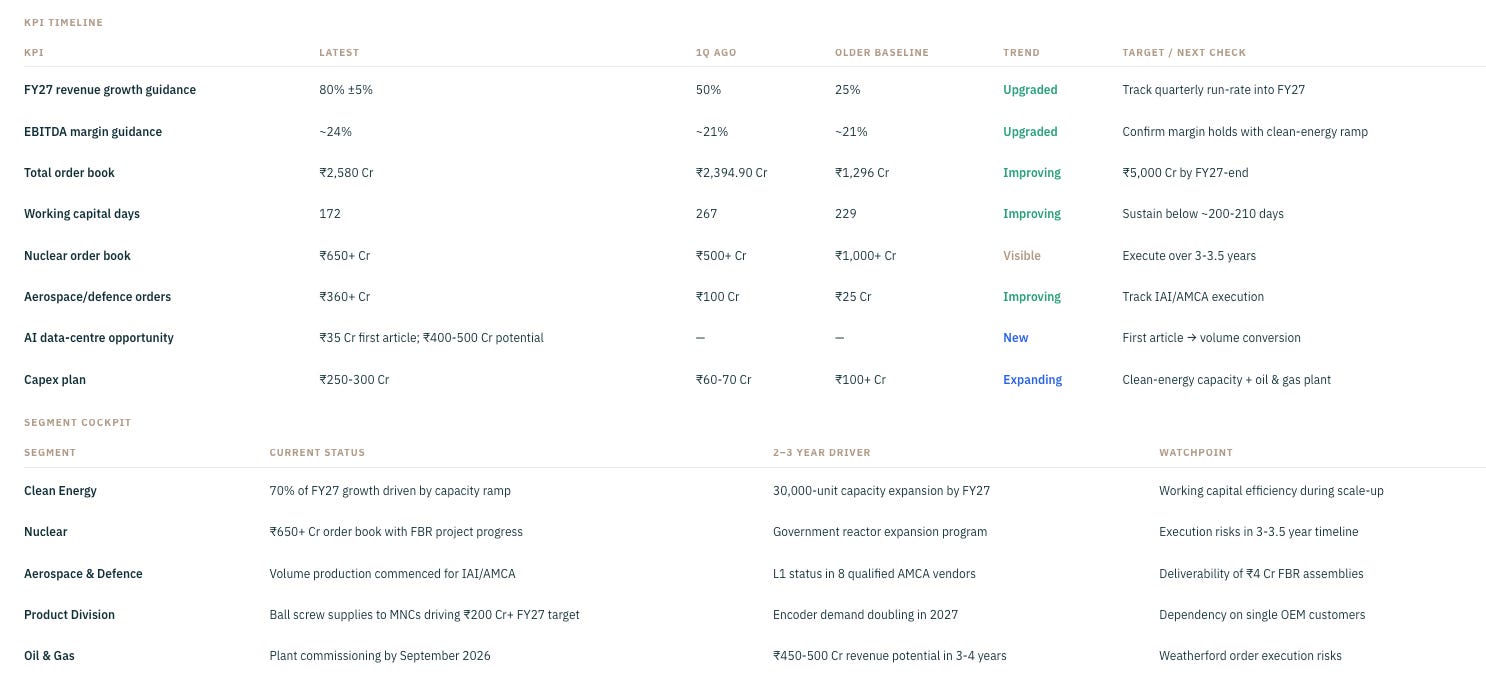
KPI Timeline - the operating metrics that matter for this business: Latest, 1Q ago, Older baseline, Trend, Target / next check.
Segment Cockpit - Each business segment with Current status, 2-3 year driver, Watchpoint.
Promise Tracker - What management said they will do, when they first said it, latest status (achieved / on track / delayed / missed), next check date.
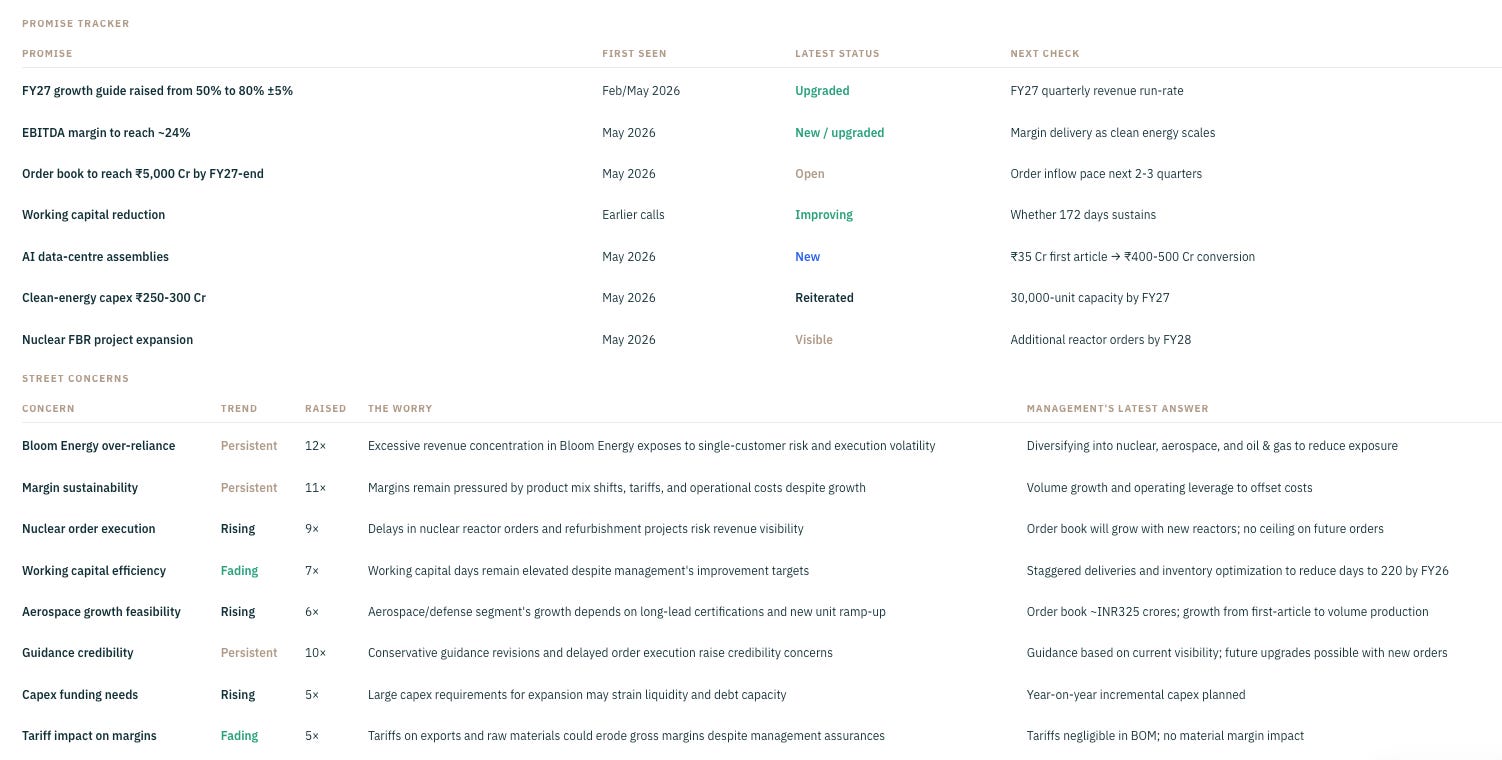
Street Concerns - What analysts are worried about. Concern, trend (rising / steady / fading / resolved), times raised, the worry, management’s latest answer.
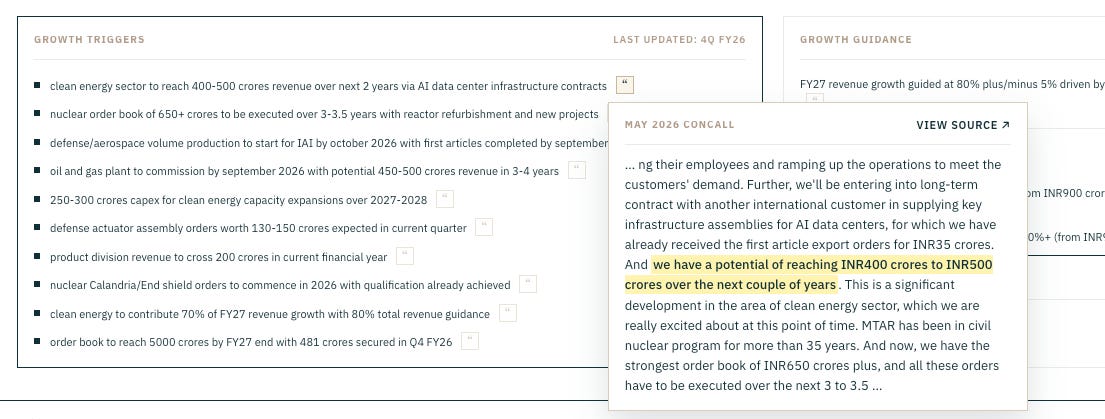
Growth Triggers - bulleted list of forward catalysts pulled from concalls. Each with a citation popover showing the exact concall line + source quarter.
Growth Guidance - Management guidance text + Guidance Monitor with Previous Guidance vs Updated Guidance + Upgraded / Maintained / Downgraded badge.
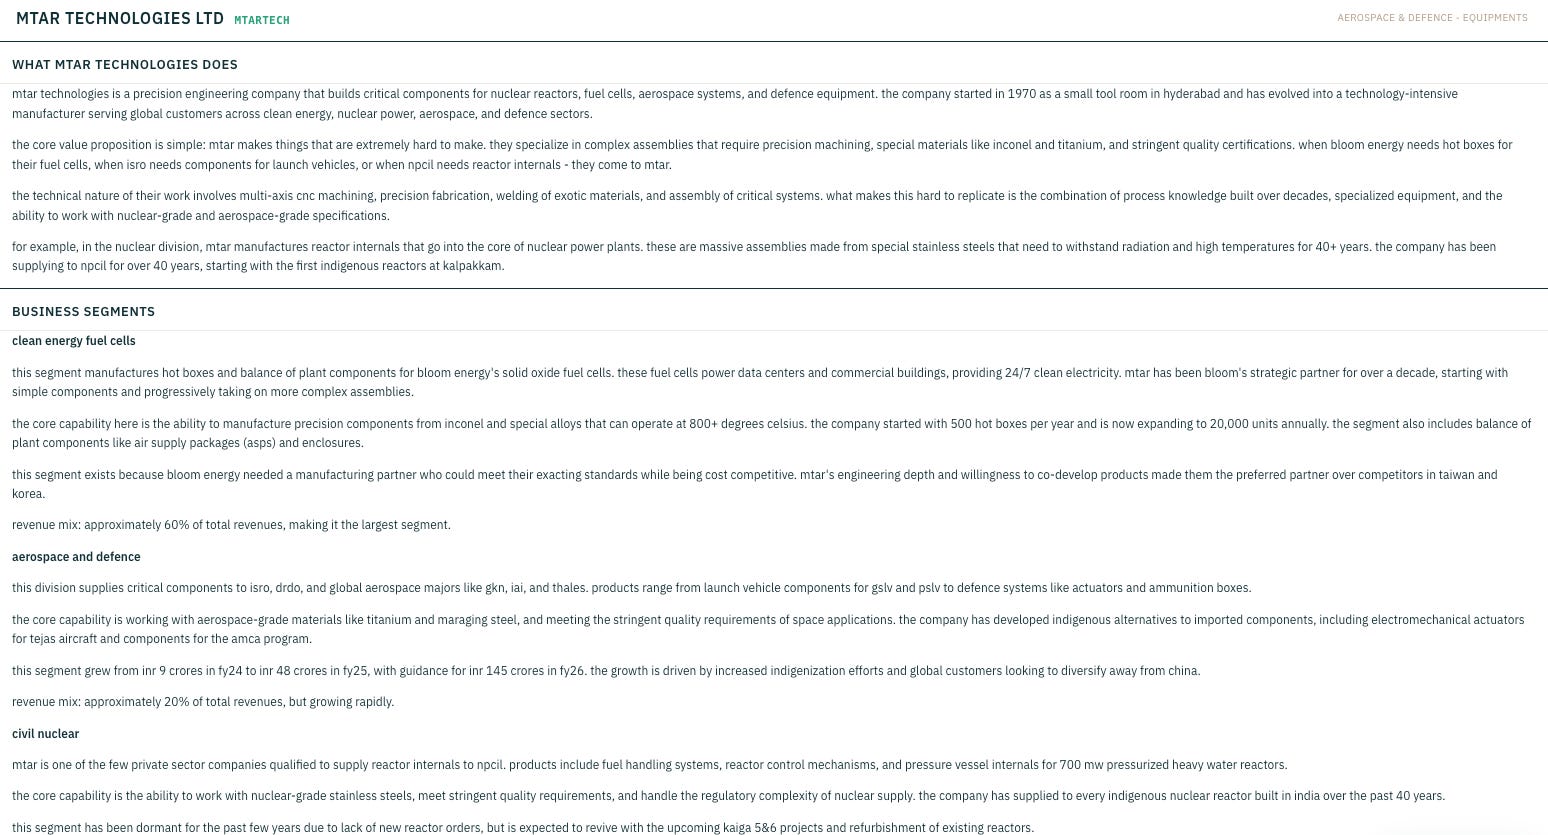
Long form deep research report on the company. Covers business overview, segments, financials, growth triggers, walk the talk, valuations, Bull, base scenarios.
Two interactive trackers embedded inside the report:
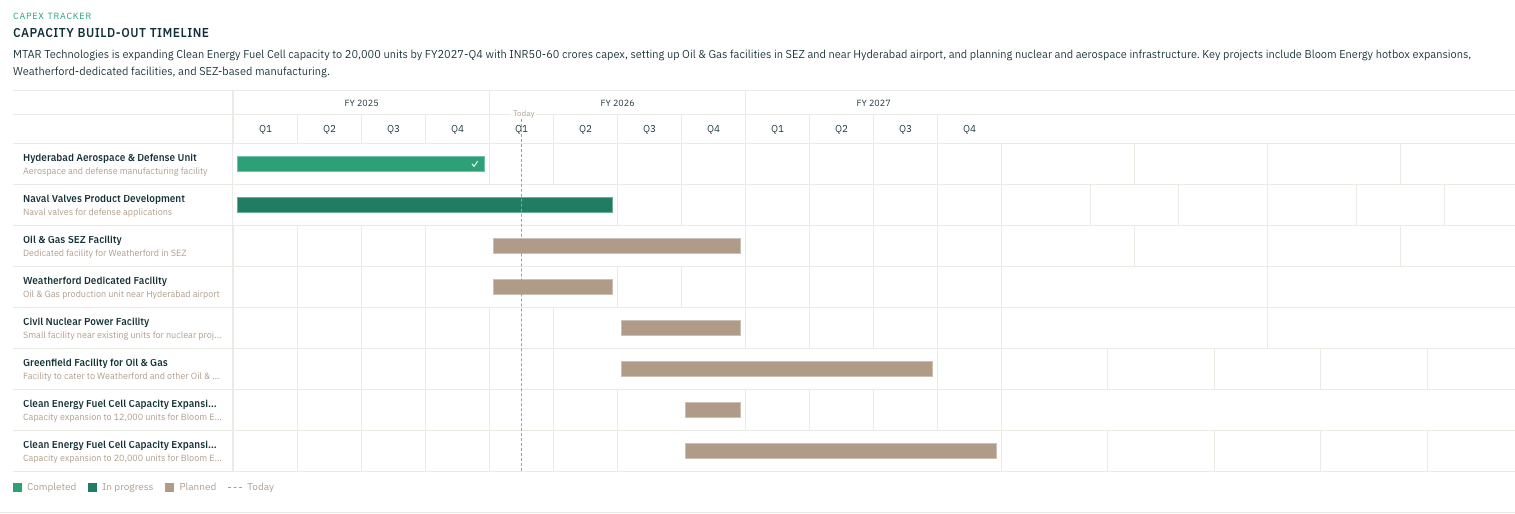
Capex Tracker - Timeline view of every capex project by fiscal quarter. Status (planned / in-progress / completed / delayed), capacity, capex amount, expected commissioning quarter.
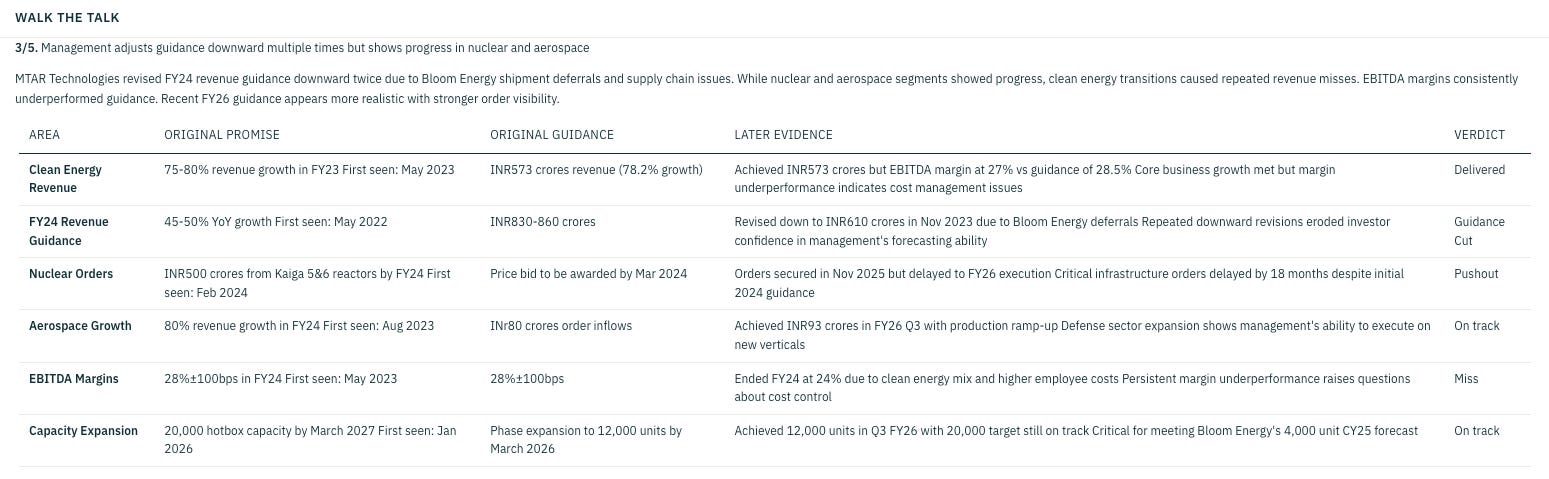
Walk the Talk - Scores management 0/5 to 5/5 on delivery. Table: Area, Original promise, Original guidance, Later evidence, Verdict.
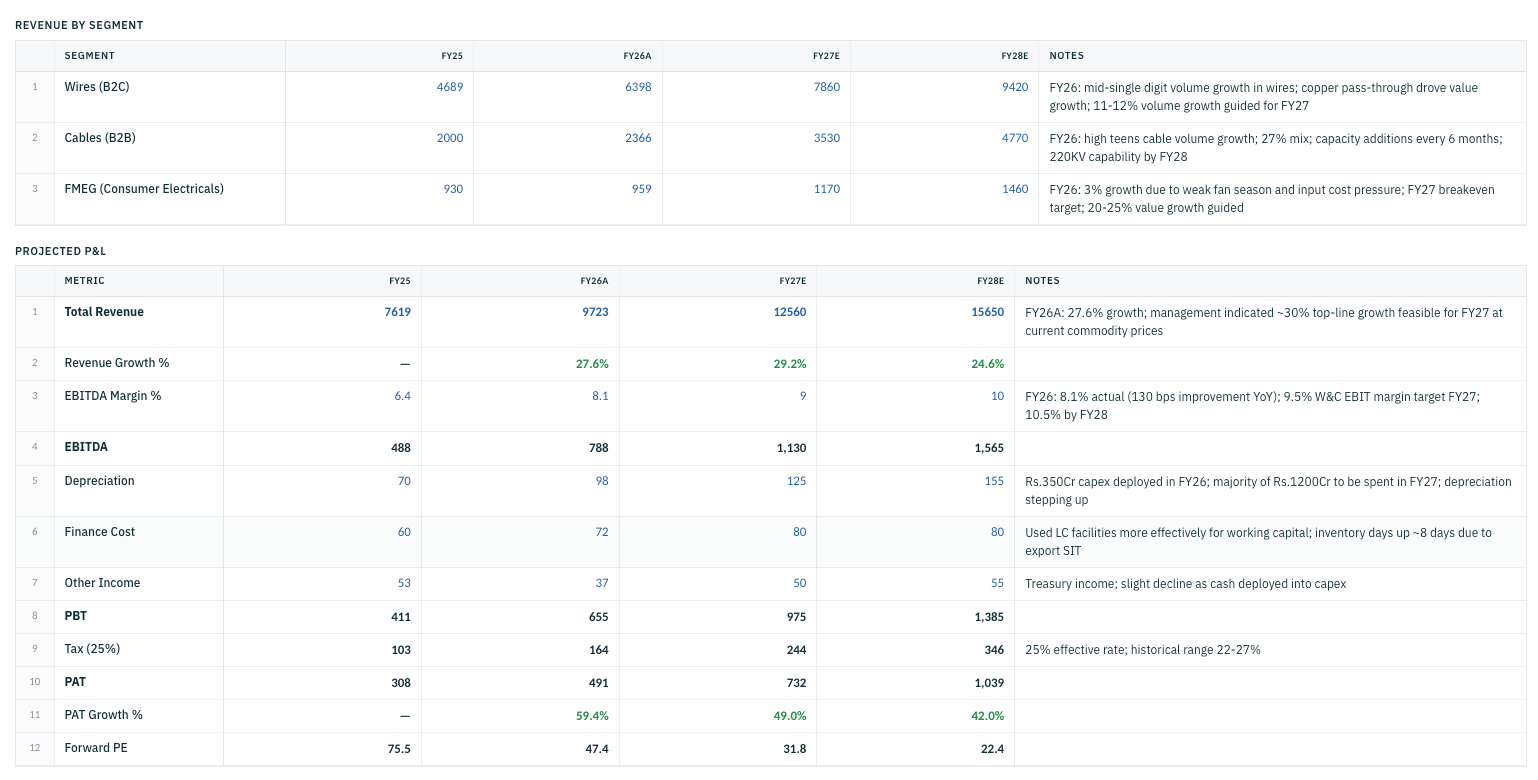
3 year forward valuation model. One of the most Interesting & Insightful part of Investorstack.
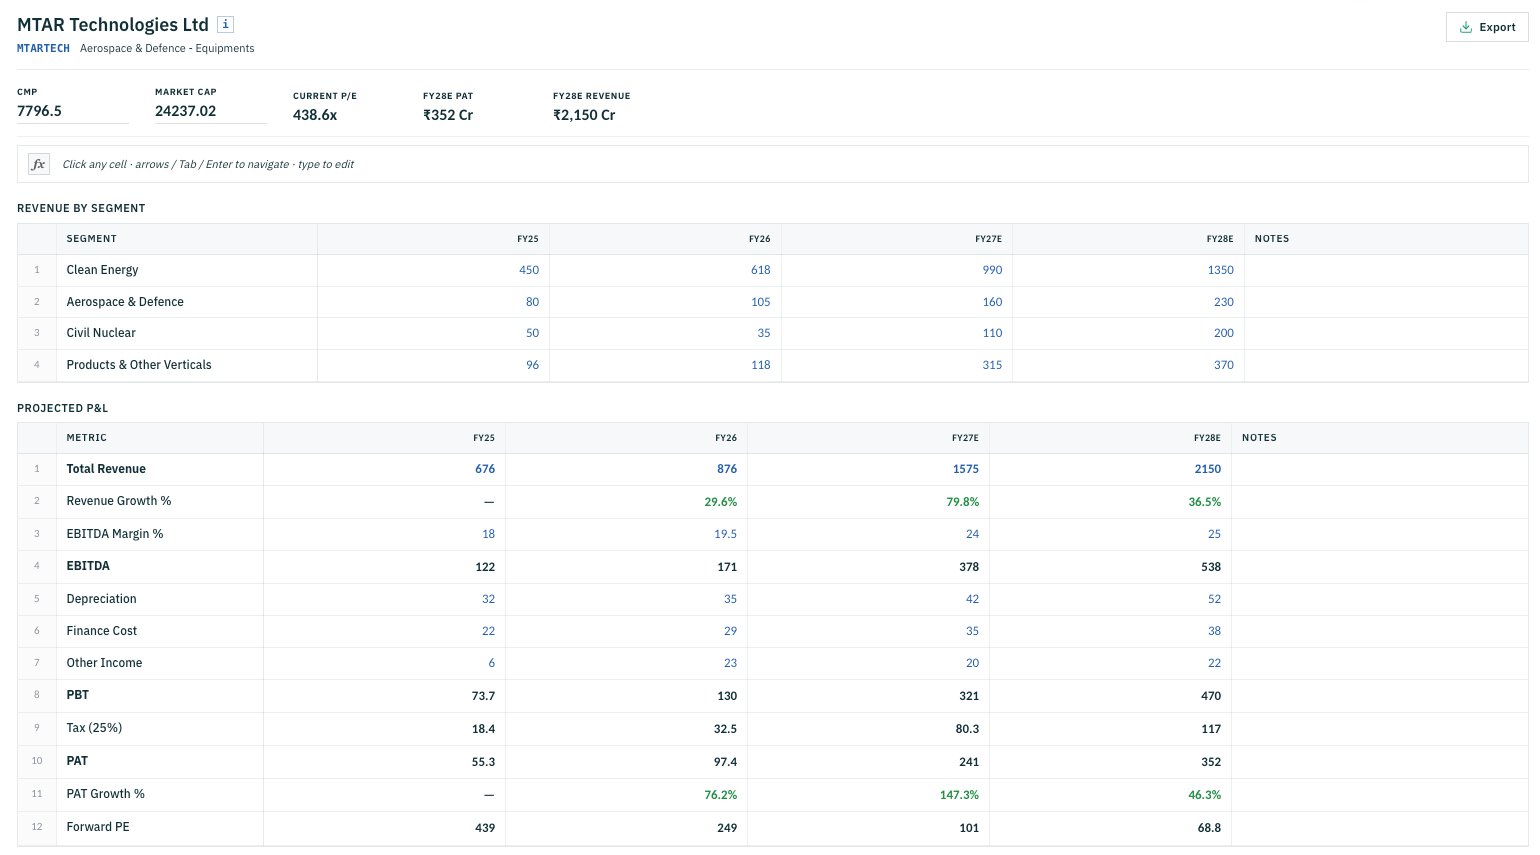
3 tables below:
Revenue by Segment - segment-wise FY26 to FY28 revenue projections + Notes. Every cell is editable - change a segment growth assumption and everything downstream recalculates.
Projected P&L - full P&L lines (Revenue, EBITDA, margin, Depreciation, EBIT, Interest, Tax, PAT, EPS) projected to FY28. Editable cells for growth assumptions, formula cells lock the derived ones.
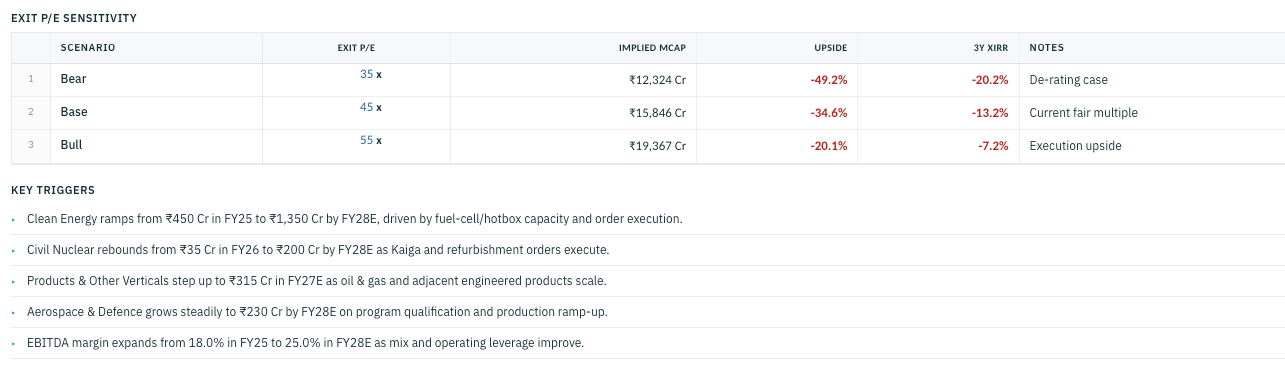
Exit P/E Sensitivity - Bear / Base / Bull / Blue Sky scenarios with Exit P/E, Implied Market Cap, Upside %, 3Y XIRR. Change exit P/E and upside + XIRR recompute live.
To summarise - we started with the broader market lens, narrowed it down through scanners to surface high quality setups, and once a stock made the cut we dissected it on the Company page: Thesis, Snapshot, KPI Tracker, Research Report, Growth Triggers, and the Valuation Model.
This is a very fun & interesting way to Read Concalls. Each Company has 10-15 Key Quotes + Commentary on Guidance, Order Book, Demand, Capacity, Margin, Pricing, Working Capital, Capex, Exports, New Product, Regulation, Consolidation, Risk, Raw Material.
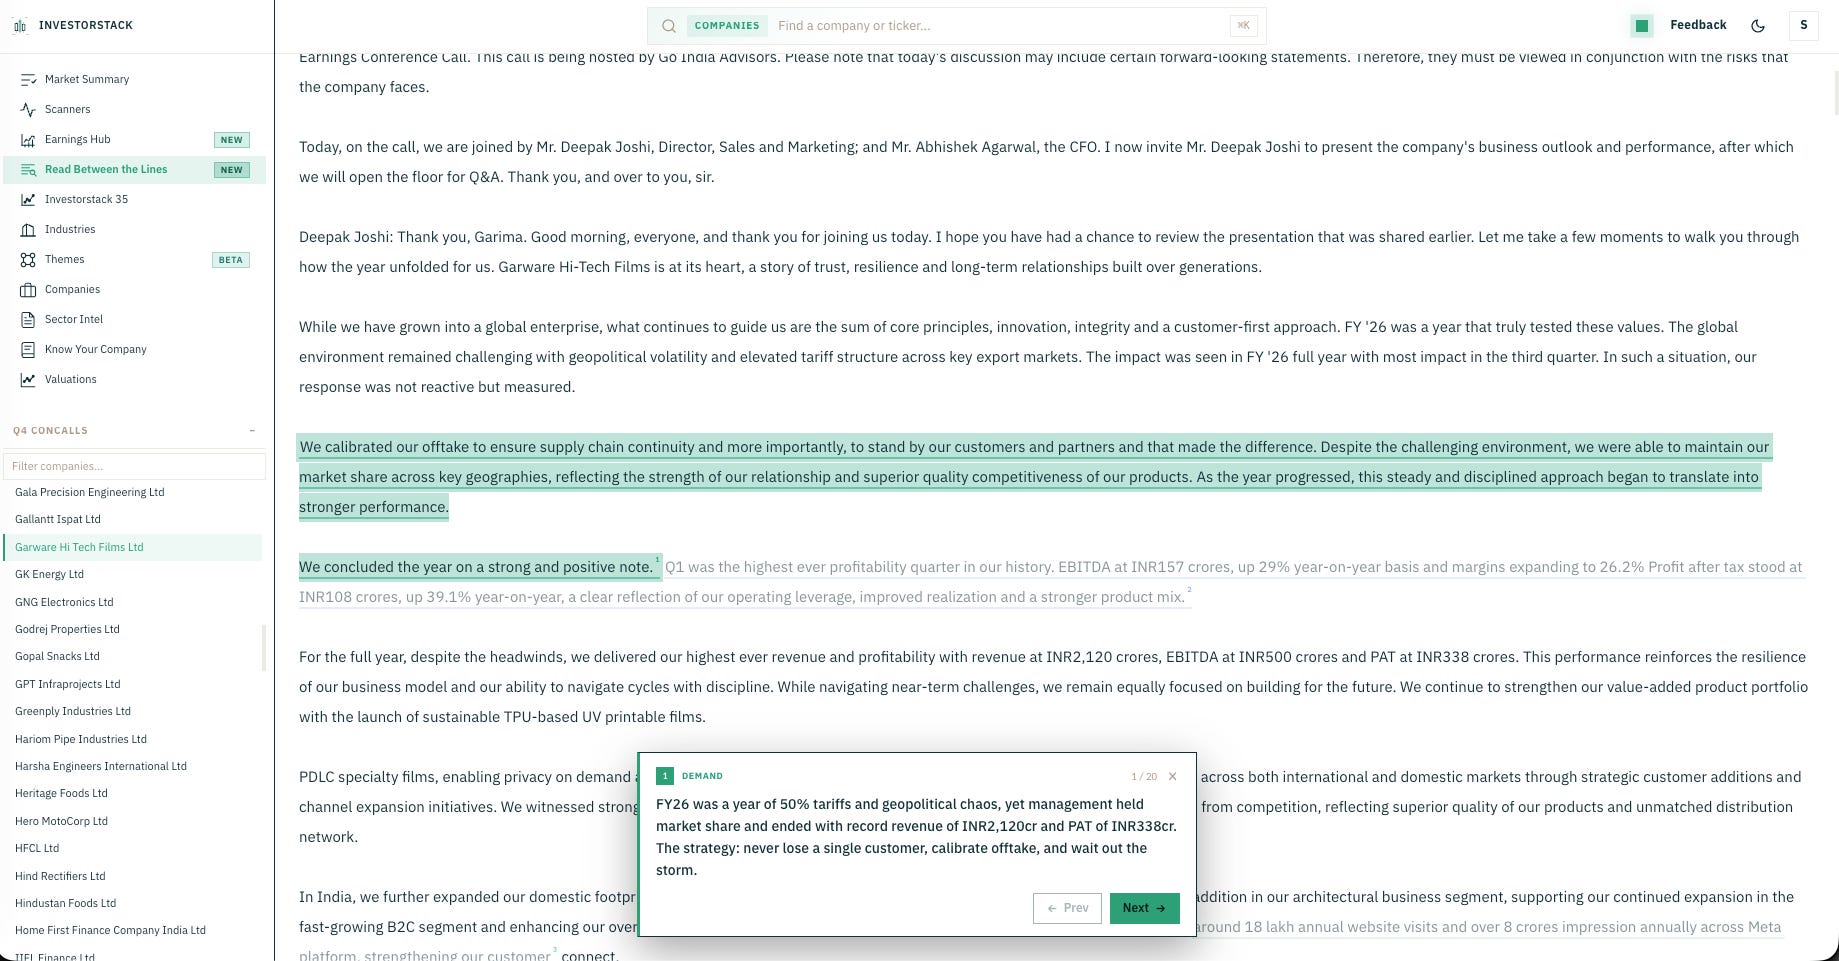
Hit the Read between the lines button and a guided tour walks you through each highlighted quote one by one - tag, caption, and the paragraph in context.
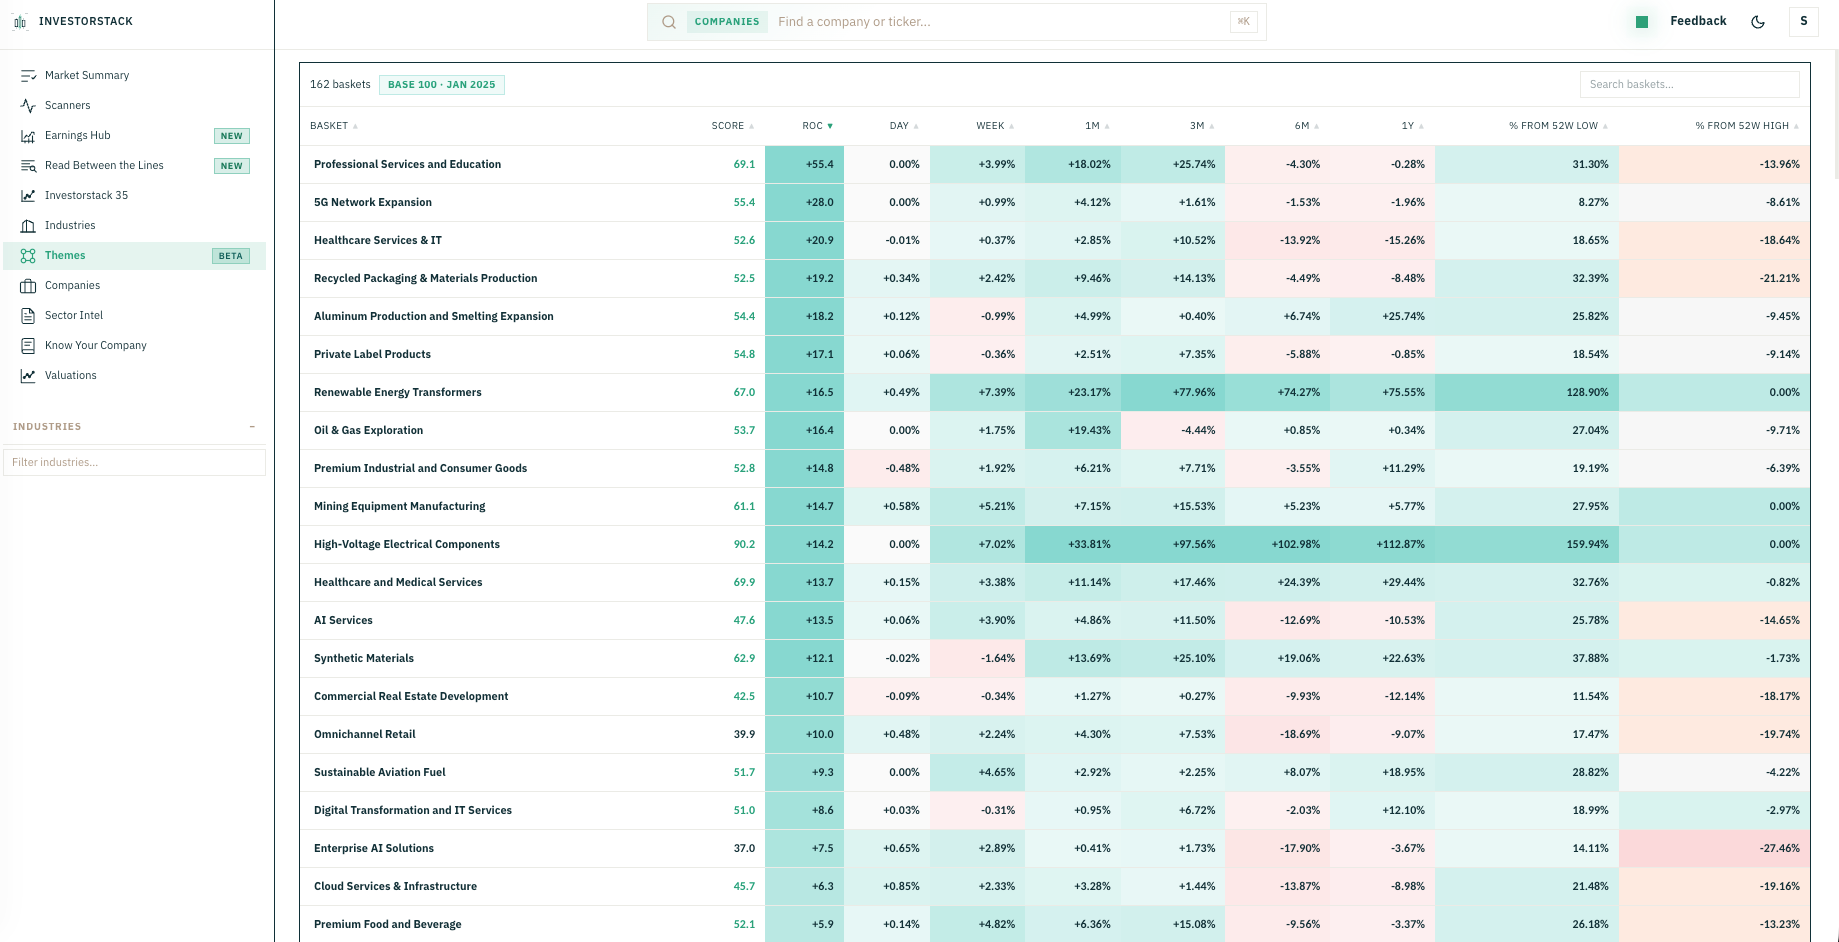
Themes is the thematic baskets layer - curated buckets like Defence, EV, AI Infra, Solar, Specialty Chemicals etc. All baskets sorted by composite score, with EMA score, RS score, and 1M return on display.
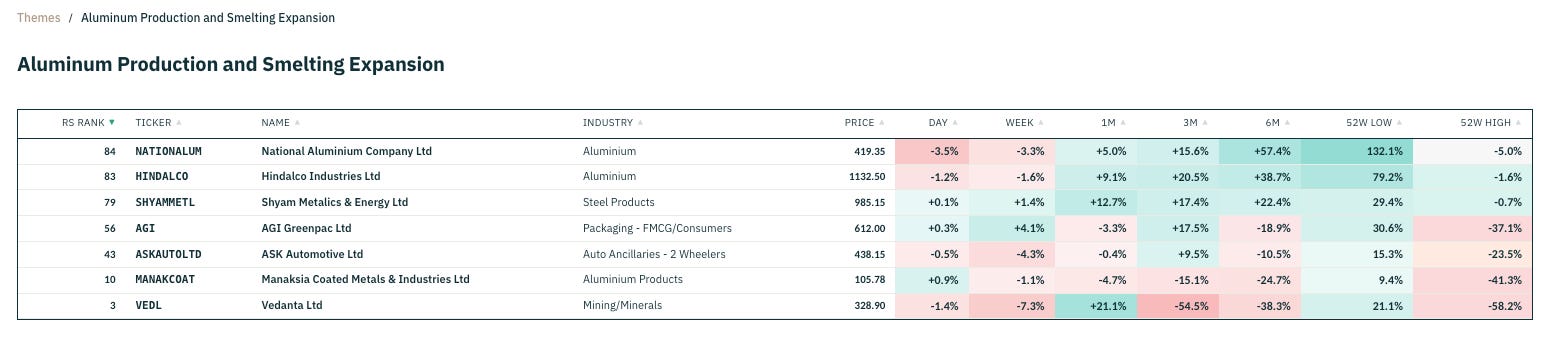
Click any basket to see its stocks table - every constituent with a returns heatmap across 1D / 1W / 1M / 3M / 6M, plus % from 52W low and 52W high.
Honestly there’s a lot more i could walk you through, but the best way to experience Investorstack is to actually use it. My conviction is in the next 2-3 years, every serious investor will be leaning on a tool like this to make sense of the markets.
AI agents, watchlists, and a long roadmap of features are already lined up. I’m firmly in the camp of keeping the product genuinely affordable, but the value already shipped is wildly asymmetric to the price - and a price revision is going live next week. So if you’ve been on the fence about joining or renewing, this week is the right window. For any feedback, ping me on Twitter.
No posts
Comments
Nothing yet. Say the first thing.
Sign in to join the conversation.