
Hey, before we get to today’s newsletter, here’s a quick update.
Our aim at Zerodha Varsity is to make financial education simple and accessible. Apart from writing these newsletters, we also conduct free bootcamps, workshops, and online sessions across topics such as stock markets, trading, macroeconomics, and personal finance.
If you haven’t explored them yet, you can check out our online sessions here and upcoming events here.
Just like people living in the same neighborhood, stocks develop relationships. Some move together, some move in opposite directions, and others are connected through long chains of events that stretch across the globe.
In the markets, these relationships can be positive, negative, or almost non-existent. They are shaped by forces we see every day: a jump in crude oil prices, the arrival of the monsoon, a move in the Rupee, or sometimes by connections that seem completely unrelated at first glance.
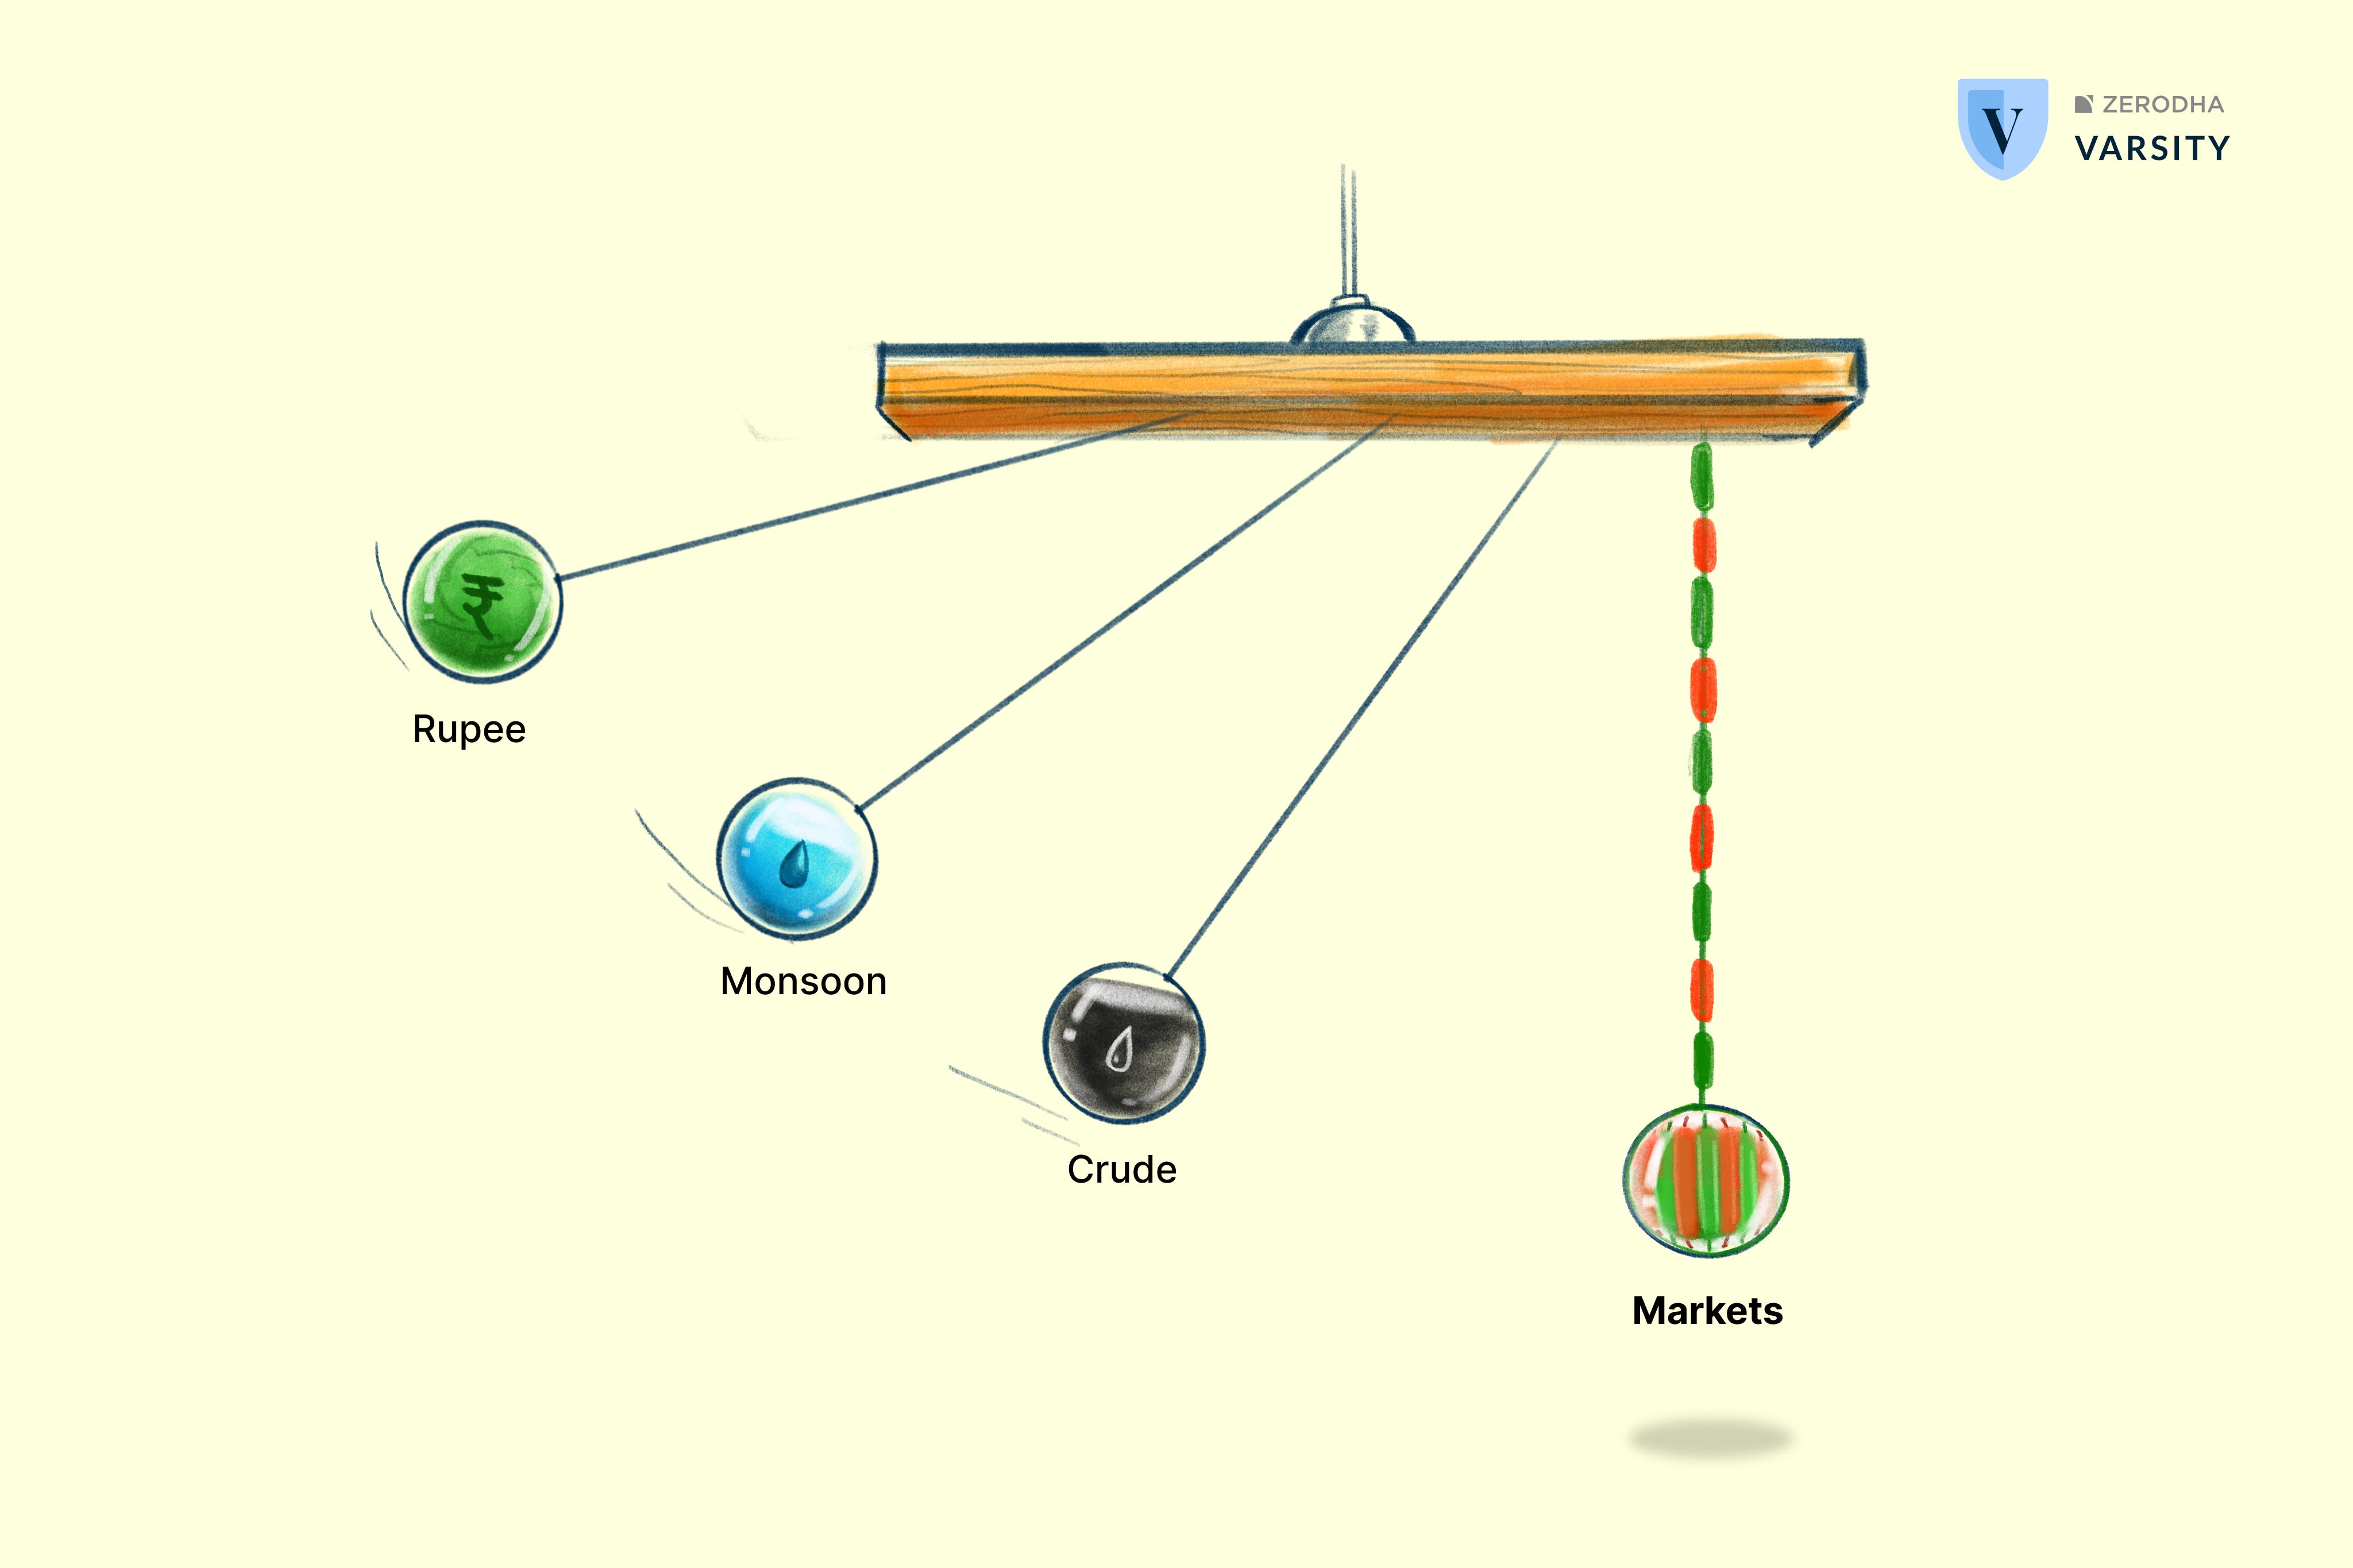
The remarkable part is that these relationships can be measured. Traders, analysts, and algorithms do it all the time. But many overlook a quiet mathematical trap that can make a weak relationship look strong, or hide one that truly exists.
This week, we explore how these invisible connections shape the markets, and the hidden bias you need to understand before trusting any correlation.
The year 2026 began with global markets on edge. An AI-led investment boom drew capital away from emerging markets, while conflicts in the Middle East disrupted shipping through the Strait of Hormuz, the narrow passage that carries nearly one-fifth of the world’s oil trade. The result was a sharp rise in crude oil prices that spread quickly through energy-dependent economies across Asia.
For India, a major importer of crude, the impact extended beyond the energy sector. Higher fuel and raw material costs affected businesses differently, creating clear patterns across the stock market.
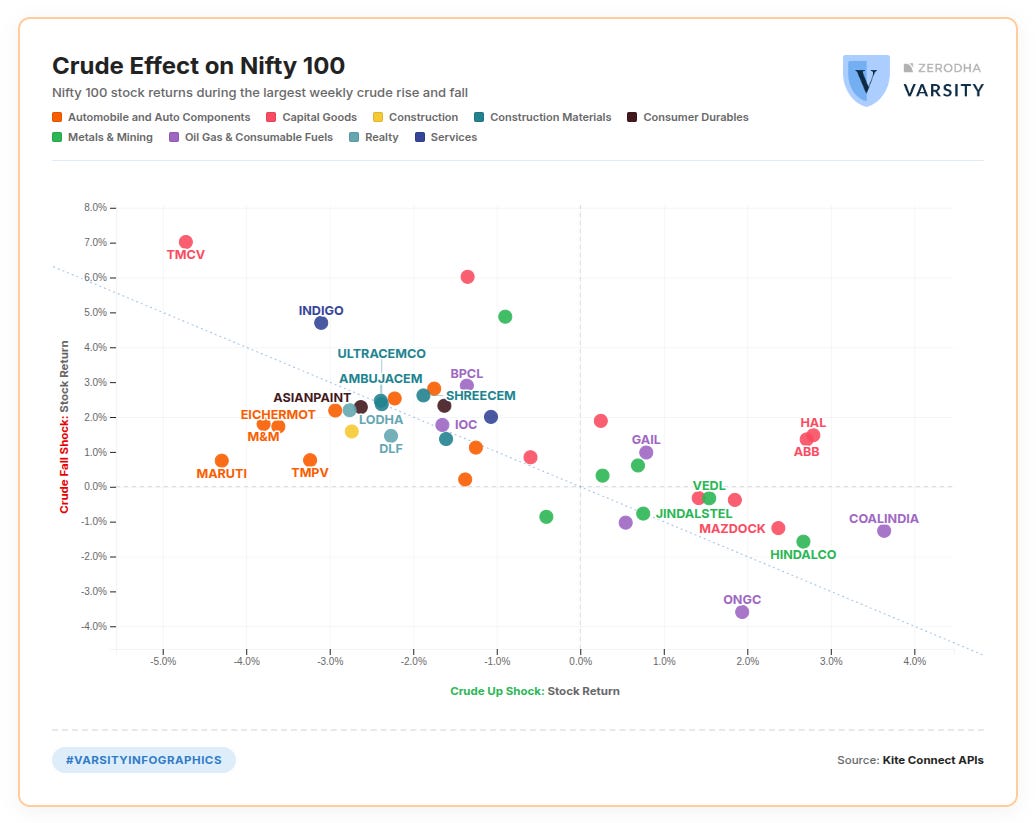
The chart above compares how Nifty 100 stocks performed during the largest weekly rise and largest weekly fall in crude prices. Automobile stocks grouped on the left, falling sharply as crude prices rose but showing a much weaker recovery when prices fell. Airlines, cement companies and oil marketing firms such as IOC and BPCL reacted more positively to falling crude, reflecting the benefit of lower fuel and energy costs. Commodity and energy companies, including ONGC, GAIL and Coal India, largely moved in the opposite direction, strengthening as crude prices rose.
While capital goods stocks also appear at the extremes, crude was not the only force driving markets in 2026. Heavy FII outflows, a weakening rupee and company-specific developments were influencing prices at the same time. A chart may show two assets moving together, but understanding whether that relationship is meaningful requires looking beyond the price movements.
Markets are shaped by the participants who operate in them every day. Some move prices by buying and selling shares. Others influence the flow of money through the economy by affecting interest rates, liquidity and the value of the rupee. Two of the most important are the Reserve Bank of India (RBI) and Foreign Portfolio Investors (FPIs).
Unlike crude oil, the rupee affects markets through the movement of money. Every day, importers, exporters, banks, foreign investors and the RBI buy and sell dollars. These transactions decide the USD/INR exchange rate, one of the most closely watched numbers in the country.
The RBI does not try to keep the rupee at one fixed level. But when the currency moves too sharply, it often steps in by buying or selling dollars from its foreign exchange reserves. Think of it as trying to smooth the ride rather than stop the movement altogether.
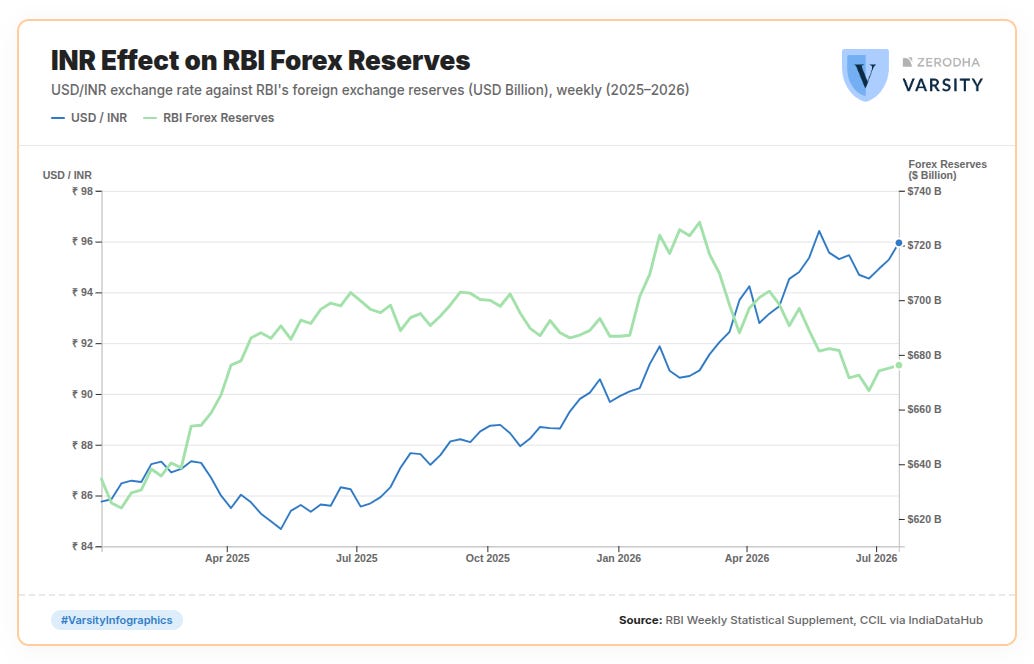
The chart above compares the USD/INR exchange rate with India’s forex reserves. For most of the year, the reserves stayed fairly steady even as the rupee moved gradually. But once the rupee weakened beyond ₹92 per US dollar, the RBI stepped in more often. That meant selling dollars into the market, and we can see a quick dip in the country’s forex reserves.
The exchange rate also matters to Foreign Portfolio Investors (FPIs). Imagine a foreign investor earns 10% in the Indian market. If the rupee weakens over the same period, part of that return disappears when the money is converted back into dollars. That makes Indian markets less attractive, even if stock prices have done well.
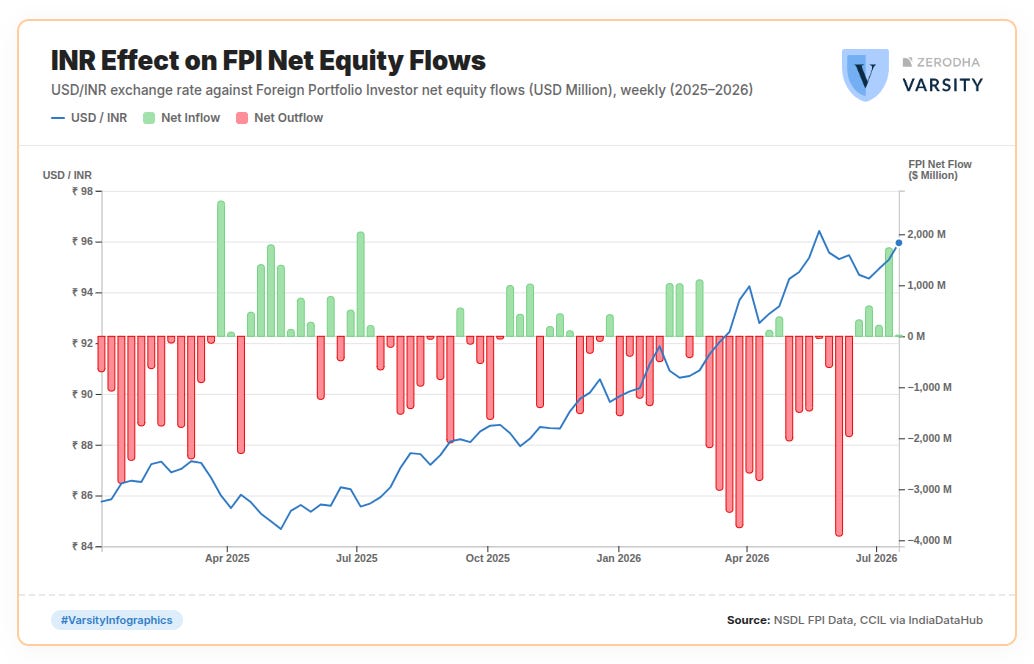
The chart above shows this relationship. As the rupee weakened through 2026, FPI outflows became much larger. When the rupee was more stable, foreign investors were generally more comfortable bringing money into India.
Like crude oil, though, the rupee was only one part of the story. Interest rates, global events, company earnings and investor sentiment were all moving markets at the same time. Charts can show two things moving together, but understanding why they move together is what turns a pattern into an insight.
Few events shape India’s economy as much as the monsoon. Agriculture contributes less than one-fifth of the country’s GDP, yet it supports nearly half of India’s workforce. A good monsoon improves farm incomes, and that extra income eventually flows into many parts of the economy.
Some relationships are easy to understand. Better rainfall usually means higher sowing activity, which benefits fertilizer companies and tractor manufacturers. But the effects do not stop there. As rural incomes improve, spending on everyday goods and vehicles also tends to rise.
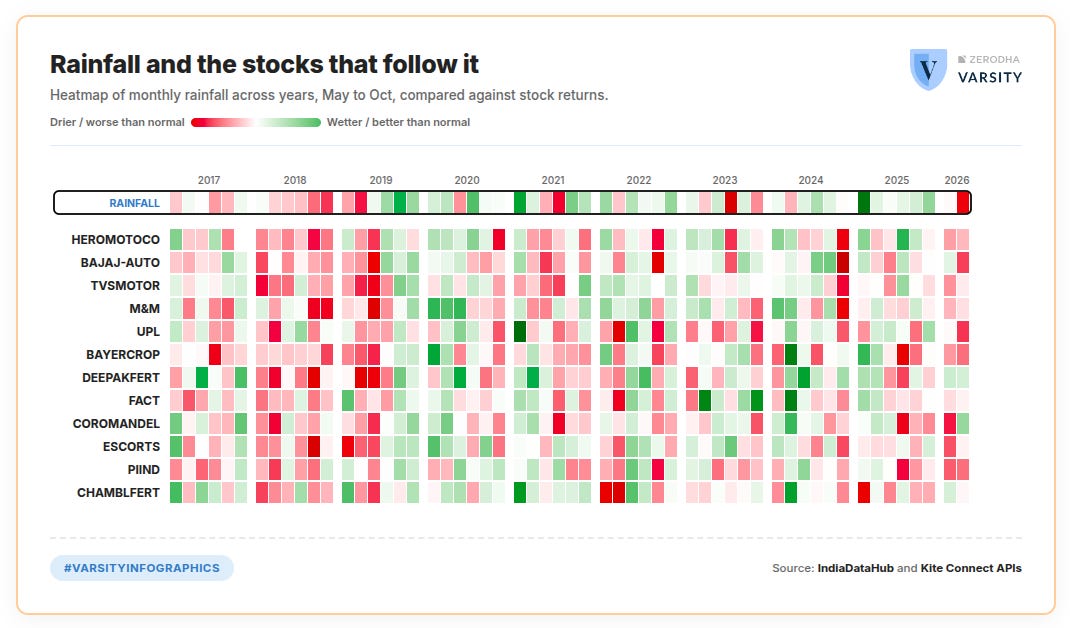
The chart above compares monthly rainfall with stock returns over the last two decades. Instead of looking at total rainfall, each month is compared with the same month in previous years to identify unusually wet or dry periods. Stock returns are then matched against these rainfall patterns.
As expected, fertilizer and tractor companies show a strong relationship with rainfall. FMCG companies also benefit as higher rural incomes support consumption. The strongest relationship, however, appears in the automobile sector, particularly two-wheeler manufacturers such as Hero MotoCorp, Bajaj Auto and TVS Motor. Good monsoons often boost rural demand, making motorcycles one of the first big-ticket purchases for many households.
Like crude oil and the rupee, the monsoon is only one of many factors affecting these stocks. Government policies, crop prices, rural credit and overall market conditions also play an important role. A relationship on a chart becomes meaningful only when it is backed by the economics behind it.
So far, every relationship we have seen had a logical explanation. Higher crude prices affect automobile companies. A weaker rupee influences foreign investors. Good monsoons support rural demand. The numbers matched the story.
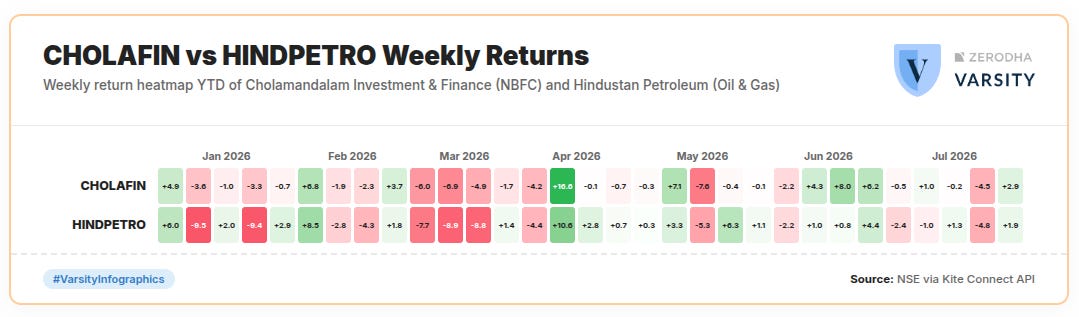
The chart above is different. Hindustan Petroleum (Oil & Gas) and Cholamandalam Investment & Finance (NBFC) belong to completely different industries, yet their weekly returns this year look surprisingly similar. At first glance, it seems easy to assume there exists a close economic relationshp.
But there is no obvious economic link between the two companies. Instead, both stocks were reacting to the same market environment. FII flows, interest rates and overall market sentiment affected them at the same time, making their prices move in similar ways.
This is an important reminder. Just because two assets move together does not mean they are connected. Before trusting any relationship, it is worth asking a simple question: Does it make economic sense?
Crude and a car maker are linked by fuel costs. The rupee and a foreign investor are linked by currency returns. Rainfall and a tractor are linked by a good harvest, higher farm income and, eventually, more spending.
Each of these relationships has a simple reason behind it.
The last pair, however, is linked only because both stocks happened to move in the same market at the same time.
The numbers alone cannot tell the difference. A real relationship and a false one can often look equally convincing on a chart.
Charts tell you that two things moved together. Economics tells you why they moved together. You need both before you can trust either.
For market education only, not investment advice.
This newsletter is written by Akshay Navin.
Do read, “Why OPEC is not a cartel” in our Tell My Why newsletter.
For any feedback or topic suggestions, write to us at varsity@zerodha.com

No posts
Comments
Nothing yet. Say the first thing.
Sign in to join the conversation.