
Welcome to the weekly report! This report is targeted at investors that don’t have time to monitor the ebbs and flows of the market day to day and still want to beat the market and avoid bear markets🚀. Just 10 minutes a weekend is all it takes.
I focus on the MAJOR themes and the MAJOR trends of the markets in this report. All the models I present are back tested with results so you can see that they work🤔.
This post is long - so make sure you read it on the Substack App or Website so you get to see the bottom of it - Email can often cut the message short. Let’s get into the weekly models!
The big story this week was that the Bond Market Intervention from Scott Bessent late last week simply flopped and produced the exact opposite effect he intended by adding risk premium to the bond markets associated with Treasury meddling in markets. The escape valve ended up being Corporate Debt, Gold and Bitcoin - all rallied pretty good. We were long gold and crypto over the last few weeks thank goodness and caught some nice trades. It was another unforced error from the Trump admin. They will need to see if they can repair the damage next week.
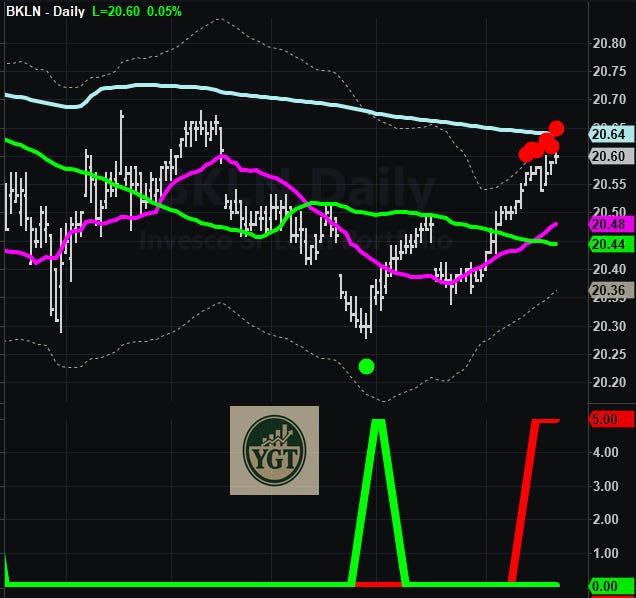
Corporate Higher Yielding Debt like Senior Loans have been on fire lately and it’s competing with US Government Debt in a meaningful way. Remember that MSFT 0.00%↑ MSFT has a better credit rating than the US Government. Folks (and Foreign Governments) are simply saying “no thanks” to all the stupidity up there in DC and going with the Corporations instead - at least they have to report to Shareholders and be accountable stewards of the money invested in their coffers. This chart is un-adjusted for Dividends (which are significant for this ETF at ~6% yearly). So, it’s even better than this when accounting for Divies.
Ethereum Weeklies show the longer-term setup here. It’s pretty overdone now on the Dailies, so I’d look for some multiweek digestion, but the longer-term prospects might be good. I’d look to see how it handles the pullback next.
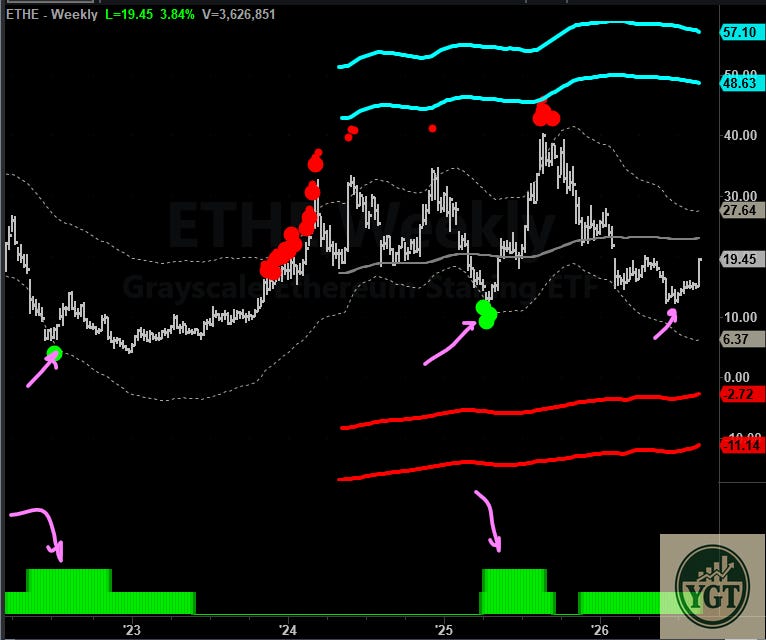
It’s a great time to review my old post where I analyzed Momentum in Crypto if you are thinking about piling in here and buying it expecting it to do what it did in the past. You might be disappointed.
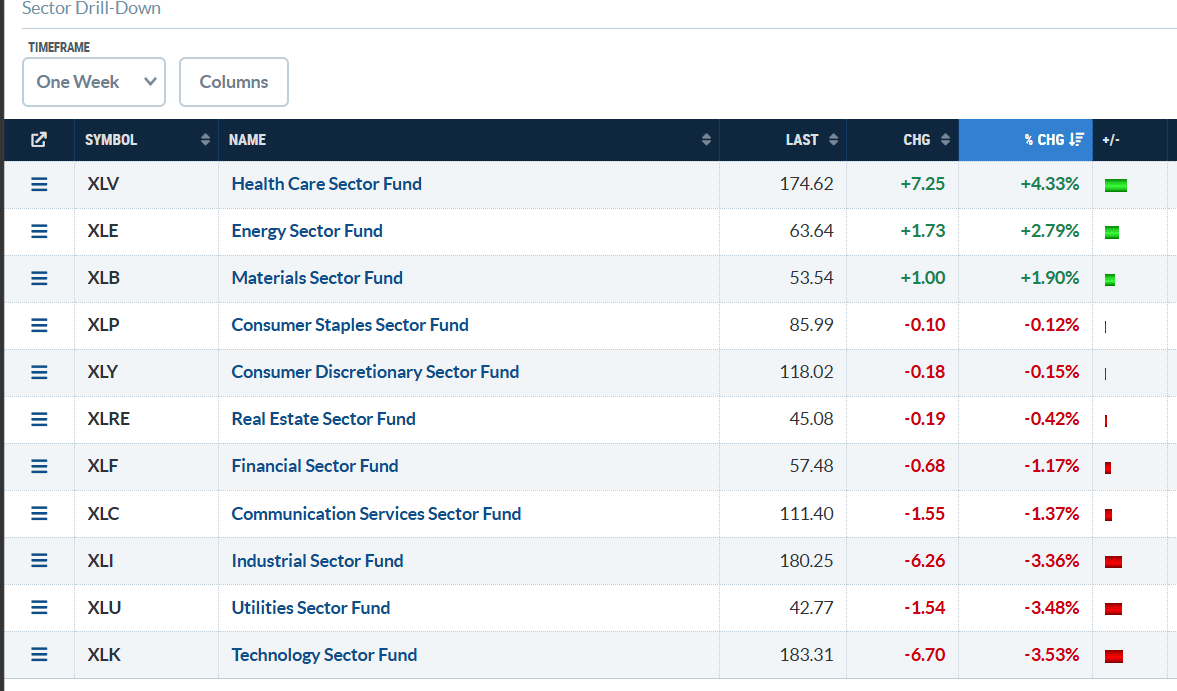
We can see after earnings this week from a swath of companies Consumer-Related, we finished the week down, but not nearly as bad as Tech did.
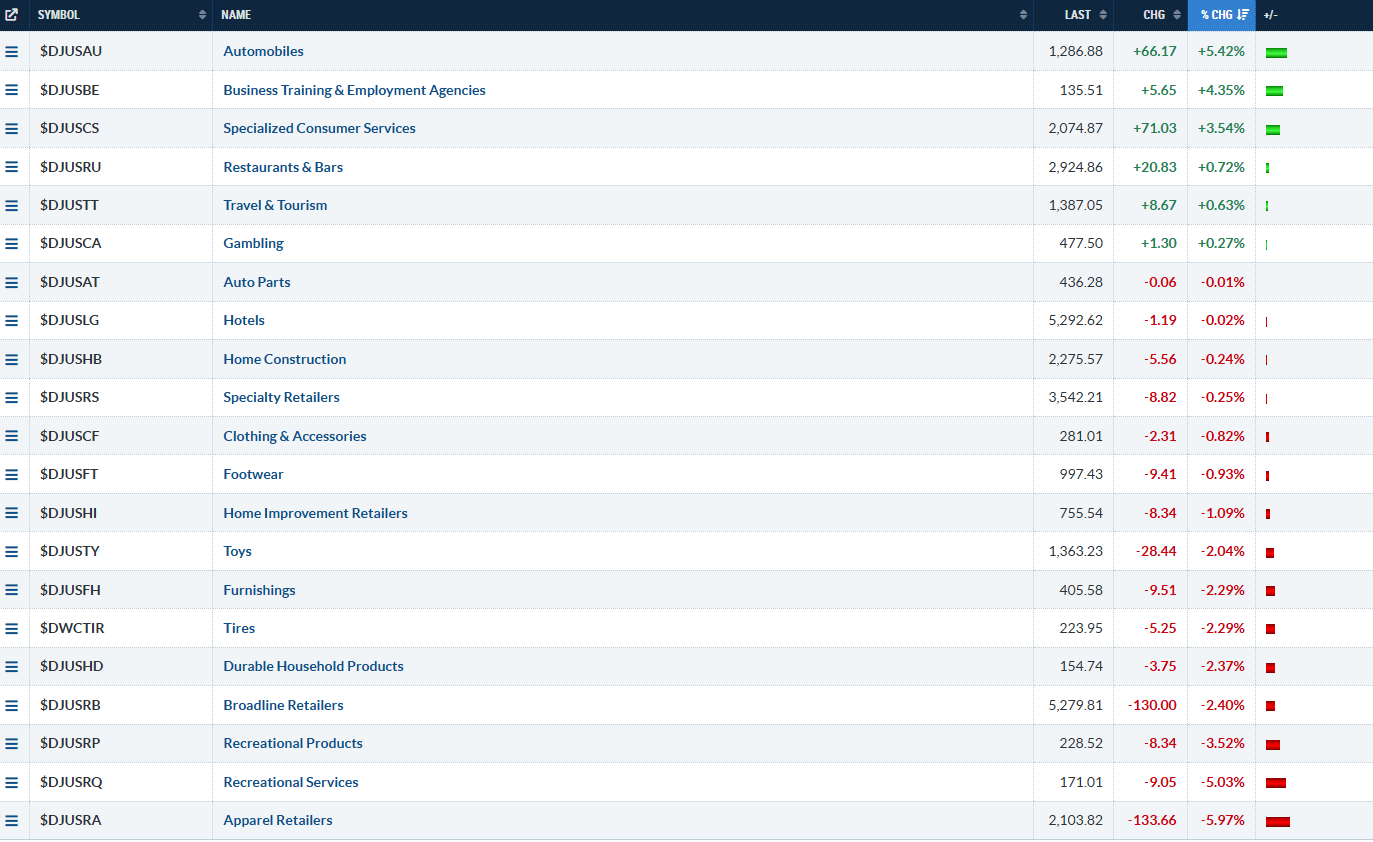
Here is the Industry Breakdown for the week in the Consumer Discretionary Sector. We can see thin participation, with only Autos and some Business Services (Software names) really running to the upside. The regular stuff like Apparel (Tariffs) and Recreation (People just not taking vacations because of Gas Prices) are taking a beating. Even poor old Toys is in rough shape.
The biggest takeaway for me this week was that Wal-Mart reported a pretty terrible quarter (worst Since COVID) and it absolutely nuked, dropping almost 10% in one day. That’s not good for the Consumer. But it’s so bad that it might be the beginning of a bottom here. I bought some WMT for myself for a long term hold simply because it’s in a 23% drawdown and in a Bear Market (which rarely happens to WMT).
Its P/E is still 37 though despite being down this much - it’s REALLY overvalued for a regular Brick and Mortar Retail Chain - so I didn’t buy a whole position and a lot of room to add if lower. Now, that valuation is not as bad as COST 0.00%↑ COST, which rests at an eye watering 47 P/E. But BJ 0.00%↑ BJ is sitting at only a 21 P/E and much better valuation.
Guess what BJ 0.00%↑ BJ did on Friday? Up 6% and well off a mini-dump after earnings associated with WMT. That’s what undervalued stocks do.
I personally think BJ is the best of the bunch for Big Box stores in terms of Value. They let you use Manufacturer Coupons in addition to having low prices on big box quantities. That’s super appealing to Bargain shoppers.
We got three big things next week.
We get inflation data on Wednesday (and some GDP Revisions that could be a disaster)
We get NVDA earnings Wednesday, along with a few other stocks that have risen SIGNIFIANTLY in the last few weeks. I’ll review the setup in Tuesday Night’s note with Options Flow and back testing on what to expect, etc.
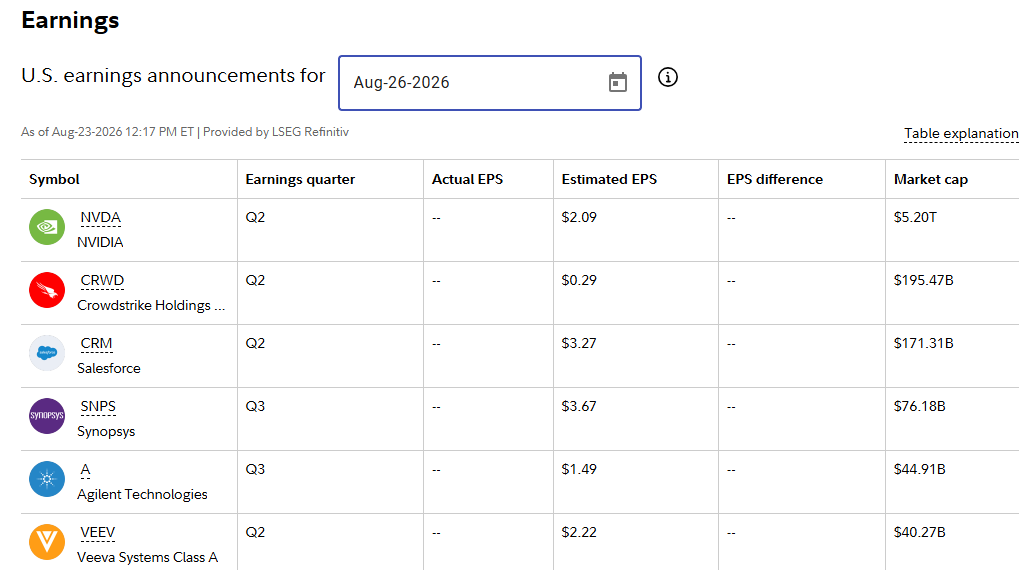
Friday is the big day though. We get Kevin Warsh talking at Jackson Hole. Tensions are high between this Admin and the Bond Markets - will he be able to talk Bond Traders off the cliff? I don’t know - he frankly seems out of his depth to me and extraordinarily naive.
Each week I review a chart or model that I would normally keep behind the paywall, I hope you can make a couple bucks off of it! 🤑
Last week we discussed the intermarket relationship between Singapore, and the US Stock market and suggested banks would be topping here. KBE 0.00%↑ KBE was down 4% last week. Pretty good right? 🎯🎯🎯
This week let’s talk about positioning. I’m going to do a Deep Dive. Normally, I would keep this behind a paywall for subs, so this should be a treat for everyone.
Have you heard about the “Record Short” positioning on the Nasdaq Futures? I’ll bet more than a few of you have. Let’s add some color to that and get the full picture of what’s actually going on.
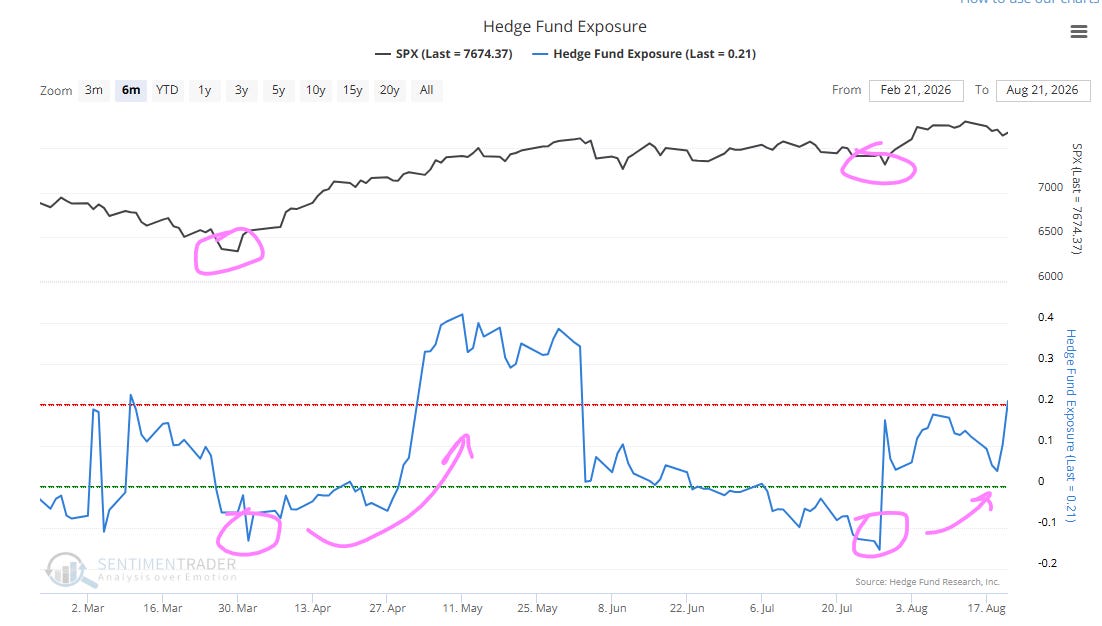
I’m going to review a simple indicator that expresses hedge fund exposure - we have just come off a period where they were pretty light on stocks. We got a rip-roaring rally and now they are heavy long here. So, a lot of short covering has already happened from Hedgies caught off guard.
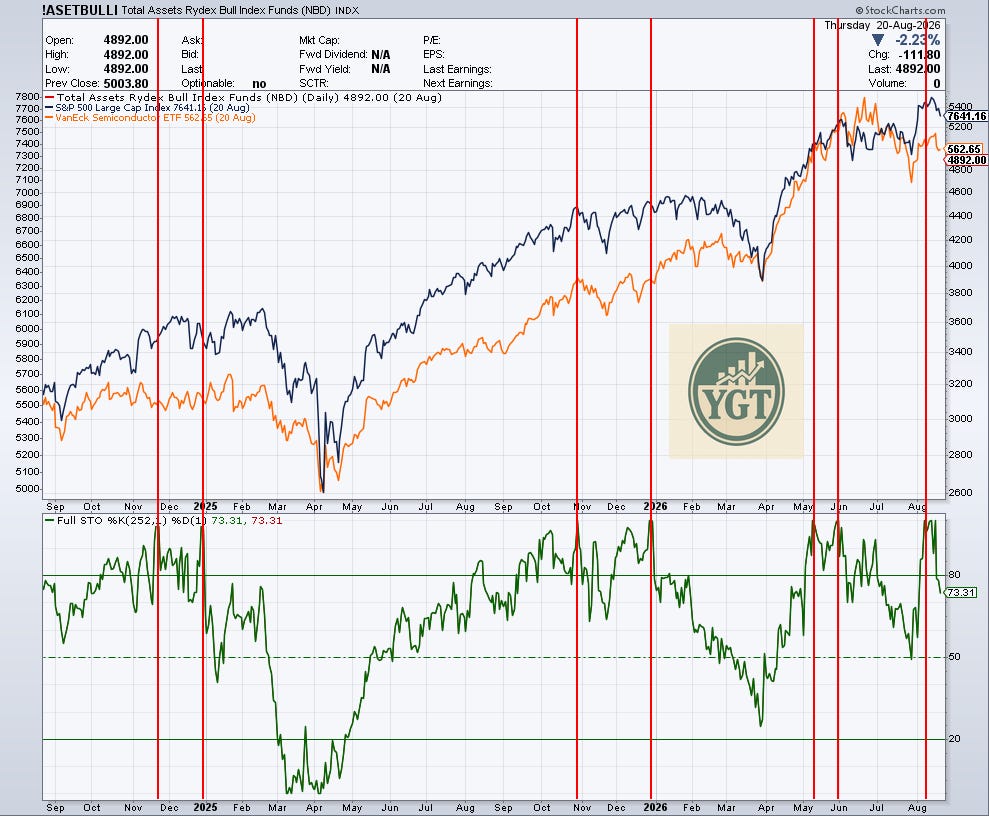
The bigger story here is smaller investors. We are seeing them pile into Bullish assets / stocks here. We are hitting the 100th percentile on the 1-year lookback from Rydex (they measure their actual customer accounts and report allocations daily - it’s real, actual Daily Positioning). I have marked the last few times we got 100th Percentile Exposure. It does not take a rocket scientist to see we usually stall and fall when this many people decide to buy stocks at once. As long as we don’t cross under the 50th percentile, we should be fine - but I am not sure we can avoid a hiccup going into the elections, especially with this many people loaded long. It is notable to see Semis are not making a new high with the Indexes (Orange Line) - they have rolled over early, just like they normally do.
Now - here is the Nasdaq Commitment of Traders positioning - this is the chart everyone is talking about (“Record SHORTS!”). The Blue Line is the one you want to keep an eye on. It represents positioning from Hedge Funds. They are net short a fair amount of NQ contracts here (negative numbers = short positions) - pretty darn short. I have marked when we’ve gotten conditions like this. It’s not some kind of slam-dunk long signal. It happens at the start of Bear Markets and (slightly more often) near Major Lows or Intermediate Term Lows.
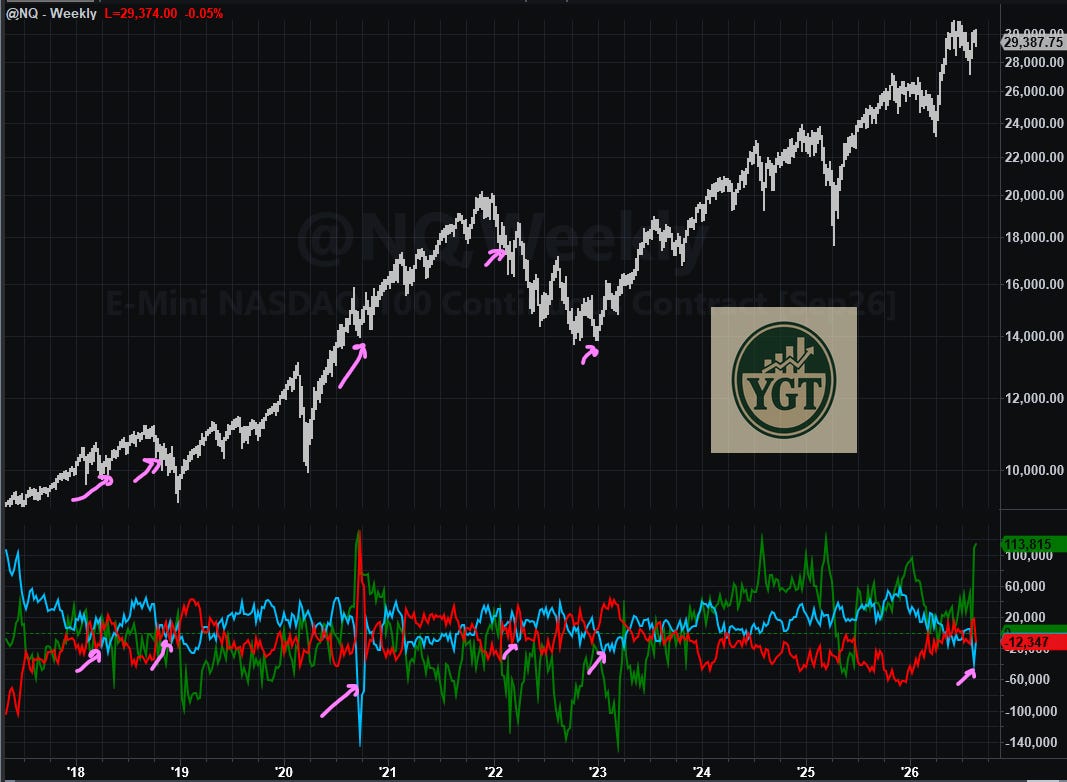
In other words - sometimes Hedge Funds are RIGHT.
The other thing to keep in mind is that other indexes (such as the S&P500, the Mid-Cap 400 and Small Caps) do not show this pattern. When you roll up the whole thing, adjust it for actual values of all the contracts and track the money itself - it paints quite a different picture here. Instead of a Short Squeeze, it looks more like we are seeing excessively long positioning. This is an indicator that shows the rolled up positioning as a percentile. It’s like in the 98th percentile long.
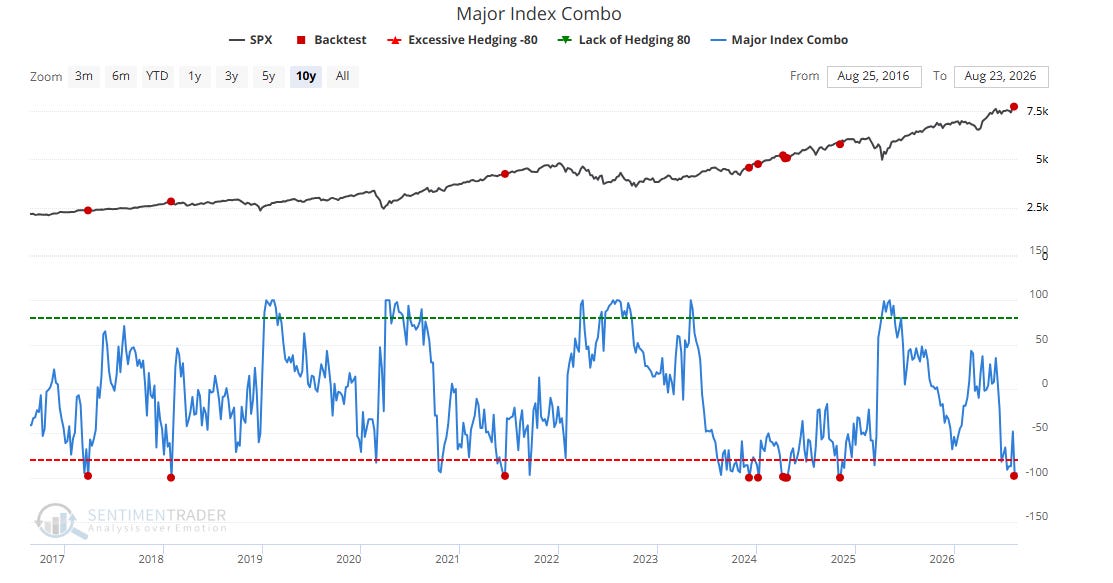
This matches with the actual Rydex data I just reviewed. Keep in mind when this says “Excessive Hedging” - it means hedging from Market Makers and Commercials, not the public / funds. You can see that when it gets in the Green, we usually form a Major Low. We are at the exact opposite of those conditions now. Past testing indicates basically no gains on average after conditions like this 2-Weeks later.
Now - that’s all well and good, but we know OPTIONS positioning is what REALLY drives these markets. Let’s Review the QQQ vs the SPY and see if anything pops out. QQQ Options Flow (White Line, Bottom Clip) is coming off a nasty Red Dot Setup. That means a ton of people went out and bought Calls Recently, which usually drops the market. We are seeing the ricochet effect of that right now.
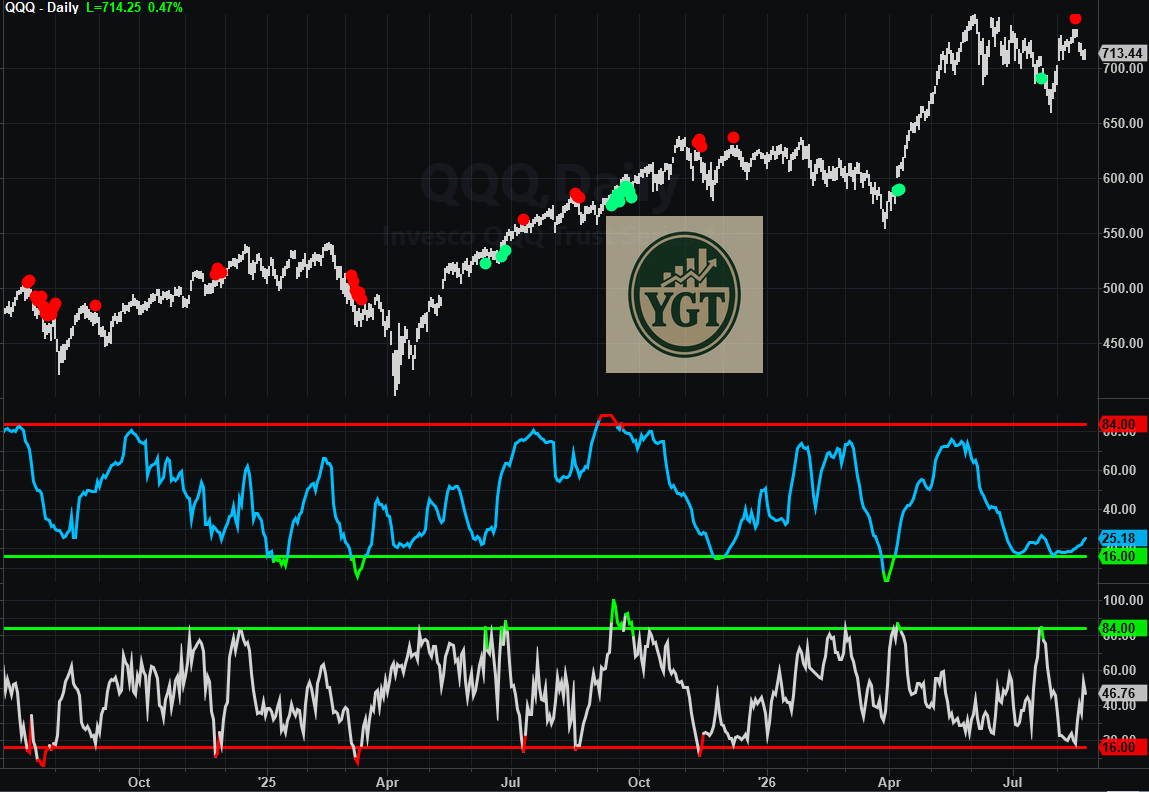
But look at the Blue Line - this reflects the Open Interest - the positioning that has been established over the last few months. It is indeed excessively Bearish (lots of Puts in the OI), and it matches the positioning on the Commitment of Traders report for the NQ Futures. So, yeah - we do see a lot of Bearish Positioning in the QQQs / NQ.
Is this going to make a short squeeze?! Well, look at the last time we got this setup. It topped us in December of 2025 - Red Dots with a Blue Line in the Green. The time before that? Right before we dumped into the Liberation Day lows. Context is key here. What SEEMs bullish needs to be tested and understood for what it actually MEANS.
When you have a lot of puts in the Open Interest, it’s dangerous because they can act to push the market down meaningfully if prices cross down into those strikes and the Puts begin to print money for their holders. The Market Makers that sold the puts to the hedgers will just sell the futures to become Delta Neutral as price drops. Often, the puts act as support before they become a liability though - and that’s what we are seeing over the last couple months of sideways action on NQ. Hard to go down, hard to go up.
Now, SPY is showing the opposite condition. Blue line (Open Interest Oscillator) is over the Red line, indicating a lot of Calls in the OI. This changed as soon as we got over the area where the last Red Dots last appeared (indicating where Excessive Call Positioning was added). That’s the effect I’m talking about - in this case it was resistance for months before we popped over it and market makers pushed the market up as price caused those Calls to go in the money). That was a little short squeeze.
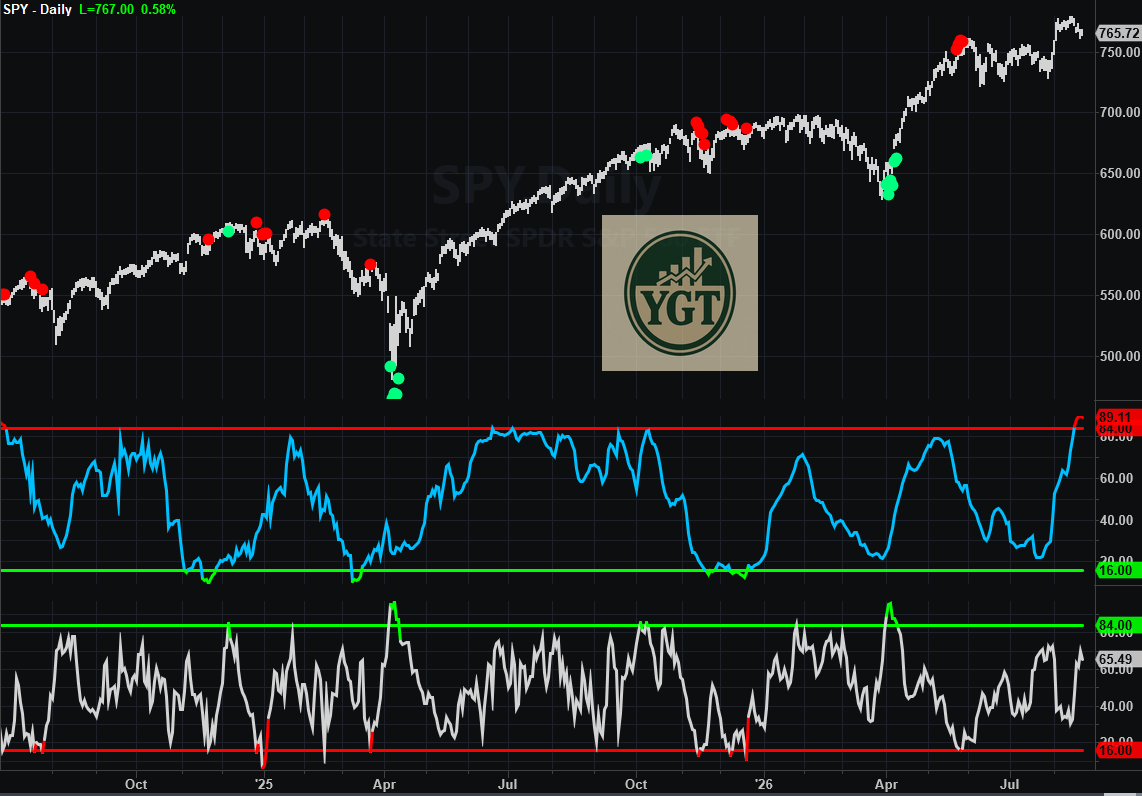
For QQQ, if we drop under key levels (say 695-700) on QQQ we’ll see a big drop in price because that’s where the Green Dot is on the QQQ Chart. It would be the reverse of what we just experienced a few weeks ago.
Options Flow (White Line) is more neutral on SPY but trending towards hedging and a more bullish condition for SPY, so no help there. If we did see the White Line hit the Green Line, I’d get much more bullish.
So - how am I using this in my own trading? I’m processing this as a condition. Positioning is only one factor that governs what happens next.
The Indexes are not positioned the same here - which is a formula for them to diverge and produce different returns going forward. Most of the time the QQQs and Tech are going to lead the rest of the Indexes, which means the conditions the QQQs are experiencing now could be coming in the future for the SPY and rest of the markets.
That would not be bullish because we’d shake out a lot of people pressing Calls on the rest of the market that is not Tech.
If you want to know when the positioning changes, then consider a Sub! I keep an eye on all this for everyone and let them know when the Major Turns are near.
Comments
Nothing yet. Say the first thing.
Sign in to join the conversation.