
*This one is long, make sure you click through to the site to read it, because your email provider might cut off the bottom of the email and there are some good charts in there at the bottom!*
Welcome to the Daily Report, where I review the day’s market moves and their drivers. I share signals for two portfolios, along with many Special Opportunity trades throughout the year.
Short-Term - 4-to-10-day trades, up 58% in 2025 and up 24.34% in 2026 (vs. 12.81% on SPX as of 8/4/26)
My retirement accounts - Mean reversion systems averaging 10–20% long term
All setups are backtested, and trades are executed at day’s end or on the open tomorrow. I personally follow these signals—full transparency.
Let’s review what happened today!
If you have questions, go here and watch the videos and read the FAQ. And feel free to send me a message - you’ll hear from me soon if you don’t anyway.
Well, today was a rough one for the Momentum Folks. I saw nothing but people posting about getting stopped out today and “how bad” this market is. We again had another day where we gapped down and had zero bid for Intraday Rallies.
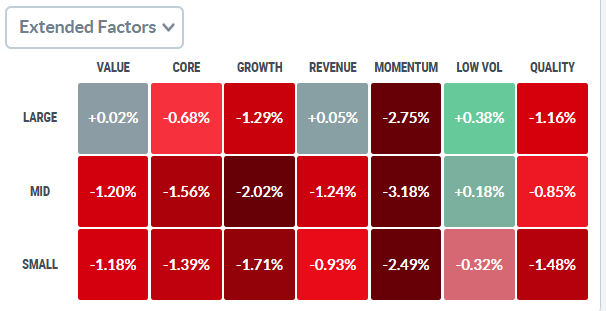
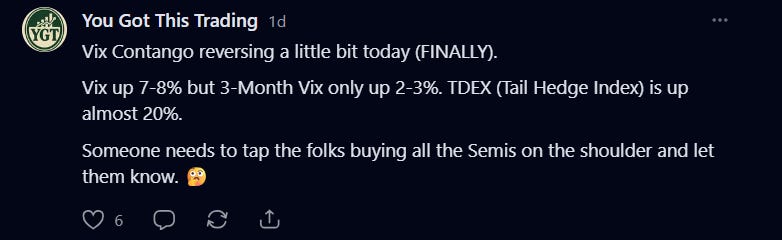
Yesterday I posted someone needed to tell the Mo-Mo folks the market had turned. Looks like it took a day longer than everyone else, but they got theirs today.
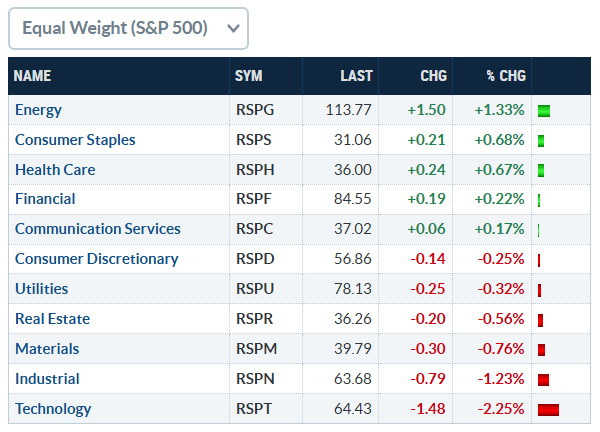
As far as sectors go, it was defensive with Staples and Healthcare rallying with Energy.
We continue to see the market “Split” in two. Stocks that go up when AI goes down are one market, and the other market is “AI” stocks and anything adjacent like $CAT. It hasn’t been this way since the early 1990s. It’s difficult to trade - if you are trend trading, I would avoid. For me, it’s not bad doing Mean Reversion because I buy the junk they sold last week and sell it when it goes back up a little bit.
Bitcoin and the MNST 0.00%↑ MNST are showing strength despite the general market malaise. Bio-Techs continued to show strength too. Both of those would rise if we were going to see Rate Cuts coming. Something to keep in mind if it continues.
The headlines were everywhere today - we are getting almost full saturation now on Bonds. Everyone is a bond expert I think now. Carefully crafted headlines suggest this is a GLOBAL bond yield problem. No way man.
Yeah - since 2020 yields are higher everywhere. But in the last 2 weeks? No, this is almost a singular issue in the US (and Japan - both are tied at the hip financially due to the Yen Carry trade).

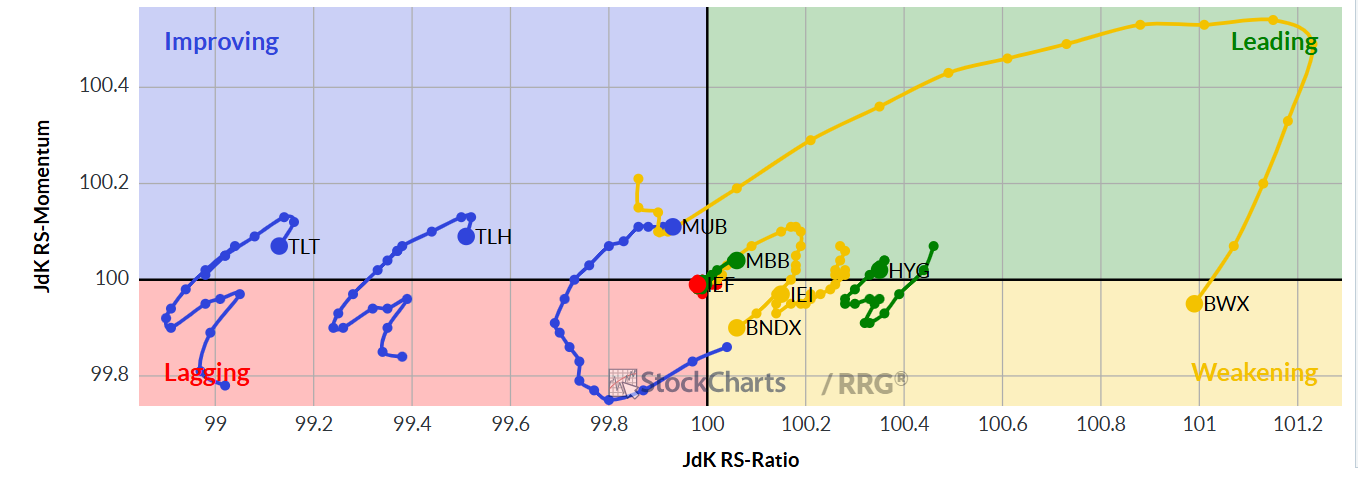
I’ve just taken a relative strength / rotation chart for the last 3-4 weeks to show you just what’s going on. We are seeing Corporate Debt (HYG) lead (top right corner), while the TLT (Long Term US Debt) sits in the far, bottom left corner - severely lagging. IEI 0.00%↑ IEI (7-10 Year US Debt) is also doing OK. Again, if you want to buy bonds, know what kind of bonds to buy - now more than ever it’s important.
What I notice is just how much BETTER International Bonds have done - BWX 0.00%↑ BWX (International Bonds ETF) is clearly the head and shoulders leader here from the last 3 weeks. So, when we see these headlines that make it look like it’s the “same” everywhere - it’s not. This is a US + Japan Government Long Term Debt problem.
I got a lot of comments from folks that wanted to see a Deep Dive on Oil. I’m going to do my best to outline what the charts are saying here and the path forward, including a surprising chart that might help with whether or not a TACO is incoming.
Comments
Nothing yet. Say the first thing.
Sign in to join the conversation.